Investor Presentation Q2 2021 - September 2021 - Elmos
←
→
Page content transcription
If your browser does not render page correctly, please read the page content below
Investor Presentation Q2 2021
September 2021
ELMOS CORPORATE OVERVIEW
           Corporate highlights                                          Sales breakdown                    Financial highlights H1 2021

   ~6 Elmos ICs
      on average in every new car
                                                                         Automotive focused:
                                                                        Sales by industry FY 2020   156 million Euro sales
                                                                                                        influenced by semiconductor allocation
                                                           Non-automotive
                                                                              15%
         product segments:                                                                                  percent EBIT margin
     6   Ranging, Optical, Sensor ICs, Motor Control,
         Lighting, Safety/Power/Custom ICs
                                                                                                      16    impacted by allocation-related effects,
                                                                                                            especially material price increases
                                                                                        85%
                                                              Automotive

   16 locations worldwide incl. 7 R&D centers
      HQ located in Dortmund, Germany                                  Global presence:
                                                                                                      47 million Euro net cash
                                                                                                         underlining Elmos’ strong financial position
                                                                  Sales by region H1 2021

                                                                        Rest of world
                                                                  US
 >35 years experience in analog
     mixed signal IC solutions
                                                                          10%
                                                                         1%
                                                                                          EU          76 percent equity ratio
                                                                                                         emphasizing Elmos’ financial solidity
                                                                                        44%

                                                                   45%
1,150    employees thereof 350+ product
         developers & engineers                         Asia/Pacific                                733 million Euro market capitalization
                                                                                                        (as of June 30, 2021)
                                                                                                                                                      2
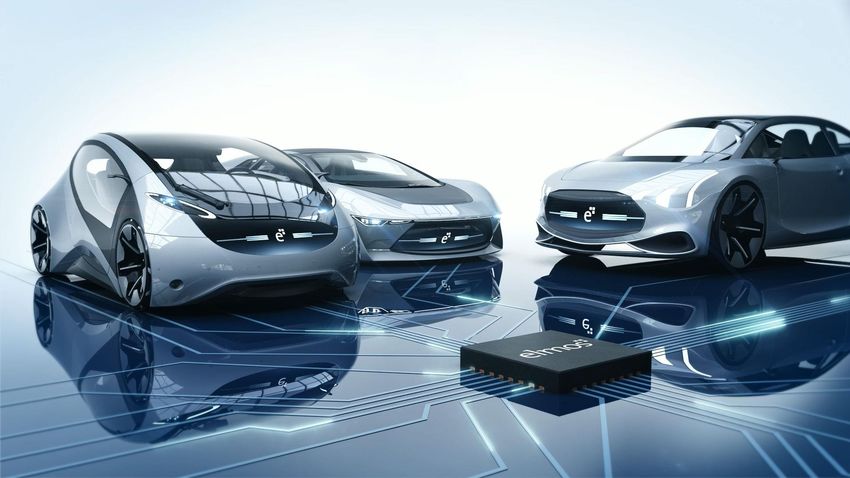
ELMOS INNOVATIVE SOLUTIONS FOR GLOBAL MEGA TRENDS
Leading innovator in future mobility
  #1 FOR ULTRASONIC ICs
  #1 FOR HVAC FLAPS
  #1 FOR GESTURE CONTROL
  #1 FOR AMBIENT AND REAR LIGHT

                                          USER EXPERIENCE   ADAS & AUTONOMOUS DRIVING   SAFETY

        COMFORT                        ELECTRIFICATION                 LIGHTING
                                                                                                 3
HIGHLIGHTS OF Q2 2021
The course of the pandemic has weakened somewhat, but the effects of the IC shortage are clearly noticeable now, as the
allocation has accelerated in the second quarter

   COVID-19 pandemic                              Semiconductor market                                    Strategic highlights
Starting in April 2021, Elmos has           The     ongoing      high     demand       for   The virtual AGM in May 2021 approved all agenda
coordinated 3 vaccination rounds for        semiconductors in all industries worldwide       items by a large majority. Dr. Dirk Hoheisel and Dr.
employees and their relatives. At our       has further accelerated the allocation           Volkmar Tanneberger were newly elected to the
Dortmund site alone, almost 600             situation along the entire value chain in the    Supervisory Board as shareholder representatives
people have been vaccinated.                second quarter.                                  alongside the long-serving board members and
                                                                                             company founders Dr. Klaus Weyer and Prof. Dr.
Since July 2021, first steps initiated to   The allocation of foundry capacities, supply     Günter Zimmer.
facilitate some of the Corona related       bottlenecks for key components, material
measures and gradual return to              price increases and logistical challenges are    Elmos is still fully on track for another successful year
offices.                                    having noticeable impact on the business         in new design wins, supported by a continued high
                                            performance.                                     level of R&D activities in all application fields.
After    summer     holidays,   fully
vaccinated employees will be able to        More and more market participants expect         Despite the temporary allocation situation, we have
access the social areas such as the         the capacity shortage and the effects of the     further intensified our CAPEX program in the backend
company gym and health and fitness          global semiconductor shortage to continue        and will invest a record amount in our testing area
programs will resume.                       in 2022.                                         this year, to install the necessary capacities to secure
                                                                                             our delivery capabilities.

                                                                                                                                                     4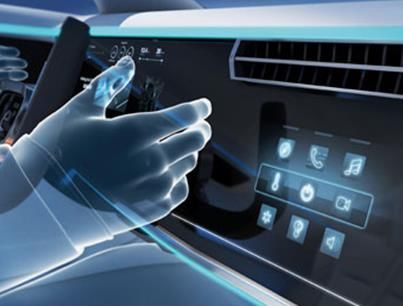
SALES AND EBIT
Quarterly sales (in million Euro) & gross margin (in %) Quarterly EBIT (in million Euro) & EBIT margin (in %)
+34.2% +296.3%
78.9 12.2 12.5
77.1
68.7 8.9
64.2 7.1
15.8% 15.9%
58.8 13.0%
11.0% 3.2
43.7% 43.2%
42.0% 40.9 42.2%
40.6% 5.4%
-10.5
29.1%
-25.7%
Q1 2020 Q2 2020 Q3 2020 Q4 2020 Q1 2021 Q2 2021
Q1 2020 Q2 2020 Q3 2020 Q4 2020 Q1 2021 Q2 2021
Sales in Q2 2021 were once again clearly above previous year (+34%) as Strong increase in EBIT to 12.5 million Euro based on higher volumes,
expected, supported by a strong increase in all product segments but allocation-related effects prevented an even more dynamic
The ratio of orders on hand for the next three months to sales over the development in the second quarter
past three months (book-to-bill) was above one at the end of the Q2 2021 EBIT margin of 15.9% precisely in line with the quarterly
reporting period guidance (16% ± 1.5%-points)
5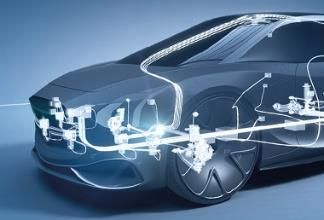
CAPEX AND R&D EXPENSES
1
CAPEX (in million Euro & in % of sales) R&D expenses (in million Euro & in % of sales)
17.3
12.8 12.5
12.1 12.3
11.8
21.9% 11.1
27.1%
9.1% 9.1% 8.6% 21.8%
7.4% 18.8%
5.6% 17.1% 15.9% 15.9%
5.8 5.9 5.7
3.3 3.7
Q1 2020 Q2 2020 Q3 2020 Q4 2020 Q1 2021 Q2 2021 Q1 2020 Q2 2020 Q3 2020 Q4 2020 Q1 2021 Q2 2021
Higher investments of 17.3 million Euro in Q2 2021 reflect the R&D expenses continue to remain on a high level at approximately
previously announced backend capex program 16% of sales
Q2 2021 CAPEX to sales ratio exceeds 20% After six months we are fully on track with our New Design Win
Investments in new testing equipment will continue in 2021 to expand activities with promising new projects in all product segments
the capacities to secure our delivery capabilities
1Capital expenditures for intangible assets and property, plant and equipment less capitalized development expenses 6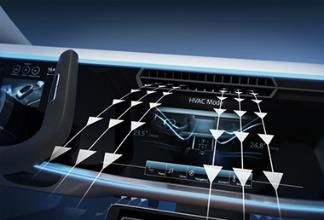
CASH FLOW
1
Operating cash flow (in million Euro) Adjusted free cash flow (in million Euro)
29.4 22.4
20.2 13.5
15.8
9.8
1.1
3.2
-0.5
-3.4
-5.9 -10.3
Q1 2020 Q2 2020 Q3 2020 Q4 2020 Q1 2021 Q2 2021 Q1 2020 Q2 2020 Q3 2020 Q4 2020 Q1 2021 Q2 2021
Despite the reduction of inventories by around 3 million Euro, the cash The lower cash flow from operations combined with a significantly
flow from operations in Q2 2021 was lower compared to Q1 2021 higher CAPEX spending resulted in a slightly negative adjusted free cash
mainly due to seasonal effects flow in Q2 2021
The major CAPEX program for the backend area continues to influence
the free cash flow in the further course of 2021
1Cash flow from operating activities less capital expenditures for/plus disposal of intangible assets and property, plant and equipment (including payments for shares and proceeds from additions to the scope of consolidation) 7
WORKING CAPITAL AND NET CASH
1
Working capital (in million Euro, at the end of the quarter) Net cash (in million Euro, at the end of the quarter)
113.5 117.2
110.3 112.9
102.9
92.5
84.7
Influenced by
share buyback
and dividend
60.3
47.3
39.5 39.4 40.2
Q1 2020 Q2 2020 Q3 2020 Q4 2020 Q1 2021 Q2 2021 Q1 2020 Q2 2020 Q3 2020 Q4 2020 Q1 2021 Q2 2021
Further reduction of the working capital in Q2 2021 is mainly the result Due to the higher investments in Q2 2021 and the dividend payment in
of lower inventories due to the ongoing strong demand in the May, our net cash position declined to 47.3 million Euro at June 30,
semiconductor market 2021, still above year-end 2020 level
Slightly lower receivables and higher accounts payables also improved
working capital at the end of Q2 2021
1Trade accounts receivables plus inventories less trade accounts payables 8MARKET FORECAST
Automotive market Automotive & semiconductor headlines
1
Light vehicle production in million units (IHS)
Global production of 3.9 million vehicles will
be lost in 2021 as a result of the shortage
AlixPartners, May 2021
-16.2% +11.4%
89.0
83.1 Supply bottlenecks and concerns over newly rising
74.6 infection numbers are weighing on economy
Ifo Institut, July 2021
ICs vendors to face tighter
8-inch fab capacity in 2022
DigitimesAsia, July 2011
2019 2020 2021e
Estimated regional market development YoY 2021/2020: AutomotiveNews Europe, July 2021
Europe (+12%)
China (+5%)
North America (+16%)
Reuters/Bloomberg, April 2021
1IHS Light Vehicle Production Forecast (June 2021) 9GUIDANCE FOR 2021
Elmos 2021 guidance (as of August 04, 2021)
Q3 2021
Sales: 79 ± 5 million Euro
EBIT margin: 15.5% ± 2 percentage points
Ø exchange rate: 1.20 EUR/USD
Full year 2021 (unchanged)
Significant increase in sales and EBIT compared to the previous year
Capital expenditures significantly higher year on year
Positive adjusted free cash flow above previous year expected
Notes to guidance 2021:
The 2021 guidance is based on relevant market and industry forecasts, which are
associated with certain risks due to the ongoing COVID 19 pandemic and are also
likely to be subject to greater fluctuations over the course of the year.
Our forecast ability is also significantly affected by the current allocation within
the IC market, combined with delivery constraints of key components based on
the global capacity bottlenecks.
10SHAREHOLDER STRUCTURE SET FOR LONG-TERM PERSPECTIVE
Elmos Semiconductor SE shareholder structure Elmos 5-year share price development
Reduction of share capital of 20,103,513.00 Euro by cancellation of 1,940,000 shares to
18,163,513.00 Euro as of August 17, 2021 Market capitalization (as of Aug. 31, 2021)
Public share buyback offer 2021 (a total of 1.05 million shares bought back at an offer 690 million Euro
price per share of 39.00 Euro) settled on September 6, 2021
Close Aug. 31, 2021
Further reduction of share capital of 18,163,513.00 Euro by cancellation of 463,513 45 € 38.00 Euro
shares to 17,700,000.00 Euro as of September 20, 2021
Elmos now holds 601,010 treasury shares / 3.40% of share capital 40 €
35 €
22.68%
30 €
40.60%
25 €
17.04% 20 €
15 €
3.40%
16.29%
10 €
Weyer Beteiligungsgesellschaft mbH and related parties
Jumakos Beteiligungsgesellschaft mbH 5€
ZOE-VVG GmbH and related parties
Treasury Stock 0€
Free float Jan-2016 Jan-2017 Jan-2018 Jan-2019 Jan-2020 Jan-2021
115-YEAR OVERVIEW ELMOS GROUP (IFRS)
12FINANCIAL CALENDAR / RESEARCH COVERAGE / IR CONTACT
Event Date Elmos Semiconductor SE – basic share data
1
Quarterly results Q2/2021 August 4, 2021 ISIN / WKN: DE0005677108 / 567710
1
Quarterly results Q3/2021 November 4, 2021 Stock symbol: ELG
Code: ELGG.De
Class: Non-par value bearer shares
Segment: Prime Standard, Regulated Market
Share capital: 17,700,000 € / shares
Institution Analyst Recommendation Investor Relations
Deutsche Bank Robert Sanders Hold Ralf Hoppe
Hauck & Aufhäuser Christian Sandherr Hold Head of Investor Relations & Public Relations
Oddo BHF Stéphane Houri Buy Phone +49 231 7549 7000
Warburg Research Malte Schaumann Hold Email ralf.hoppe@elmos.com
1TheGerman Securities Trading Act (Wertpapierhandelsgesetz) and the Market Abuse Regulation (EU) oblige issuers to immediately announce any information that may have a substantial price impact, irrespective of the communicated
schedules. Therefore it is possible that we will announce key figures of quarterly and annual results ahead of the dates listed above. As we can never rule out changes of dates, we recommend checking dates and news ahead of schedule on the
Company’s website (www.elmos.com).
13DISCLAIMER This presentation contains forward-looking statements based on beliefs of Elmos‘ management. Such statements reflect the company‘s current views with respect to future events and are subject to risks and uncertainties. Many factors could cause the actual results to be materially different, including, among others, changes in general economic and business conditions, changes in currency exchange rates and interest rates, introduction of competing products, lack of acceptance of new products or services and changes in business strategy. Actual results may vary materially from those projected here. Elmos does not intend or assume any obligation to update these forward-looking statements. Elmos Semiconductor SE Heinrich-Hertz-Str. 1 | 44227 Dortmund | Germany | Telephone: + 49 231 75 49 0 | info@elmos.com | www.elmos.com
You can also read