Raymond James 41st Annual Institutional Investors Conference March 4, 2020
←
→
Page content transcription
If your browser does not render page correctly, please read the page content below

Raymond James
    41st Annual Institutional
    Investors Conference
    March 4, 2020

1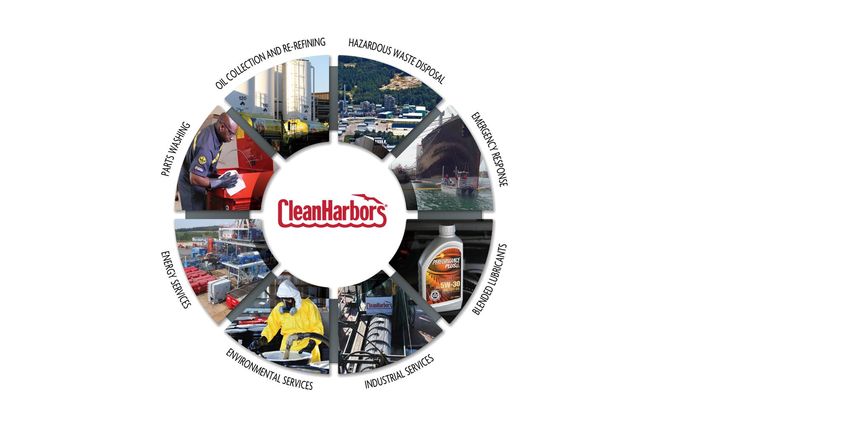
Forward Looking Statements and
     GAAP Disclaimer
These slides contain (and the accompanying oral discussion will contain) “forward-looking statements” within the meaning of the Private Securities Litigation Reform Act of
1995. Such statements involve known and unknown risks, uncertainties and other factors that could cause the actual results of the Company to differ materially from the
results implied by such statements, including general economic and business conditions, conditions affecting the industries served by the Company and its subsidiaries,
conditions affecting the Company’s customers, competitor responses to the Company’s products and services, the overall market acceptance of such products and services,
the integration of acquisitions and other factors disclosed in the Company’s periodic reports filed with the Securities and Exchange Commission. Such statements may include,
but are not limited to, statements about the Company’s business outlook and financial guidance and other statements that are not historical facts. Consequently such forward-
looking statements should be regarded as the Company’s current plans, estimates and beliefs. The Company does not undertake and specifically declines any obligation to publicly
release the results of any revisions to these forward-looking statements that may be made to reflect any future events or circumstances after the date of such statements or to
reflect the occurrence of anticipated or unanticipated events.

Statement Regarding use of Non-GAAP Measures:
Adjusted EBITDA, adjusted free cash flow, adjusted net income (loss) and adjusted earnings (loss) per share, as presented in these slides, are non-GAAP financial measures and
should not be considered alternatives to other measurements under generally accepted accounting principles (GAAP), but viewed only as a supplement to those measurements.
These non-GAAP measures are not calculated identically by all companies. Therefore our measurement of Adjusted EBITDA, while defined consistently and in accordance with our
existing credit agreement, and our measurements of adjusted free cash flow, adjusted net income (loss) and adjusted earnings (loss) per share may not be comparable to similarly
titled measures reported by other companies. We believe that Adjusted EBITDA provides additional useful information to investors since our loan covenants are based upon levels
of Adjusted EBITDA achieved and the fact that management routinely evaluates the performance of its businesses based upon levels of Adjusted EBITDA. We believe adjusted
free cash flow provides useful information to investors about our ability to generate cash. We believe adjusted net income (loss) and adjusted earnings (loss) per share provide
useful information about our performance excluding non-recurring or extraordinary items.

Adjusted EBITDA consists of net income (loss) plus accretion of environmental liabilities, depreciation and amortization, net interest expense, loss on early extinguishment of debt,
provision for income taxes and excludes other gains, losses and non-cash charges not deemed representative of fundamental segment results and other (income) expense, net.
Adjusted free cash flow consists of net cash from operating activities excluding cash impacts of items derived from non-operating activities, such as taxes paid in connection with
divestitures, less additions to property, plant and equipment plus proceeds from sale of fixed assets. All amounts in USD unless otherwise noted.

For a reconciliation of non-GAAP measures to its nearest GAAP equivalent, please refer to the Company’s quarterly news releases, which are filed on Form 8-K with the Securities
and Exchange Commission.

 2
Mission

              “Create a Safer, Cleaner Environment
              Through the Treatment, Recycling and
              Disposal of Hazardous Materials”

3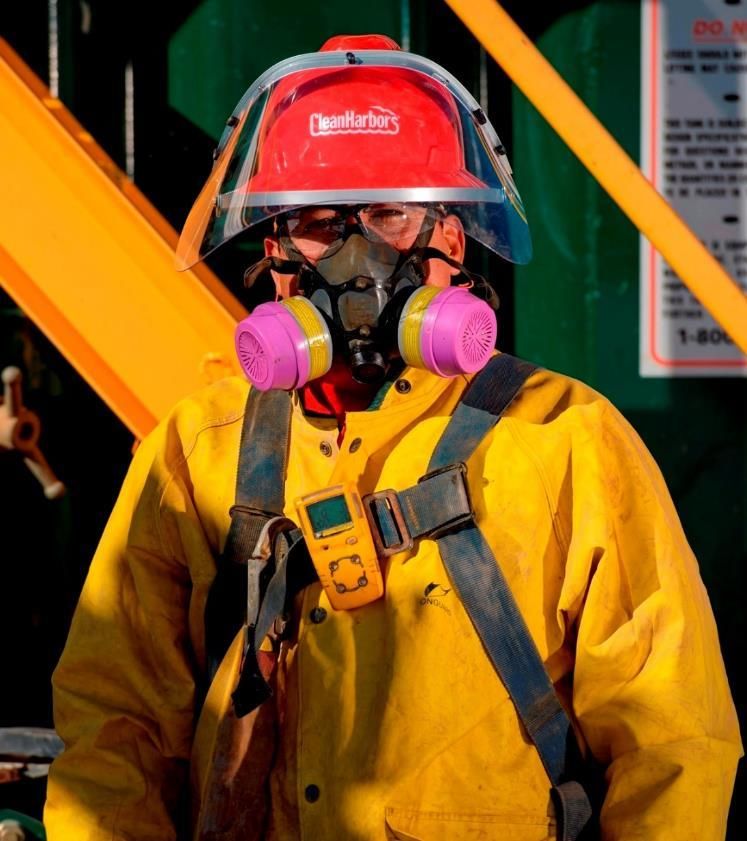
Company Snapshot
                       ▪ In North America:
                           - Largest hazardous waste disposal
                             company
                           - Largest collector, recycler and re-refiner
                             of used oil
                           - Leading provider of comprehensive environmental,
                             energy and industrial services
                       ▪ Top 20 largest private motor carriers
                       ▪ More than 300,000 customers including a majority of
                         the Fortune 500
                       ▪ More than 14,000 employees
                       ▪ More than 100 waste management facilities
                       ▪ More than 450 service locations in the US, Canada,
                         Mexico and Puerto Rico

4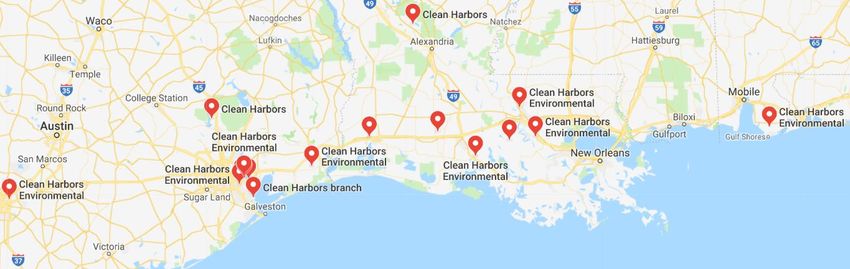
Business Model
                   Gather Waste             Transport Waste   Transfer, Treat, Recycle
                  Perform Services                                and Re-Refine
                                                                                         Disposal
                                             and Waste Oil

                             Technical
Environmental Services

                             Services

                             Industrial
                              Services

                              Field
                             Services

                          Energy Services

                           Safety-Kleen

5
Broad Asset Infrastructure
▪ More than 100 Waste
  Management Facilities
    - 9 Incinerators
    - 11 Landfill Sites
    - 18 Treatment, Storage & Disposal
      Facilities (TSDFs)
    - 8 Solvent Recycling Facilities
    - 9 Wastewater Treatment
      Operations
    - 9 Oil Accumulation Centers
    - 6 Re-refineries

• More than 10,000 Company Vehicles

6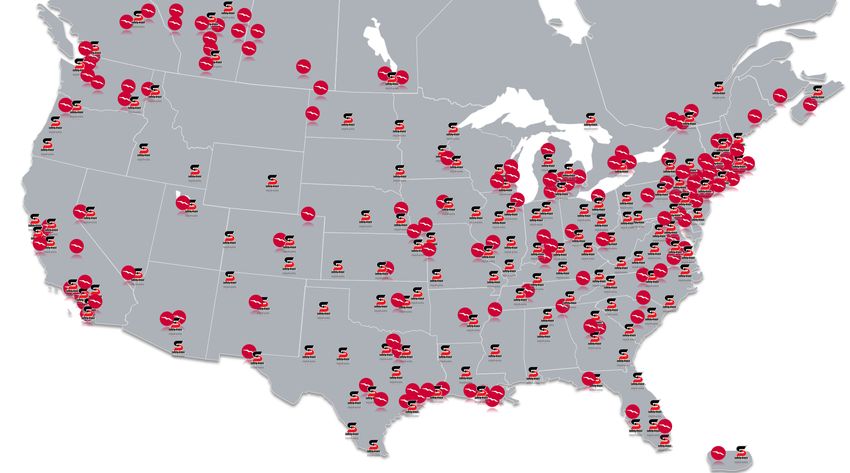
Expansive Service Network

                                 LEGEND

                                CLEAN HARBORS

                                SAFETY-KLEEN

7
Market Diversification – Top 10 Industries Served

                               2017   2018   2019
    Manufacturing              16%    17%     16%
    Chemical                   13%    14%     14%
    Refineries                 9%     8%      9%
    Automotive                 8%     7%      8%
    Base and Blended Oils      8%     8%      7%
    Government                 7%     6%      6%
    Utilities                  5%     5%      5%
    Transportation             4%     4%      4%
    Oil & Gas                  4%     4%      4%
    Engineering & Consulting   3%     3%      4%
    Other Industries           23%    24%     23%

8
Reporting
    Segments

9
Environmental Services
                                         Landfills &         TSDFs
     Business Drivers                    Wastewater

     ▪ GDP and industrial output

     ▪ Regulation and compliance

     ▪ Captive incinerator market           Incineration        Skilled Labor &
                                                                Transportation
     ▪ Demand for turnarounds
                                          Energy
     ▪ Emergency Response events          Services
                                                  Field        Industrial
     ▪ Cross-selling with Safety-Kleen           Services       Services

     Key Metrics
     ▪ Incineration utilization
                                                       Annual Revenue
     ▪ Landfill volumes                                 ~$2.2 Billion

10
Chemical Manufacturing Renaissance
Aligns with Our Gulf Network of Locations
▪ In past decade, 334 U.S. chemical manufacturing projects – cumulatively valued at $204 billion –
have been announced*
▪ 53% of that total have been completed or under construction to date*
▪ High concentration of those facilities are located in the Gulf region (representative examples on map)**
*American Chemistry Council May 2019
**Plant expansion locations from variety of sources
11Safety-Kleen
Business Drivers
▪ Placement of more parts washers Containerized
Waste
▪ Regulation and compliance Services
Parts Allied
▪ Crude oil pricing Products
Washers
▪ Base oil market demand Vac.
Services
▪ Closed loop offering - OilPlus® Byproducts
& Other Base
Key Metrics Oils
Blended
▪ Average UMO price Oils
▪ Waste oil volume collected
▪ Number of parts washers services Annual Revenue
▪ % of blended sales and direct volumes ~$1.2 Billion
12Oil Change and Lube Shop Sales 2012-2022
Historical Growth Forecast Growth
$7,212
$6,990
$6,717
$6,500
$6,292
$6,050
$5,879
$5,599
$5,391
$5,078 $5,220
2012 2013 2014 2015 2016 2017 2018 2019 2020 2021 2022
Source: Auto Care Association and LubesNGreases
13Direct Lubricant Sales Model UMO Terminals
UMO Collection
Re-refineries
Safety-Kleen
OilPlus®
Customers Closed Loop
Blending &
Packaging
Renewable
Lubricants Delivery
Distribution Centers
14Sustainability at Clean Harbors
▪ We have a great sustainability story at Clean Harbors
▪ It touches many parts of the organization
▪ Demand from our customers for more sustainable and “green” solutions
is rapidly growing, especially among government and public entities
▪ Potential financial benefits beyond increased sales include cost savings,
increased recycling and other areas such as potential carbon credits
15Examples of Our Sustainability
▪ Re-refineries: More than 3.5 billion gallons of used oil processed
in its history; avoiding over 29 million metric tons of GHG
▪ Solvent recycling: ~1 million parts washer services annually using
recycled solvents and aqueous solutions
▪ Incinerators: More than 8 million metric tons of CO2 emissions avoided since
2013 by CFC destruction
▪ Refurbishment shops: 80% of all materials are recycled
▪ Emergency Response: Approximately 6,000 ER services provided to
communities in 2019, majority of which are chemical releases into the
environment
16Corporate
Strategy
17Growth Strategies
Expand Offerings and Geographic Coverage
Execute Cost, Pricing and Productivity Initiatives
Pursue Acquisitions and Divestitures
Add Network Capacity
Cross-Sell Across the Businesses
182020 Strategic Update
▪ Continue investments in workforce to grow employee base and
lower voluntary turnover
▪ Increase leverage of facilities network through pricing
initiatives, mix of waste streams and greater project volumes
▪ Launch E-commerce platform
▪ Capitalize on IMO 2020 market conditions
▪ Pursue emerging growth opportunities such as PFAS
▪ Capitalize on growing market acceptance of our sustainable offerings
▪ Execute capital allocation strategy
19Financial
Overview
20Summary of Q4 and 2019 Results Q4 ▪ Revenue increases 1% to $871.0M ▪ GAAP EPS of $0.43; Adjusted EPS of $0.42 ▪ Adjusted EBITDA* growth of 8% to $132.2M ▪ Adjusted EBITDA margin climbs 100 bps to 15.2% 2019 ▪ Revenue increases 3% to $3.4B ▪ GAAP EPS of $1.74; Adjusted EPS of $1.89 ▪ Adjusted EBITDA* growth of 10% to $540.3M ▪ Record Adjusted Free Cash Flow* of $208.5M ▪ TRIR of 1.05 – lowest in our history * For a reconciliation of non-GAAP measures to its nearest GAAP equivalent, please refer to the company’s fourth-quarter news release dated February 26, 2020. 21
Balance Sheet Highlights

                                               12/31/19   12/31/18

      Cash and securities                      $414.4M    $279.4M

      Billed & unbilled receivables            $701.1M    $661.7M

      Inventories and supplies                 $214.7M    $199.5M

      Current and long-term debt obligations   $1,562M    $1,573M

      Accounts payable                         $298.4M    $276.5M

      Environmental liabilities                $189.8M    $190.9M

22
Historical Adjusted Free Cash Flow (USD $ in millions) 2015 2016 2017 2018 2019 Cash Flow from Operations $396.4 $259.6 $285.7 $373.2 $413.2 Capital Expenditures, net of disposals (251.0) (198.6) (159.9) (177.9) (204.7) Tax liability on sale of business $14.4 Adjusted Free Cash Flow $145.4 $61.0 $140.2 $195.3 $208.5 Sale of Businesses $47.1 $45.4 23
Capital Allocation Strategy

     ▪ Four key elements:

        Organic                            Share
        Growth         Acquisitions                           Debt
                                        Repurchases         Repayment
      Investments

     ▪ Invest capex to drive growth
     ▪ Evaluate acquisition and divestiture opportunities
     ▪ Execute buyback plan
     ▪ Assess current debt structure

24
Questions? 25
You can also read