Tactical Dashboard 7.2 - ST-OST 200 SP07 PUBLIC - SAP Help Portal
←
→
Page content transcription
If your browser does not render page correctly, please read the page content below

User Guide                                  PUBLIC
Focused Insights for SAP Solution Manager
Document Version: 1.7 2021-01-26

Tactical Dashboard 7.2
ST-OST 200 SP07

Document History

    Version              Date         Change

    1.0                  2017-06-15   Initial version

    1.1                  2017-07-31   Support Package 1 (SP01)

    1.2                  2018-07-12   Support Package 2 (SP02)

    1.3                  2019-02-21   Support Package 3 (SP03)

    1.4                  2019-07-19   New scenario: SAP HANA Memory
                                      Update in several sections

    1.5                  2020-01-07   Update of the maintenance scenario section

    1.6                  2020-05-14   New system Type: WEB DISPATCHER

    1.7                  2021-01-26   Support Package 7 (SP07)

Tactical Dashboard 7.2                                                                                                           PUBLIC
Document History                                                          © 2021 SAP SE or an SAP affiliate company. All rights reserved.   2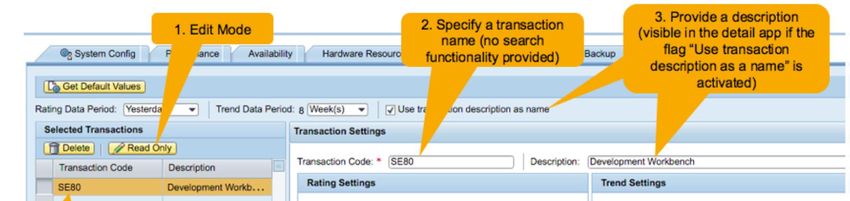
Contents

1           Introduction .............................................................................................................................................. 5

2           Configurations ........................................................................................................................................... 8
2.1         Instance Configuration............................................................................................................................... 9
            2.1.1     Add an Instance ........................................................................................................................ 9
            2.1.2     Edit an Instance ...................................................................................................................... 10
            2.1.3     Delete an Instance .................................................................................................................. 11
2.2         System Configuration .............................................................................................................................. 12
            2.2.1     Add a System .......................................................................................................................... 12
            2.2.2     Edit a System .......................................................................................................................... 13
            2.2.3     Delete a System ...................................................................................................................... 13

3           Scenarios................................................................................................................................................. 15
3.1         Performance ........................................................................................................................................... 15
            3.1.1        Tile and Main View.................................................................................................................. 16
            3.1.2        Detail view.............................................................................................................................. 16
            3.1.3        Configuration.......................................................................................................................... 17
3.2         Hardware Resources ................................................................................................................................ 18
            3.2.1        Tile and Main View.................................................................................................................. 18
            3.2.2        Detail view.............................................................................................................................. 18
            3.2.3        Configuration.......................................................................................................................... 19
3.3         Availability .............................................................................................................................................. 20
            3.3.1        Tile and Main View.................................................................................................................. 20
            3.3.2        Detail View ............................................................................................................................. 20
            3.3.3        Configuration.......................................................................................................................... 21
3.4         Database backup ..................................................................................................................................... 22
            3.4.1        Tile and Main View.................................................................................................................. 22
            3.4.2        Detail View ............................................................................................................................. 22
            3.4.3        Configuration.......................................................................................................................... 23
3.5         Database Growth .................................................................................................................................... 24
            3.5.1        Tile and Main View.................................................................................................................. 24
            3.5.2        Detail View ............................................................................................................................. 25
            3.5.3        Configuration.......................................................................................................................... 26
3.6         Users Load .............................................................................................................................................. 26
            3.6.1        Tile and Main View.................................................................................................................. 26
            3.6.2        Detail View ............................................................................................................................. 26
            3.6.3        Configuration.......................................................................................................................... 27
3.7         Maintenance ........................................................................................................................................... 28
            3.7.1        Tile and Main View.................................................................................................................. 28
            3.7.2        Detail View ............................................................................................................................. 28
            3.7.3        Configuration.......................................................................................................................... 29
3.8         Security ................................................................................................................................................... 30
3.9         Transactions Performance ....................................................................................................................... 30
            3.9.1        Tile and Main View.................................................................................................................. 30

Tactical Dashboard 7.2                                                                                                                                                    PUBLIC
Contents                                                                                                           © 2021 SAP SE or an SAP affiliate company. All rights reserved.   3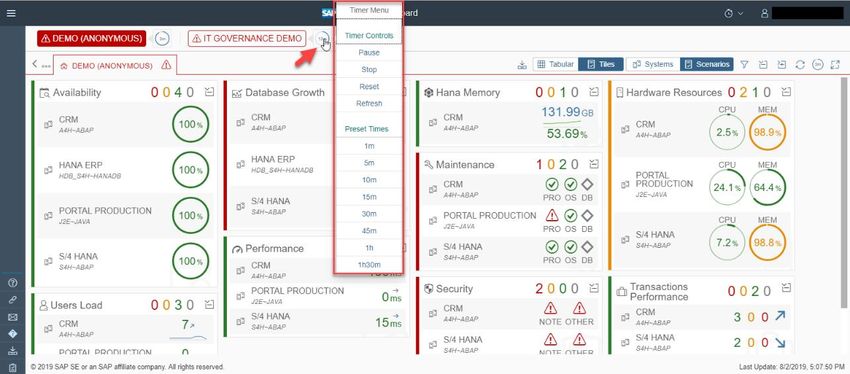
3.9.2     Detail View ............................................................................................................................. 31
            3.9.3     Configuration.......................................................................................................................... 33
3.10        PI Monitoring .......................................................................................................................................... 34
            3.10.1    Tile and Main View.................................................................................................................. 34
            3.10.2    Detail View ............................................................................................................................. 34
            3.10.3    Configuration.......................................................................................................................... 35
3.11        Hana Memory ......................................................................................................................................... 35
            3.11.1    Tile and Main View.................................................................................................................. 36
            3.11.2    Detail View ............................................................................................................................. 36
            3.11.3    Configuration.......................................................................................................................... 37

4           Dashboard............................................................................................................................................... 38
4.1         Access Dashboard.................................................................................................................................... 38
4.2         Dashboard Layout ................................................................................................................................... 39
            4.2.1     Header.................................................................................................................................... 40
            4.2.2     Instances Selection Header...................................................................................................... 43
            4.2.3     The Content Area .................................................................................................................... 43
4.3         Content Navigation.................................................................................................................................. 44

Tactical Dashboard 7.2                                                                                                                                                 PUBLIC
Contents                                                                                                        © 2021 SAP SE or an SAP affiliate company. All rights reserved.   4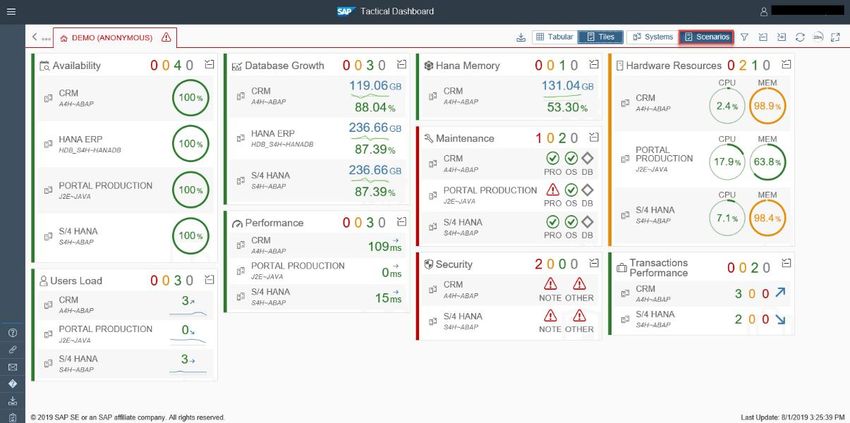
1               Introduction

The Dashboard allows reporting the status of a selected list of systems and KPI’s that can be configured with individual
thresholds based on a pre-defined set of Scenarios:

 •      Performance
 •      Availability
 •      Hardware Resources
 •      Database Growth
 •      Database Backup
 •      Users Load
 •      Transactions Performance
 •      Maintenance
 •      Security
 •      Operations Dashboard Instance
 •      PI Monitoring
 •      Hana Memory

Far from being just a “real time” monitoring tool, the objective of the dashboard is to make it easier for decision makers to take
tactical choices. For this purpose, it provides different trend indicators that can be used to understand how the system is
behaving or if there are anomalies in specific areas.
This is done by comparing recent period (e.g. yesterday or last week) with averages calculated on a longer period (e.g. last 6
months or last 12 months).

                                                   Performance Trend Calculation

Two views can be used to display information in the Dashboard, “Tabular” and “Tiles”.
In Tabular view, the content is organized inside a cross-table with 1 st column is the systems, and the subsequence columns are
for different scenarios like in image below. The content is also simplified to fit in the table.

Tactical Dashboard 7.2                                                                                                                    PUBLIC
Introduction                                                                       © 2021 SAP SE or an SAP affiliate company. All rights reserved.   5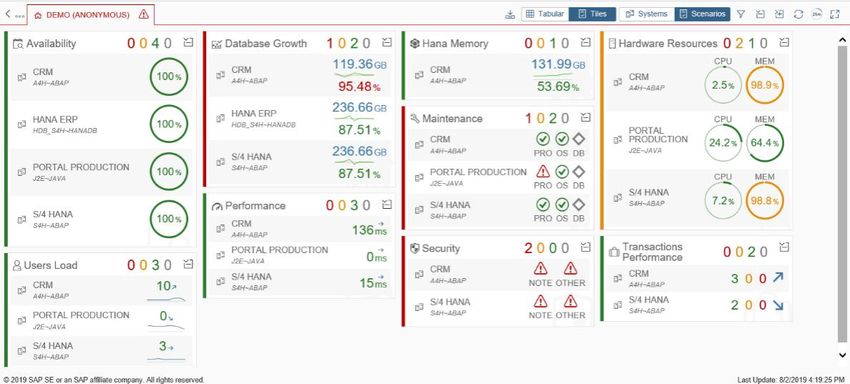
Tactical Dashboard - Tabular View

In Tiles view, the content is organized in tiles. In this view, there are 2 perspectives you can choose: "Systems", or "Scenarios".
The Systems view will present each system one tile, and scenarios configured for system as the content of the tile. The
Scenarios is just the opposite of the Systems view, where each scenario is a tile, and the systems are the content.

                                         Tactical Dashboard - Tiles View - Systems Perspective

                                         Tactical Dashboard - Tiles View - Scenarios Perspective

Tactical Dashboard 7.2                                                                                                                     PUBLIC
Introduction                                                                        © 2021 SAP SE or an SAP affiliate company. All rights reserved.   6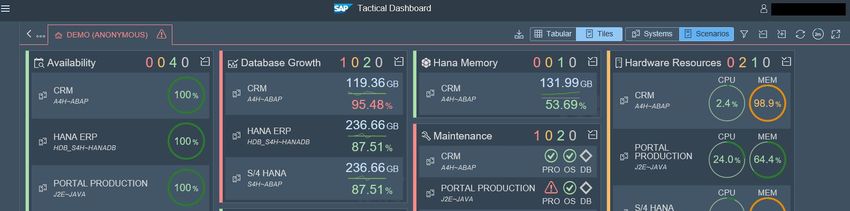
In this view, you can also filter content based on the rating (status). When you filter on status, the item in the tile which have
the color-coded status will disappear and the others will be remain.
Note that not all the tile will be hidden just the entries within with the unselected status, if all the entries have the same status
which is the unselected one the tile will be collapsed.

                                            Tactical Dashboard- Filtering status option

Tactical Dashboard 7.2                                                                                                                     PUBLIC
Introduction                                                                        © 2021 SAP SE or an SAP affiliate company. All rights reserved.   7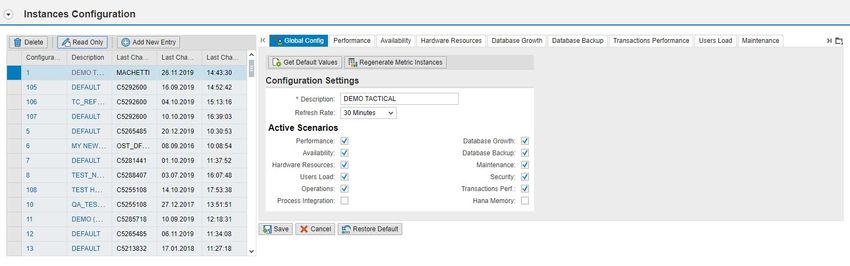
2                Configurations

Like always, before the dashboard can be used, one need to configure the dashboard instance. To access the configuration
application, use one of the follow ways:
 •      Direct link:
        [protocol]://[domain:port]/sap/bc/webdynpro/stdf/tac_webdynpro
 •      FI Launchpad:

                                                    FI Launchpad First View

                                                  FI Launchpad Tactical View

Tactical Dashboard 7.2                                                                                                                PUBLIC
Configurations                                                                 © 2021 SAP SE or an SAP affiliate company. All rights reserved.   8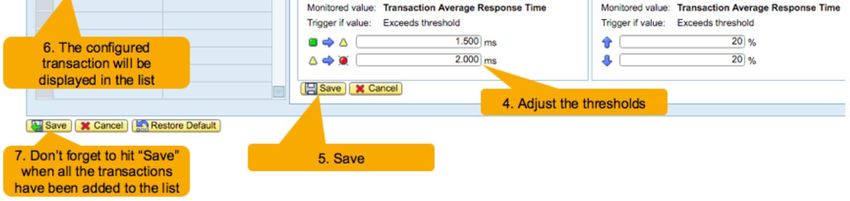
You can configure different instance of the dashboard model to fit your views of monitoring. Each instance is composed of
systems. Each system can have different scenarios selected for monitoring.
We will cover on configuration of instance, and system in the next sections.

2.1              Instance Configuration

One of the features of the dashboard is the possibility to configure multiple “instances”, each of which is characterized by a
configuration ID.
A configuration ID represents a set of systems with specific configurations and thresholds. Different systems with different
configurations and active scenarios can be assigned to a Configuration ID. This allows multiple applications of the dashboard
that can be geared towards different users, managers or business areas.

                                         Tactical Dashboard Configuration - Instances Configuration

2.1.1 Add an Instance

In the Instances Configuration panel, do as follow:
 •      Select the                button to add new temporary instance and enter edit mode.

                                           Tactical Dashboard Configuration - Add Instance Button

 •      This will take a while as the metric instances are initiated. On the right-hand side:

Tactical Dashboard 7.2                                                                                                                       PUBLIC
Configurations                                                                        © 2021 SAP SE or an SAP affiliate company. All rights reserved.   9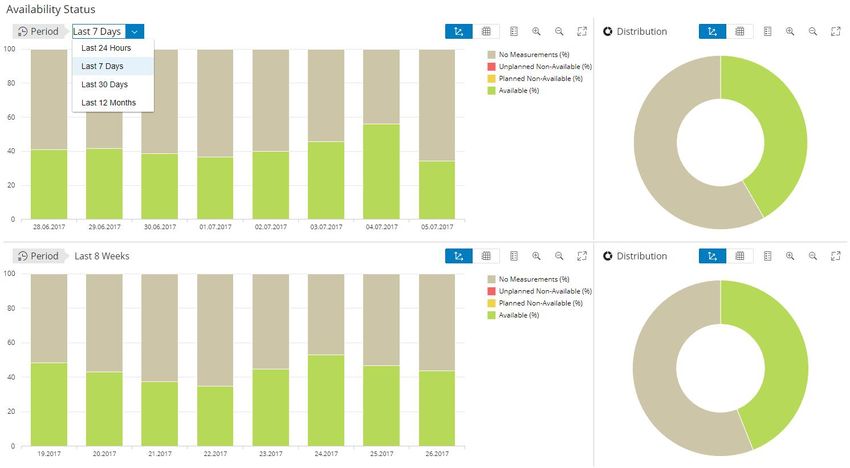
Tactical Dashboard Configuration - Add/Edit Instance

       o Enter a description.
       o Choose different refresh rate, if needed.
       o Choose scenarios which shall be used in this instance. What we choose here will affect System Configuration as the
         System Configuration will by default inherit from Instance Configuration.
 •      Now you can either:
       o Effectively add new instance by select the             button.
       o Change your mind, and don't want this instance anymore, select the                        button.
Clicking on the Dashboard title will open the instance of the dashboard in your default browser.
Scenarios configuration will be shown in upcoming sections.

2.1.2 Edit an Instance

In the Instances Configuration panel, do as follow:
 •      Select an instance in the table.
 •      Select the        button to enter edit mode.
 •      You can change what you want in the right-hand side tabs:

Tactical Dashboard 7.2                                                                                                                      PUBLIC
Configurations                                                                       © 2021 SAP SE or an SAP affiliate company. All rights reserved.   10
Tactical Dashboard Configuration - Add/Edit Instance
• If you want to reset the setting values of the instance to the application default, use the button.
• If you want to reset the setting values of the currently selected tab to application default, use the
button.
• Sometime when a note for application released with a change of metric instances, and the dashboard doesn't show
expected results, you can select the button to correct the metric instances.
• Now you can either:
o Effectively save you changes by select the button.
o Change your mind, and don't want these changes anymore, select the button.
2.1.3 Delete an Instance
In the Instances Configuration panel, do as follow:
• Select an instance in the table.
• Select the button to delete the instance.
• A popup will show to let you confirm your deletion of instance.
Tactical Dashboard Configuration - Instance Deletion Confirmation
Tactical Dashboard 7.2 PUBLIC
Configurations © 2021 SAP SE or an SAP affiliate company. All rights reserved. 112.2 System Configuration
When an instance is ready, you can proceed to add systems to the instance for monitoring. Before doing anything in the next
section, make sure you select the desired instance.
Tactical Dashboard Configuration - Systems Configuration
2.2.1 Add a System
In the Systems Configuration panel, do as follow:
• Select the button to add new temporary system, and enter edit mode.
Tactical Dashboard Configuration - Add System Button
• On the right-hand side:
Tactical Dashboard Configuration - Add/Edit System
o Choose the system type: HANA, ABAP, JAVA, WEB DISPATCHER
o Search for the system.
Tactical Dashboard 7.2 PUBLIC
Configurations © 2021 SAP SE or an SAP affiliate company. All rights reserved. 12o Enter a description.
o Choose scenarios which shall be used in this system.
o If in the instance configuration, the scenario is unchecked, the scenario is not available to select here.
o JAVA system will not have Transactions Performance scenario.
o WEB DISPATCHER systems will have only HARDWARE RESOURCES and AVAILABILITY scenarios working.
• Now you can either:
o Effectively add new system by select the button.
o Change your mind, and don't want this system anymore, select the button.
Scenarios configuration will be shown in upcoming sections.
2.2.2 Edit a System
In the Systems Configuration panel, do as follow:
• Select a system in the table.
• Select the button to enter edit mode.
• You can change what you want in the right-hand side tabs:
Tactical Dashboard Configuration - Add/Edit System
• If you want to reset the setting values of the instance to the instance configuration values, use the button.
• If you want to reset the setting values of the currently selected tab to instance configuration values, use the
button.
• Now you can either:
o Effectively save you changes by select the button.
o Change your mind, and don't want these changes anymore, select the button.
2.2.3 Delete a System
In the Systems Configuration panel, do as follow:
• Select a system in the table.
Tactical Dashboard 7.2 PUBLIC
Configurations © 2021 SAP SE or an SAP affiliate company. All rights reserved. 13• Select the button to delete the system.
• A popup will show to let you confirm your deletion of system.
Tactical Dashboard Configuration - System Deletion Confirmation
Tactical Dashboard 7.2 PUBLIC
Configurations © 2021 SAP SE or an SAP affiliate company. All rights reserved. 143 Scenarios
The current version of the Tactical Dashboard supports 11 Scenarios:
• Availability
• Performance
• Hardware Resources
• Database Growth
• Database Backup
• Users Load
• Transactions Performance
• Maintenance
• Security
• Operations
• Process Integration
• Hana Memory
Each scenario is rated (green, red or yellow) based on the thresholds and options selected in the configuration. The rating of
each scenario (or system) is then propagated, using a worst-case rule, to the overall status of the Tile. If one scenario (or
system) is red, the whole tile will be rated as red.
Configure a threshold
Same principle is valid for the “Category” Tile, if one of the entries is red, the whole category will be rated as red.
The Dashboard is refreshed automatically every 10 minutes (default value) but the frequency can be changed from 5 up to 30
minutes. The default refresh period can be configured for each instance.
What follows is a detailed description of each scenario including the specific configurations settings needed to adapt the
Tactical Dashboard to each customer’s need.
3.1 Performance
This Scenario can be used to report values and trends for “Average Response time per Dialog Step” (ABAP) or
“WebDynpro/Servlet Response Time” (Java) to make it easier to assess performance degradations in Technical Systems.
Tactical Dashboard 7.2 PUBLIC
Scenarios © 2021 SAP SE or an SAP affiliate company. All rights reserved. 153.1.1 Tile and Main View
Two different information are shown in the main Tile view, one related to the performances (in milliseconds) and one related to
a trend.
Performance Tile and Main View
The trend compares yesterday’s average response time with “Last week” response time.
The orientation of the arrow follows these rules:
The Response time, calculated on today, yesterday’s or last hour data according to the configuration, is based on different KPI’s
depending on the type of technical system, ABAP or Java.
For ABAP systems, the Average Response Time is calculated simply dividing the Total Response time by the Total Number of
Steps as it is done in transaction ST03N. Different InfoProviders can be used to calculate the Response Time per Dialog Step.
For Java systems, the overall Performance is calculated using a combination of two KPIs, WebDynpro and Servlet Response
Time.
3.1.2 Detail view
In the detail view, two different trends are displayed, one from the “Last 30 days” with daily granularity and one for the “Last 8
weeks” with weekly granularity.
Current Thresholds are visualized clicking on the “Show Thresholds” checkbox for both Java and ABAP Performance Detail.
Tactical Dashboard 7.2 PUBLIC
Scenarios © 2021 SAP SE or an SAP affiliate company. All rights reserved. 16Performance Detail View
3.1.3 Configuration
The configuration allows the selection of 3 different time periods for the calculation of the average in the main tile: Today,
Yesterday (default), and Last Hour. The setup for performance includes two thresholds.
Performance Scenario Configuration
Note
For JAVA system, there is no selection for source, data period, and data filters. These options are only available on
ABAP system. The data period for JAVA system will be yesterday.
For ABAP system, if the Source is Statistical Records, you can put filter on task types and applications to refine the data.
Tactical Dashboard 7.2 PUBLIC
Scenarios © 2021 SAP SE or an SAP affiliate company. All rights reserved. 173.2 Hardware Resources
This scenario shows the status of some OS level KPI’s, CPU and Memory Utilizations.
All the metrics refer to the Virtual Hosts of the SAP System as described in the LMDB.
Note
In the LMDB “Virtual Hosts “can be either “Physical Hosts” (i.e. bare metal) or Virtual Servers (i.e. VMware, LPARs,
WPARs, and so on)
3.2.1 Tile and Main View
Hardware Resources: Tile and Main View
The Main Tile shows the average CPU and Memory utilization of all the Physical Hosts used by the Database and the different
application servers on which the Technical System (ABAP or Java) is installed.
The rating rule of the main tile works as follows:
• If CPU = RED or Memory = RED à HW Resources = Red
• CPU/Memory
o Green to Yellow Threshold < max(current week) or avg (current week) < Yellow to Red Threshold
à Yellow
o Green to Yellow Threshold < max(last 8 weeks) or avg (last 8 weeks) < Yellow to Red Threshold
à Yellow
o max(current week) or avg (current week) > Yellow to Red Threshold
à Red
o max(last 8 weeks) or avg (last 8 weeks) > Yellow to Red Threshold
à Red
3.2.2 Detail view
The detail view shows two different sets of information, one related to the CPU and one associated with the Memory.
In both KPI’s, maximum and average values are shown for each Physical Host in the “Current Week” view. The Last 8 Weeks
section shows the data aggregated for all the application servers.
Tactical Dashboard 7.2 PUBLIC
Scenarios © 2021 SAP SE or an SAP affiliate company. All rights reserved. 18Hardware Resources: Detail view
3.2.3 Configuration
In the configuration application, it is possible to configure two sets of Green to Yellow to Red thresholds, one for the CPU and
one for the Memory. Different data period (Last 1 Hour, Today, Yesterday, Last 7 Days and Current Week) can also be selected
for the calculation of the average in the main tile.
You can also include Database Hosts in the calculation by check the Include Database Hosts check box.
Hardware Resources Configuration
Tactical Dashboard 7.2 PUBLIC
Scenarios © 2021 SAP SE or an SAP affiliate company. All rights reserved. 193.3 Availability
This Scenario shows the status of the System Availability; it can be used to evaluate the historical trends in the detailed
application.
3.3.1 Tile and Main View
The availability is expressed in percentage and calculated on “Last hour, “Today” and “Yesterday” periods. If the value in the
main tile is lower than 100%, the system can be either unavailable or no measurements are collected for this metric (e.g. the
agent is offline).
Availability: Tile and Main View
Like any other scenario, availability can be individually configured for several systems.
3.3.2 Detail View
The detail view shows several historical trends with the aggregated distribution on the system availability for selected period:
Availability Detail View
Tactical Dashboard 7.2 PUBLIC
Scenarios © 2021 SAP SE or an SAP affiliate company. All rights reserved. 20• Last 24 hours with hour granularity.
• Last 7 days with daily granularity.
• Last 30 days with daily granularity.
• Last 12 months with monthly granularity.
• Last 8 weeks with weekly granularity.
There are four statuses for a system: Available, Planned Non-available (for example for a planned downtime), Unplanned Non-
Available (unexpected downtime), and No Measurements (if the Agent is not reporting any data).
To be able to discriminate between planned and unplanned non-availability, you need to schedule the related work modes in
the Technical Administration Work Center (Work Mode Management).
3.3.3 Configuration
The configuration of this scenario allows specifying two thresholds, Green to Yellow and Yellow to Red:
Availability Configuration
In the example above the rating will be green if the availability (Today or Last 1 Hour according to the Data Period selected) will
be higher than 80%, yellow if the availability is between 20% and 80% and red if lower than 20%.
In the system configuration, the user can choose to:
1- Consider “No measurement” as available by checking the checkbox mentioned in the below screenshot:
2- Consider “Planned Non-Availability” as available by checking the checkbox.
As mentioned in the below screenshot:
Tactical Dashboard 7.2 PUBLIC
Scenarios © 2021 SAP SE or an SAP affiliate company. All rights reserved. 21In that case, the value displayed in the overview is the sum of the availability and the no measurements or/and planned non-
availability.
3.4 Database backup
This scenario reports the status of the Database Backup for each system. A custom table is also provided to allow additional
reporting capabilities.
3.4.1 Tile and Main View
This scenario reports the status of the Database Backup for each system. A custom table is also provided to allow additional
reporting capabilities.
Database Backup: Tile and Main View
3.4.2 Detail View
When enabled in the configuration (see the next section), the detail view displays only the content of the table
/STDF/TAC_BAKLOG. The table can be filled periodically with a strategy of your choice.
These are the Fields displayed in the Dashboard:
Tactical Dashboard 7.2 PUBLIC
Scenarios © 2021 SAP SE or an SAP affiliate company. All rights reserved. 22Database Backup - Log Table
3.4.3 Configuration
There is only one threshold for the DB Backup scenario.
Database backup Configuration
The threshold is of type Green to Red so, when the number of days since last successful backup exceeds the configured integer,
the scenario will be rated red.
It is possible to activate a flag to enable the detail view. In this case the content of the table /STDF/TAC_BAKLOG is displayed
filtering the specific system.
Database Backup - Detail View
How and when to fill the table is customer’s responsibility. A possible approach is to execute a periodic job that parses the
content of a log file produced by the Backup tool and then writes the new entries in the table.
The Dashboard will always display the records related to that specific SID.
Tactical Dashboard 7.2 PUBLIC
Scenarios © 2021 SAP SE or an SAP affiliate company. All rights reserved. 233.5 Database Growth
The DB Growth Scenario allows monitoring several KPIs related to the growth of the Database over an extended period of time
(up to one year). It provides information about the current size of the DB and alerts the user whenever the fill level is close to
100% or if there is an anomaly in the growth of the Database.
The following Databases are supported:
• DB2
• Oracle
• MaxDB
• HANA DB
3.5.1 Tile and Main View
Database Growth - Tile and Main View
Three information are displayed in the main Tile: DB Size, DB Fill level and DB Growth trend. The first two are based on
yesterday’s values while the trend depends on the configuration (8 weeks or 12 Months).
• DB Size refers to the size of the Database in the file system (i.e. the sum of the size of all data files or Occupied plus Free
Memory in the Database).
• The DB Fill level describes the percentage of space which is consumed within the DB (Occupied Memory / (Occupied +
Free Memory) ).
• The trend shows the DB Growth in the last week or month (depending on the configuration).
The rating of the Scenario is based on two thresholds defined on the DB Fill level (DBFL) and on the DB Growth comparison
(DBGC). If one of the two is red, then the DB Growth Scenario is rated as red.
Note
The 2 images below are for example only. They do not reflect the current style of the tile. However, the organization
of the content is still correct.
The DB Fill Level has a conventional “green to yellow to red” threshold.
Tactical Dashboard 7.2 PUBLIC
Scenarios © 2021 SAP SE or an SAP affiliate company. All rights reserved. 24The color of the trend chart in the System Tile is based on the evaluation of a threshold defined for the comparison of the DB
Growth (DBG) between Last Week (or Last Month) and Last 8 Weeks (or Last 12 Months).
If, for example, the DB Growth Trend Y2R Threshold is set to 50%, then the chart will be red if last week growth is 50% higher
than the average in the past 8 weeks.
3.5.2 Detail View
The detail view provides two charts, DB Growth and DB Size. The Database size shows the amount of Occupied and Free
memory.
Database Growth is the difference for “Occupied memory” between two different time periods. E.g. if this month the occupied
memory in the Database is 300G and last month was 200G, then the Database Growth is 100G.
Database Growth: Detail View
Tactical Dashboard 7.2 PUBLIC
Scenarios © 2021 SAP SE or an SAP affiliate company. All rights reserved. 253.5.3 Configuration
As explained before, two thresholds are configurable to assign a rating to the Scenario, one on the DB Fill level and one on the
growth comparison.
Database Growth Configuration
The first threshold is used to rate the DB Fill Level percentage in the main tile.
The second one is used to evaluate the color of the DB Growth Trend in the main Tile.
3.6 Users Load
This scenario can be used to evaluate, in every ABAP system, if the average number of connected users per hour is increasing
over time or if there are peaks that need to be evaluated.
For Java systems, http sessions are used to display similar information.
3.6.1 Tile and Main View
The main tile shows two information: a number representing the average number of connected users per hour (today,
yesterday or last 7 days depending on the configuration) and a trend. The trend compares last week (or last month depending
on the configuration) with the last 8 weeks.
Users Load: Tile and Main View
3.6.2 Detail View
In the detail application two different areas are displayed.
Tactical Dashboard 7.2 PUBLIC
Scenarios © 2021 SAP SE or an SAP affiliate company. All rights reserved. 26Users load: Detail view The trend on top shows the average (and maximum) number of connected users in different timeframes: last 24 hours with hourly granularity, last 30 days with daily granularity, and Last 12 month, or "this year" with monthly granularity. The lower graph shows the distribution of the hourly-connected users during the 24 hours or the days of the week. The distribution is calculated considering the last 2 months. This allows to answer questions like “What is the hour of the day in which more users are connected?” Which day of the week has been busier in the last two months? Additionally, another trend is showed in the same graph, the Response Time per dialog Step (for ABAP) or the Servlet/WebDynpro Response time (for Java). This allows correlating the number of connected users (or HTTP sessions) to possible performance issue. 3.6.3 Configuration In the Users Load configuration, it is possible to define a threshold on the Maximum number of connected users. This is useful to be alerted, for example, if the maximum number of connected users reaches the limit imposed by the license. Data from today (default), yesterday or last 7 days can be considered for this threshold. When the threshold is exceeded, the number in the main tile becomes red. The Trend thresholds (in %) can be used to modify the buffer used to control the sensibility of the trend arrow. In the example below, if the average last week is 20 more than the average in the last two months, the orientation of the arrow is up. Tactical Dashboard 7.2 PUBLIC Scenarios © 2021 SAP SE or an SAP affiliate company. All rights reserved. 27
Users Load: Configuration

There's cases where you want to see the maximum number of users log on to system, instead of just average, for example, the
data period last 1 hour. You can select the check-box Use Max Operation for this purpose.

3.7             Maintenance

The maintenance scenario can be used to keep under control the status of the systems from the Software Level point of view.
For each technical system, it shows the current software/patch level of the installed Product, Software Components, Kernel,
Operating System and Database as well as the latest available version, age or end of maintenance. The status of the Main Tile
can be used to, for example, to evaluate if the End of Maintenance for the Product is too close.
The main data source for this scenario is the Early Watch. It follows that the configured system must be included in a Solution
and that the latest Early Watch alert session has been calculated correctly.

3.7.1 Tile and Main View

The main Tile shows the status of the Product, OS (Patch level and Kernel) and Database. If one of the thresholds configured for
the different areas is exceeded, the status is propagated to the Main Tile.

                                                 Maintenance: Tile and Main View

3.7.2 Detail View

The detailed application offers an overview of all the relevant areas: Product, Software Components, Database, OS and Kernel.

Tactical Dashboard 7.2                                                                                                                  PUBLIC
Scenarios                                                                        © 2021 SAP SE or an SAP affiliate company. All rights reserved.   28
Maintenance: Detail View The “Components” area shows the current SP level for each software component installed on the system and the latest available SP level in the products catalog. A specific threshold can be setup for the main software component of the relevant Stack (sap_basis for abap and J2EE for Java) to calculate the rating based on the difference between the latest available and the current SP. 3.7.3 Configuration The following interface is used to configure the maintenance scenario: Tactical Dashboard 7.2 PUBLIC Scenarios © 2021 SAP SE or an SAP affiliate company. All rights reserved. 29
It is possible to define several thresholds for limiting the product remaining maintenance days, component’s version gap or OS
remaining support days.

The user can ignore checking if the data base’s end of maintenance date has been exceeded or not. In this case, he should in
the reference box enter a reference explaining the reason.

3.8             Security

For Security Scenario and related troubleshooting refer to the document “Security Scenario CV Configuration for Tactical
Dashboard ST-OST.pdf” in the following wiki page:
https://wiki.scn.sap.com/wiki/display/SM/Security+scenario%3A+Security+Notes+Validation

3.9             Transactions Performance

Response time per dialog step and total number of steps are the key indicator for transactions performance evaluation in ABAP
Systems. Users want to verify for each system if a selected subset of Transactions are performing under the expected SLAs or if
their trend is worsening.
The Transaction Performance scenario can be used to report the status of critical transactions for every ABAP System
configured in the Tactical Dashboard.

3.9.1 Tile and Main View

                                           Transactions Performance - Tile and Main View

The main tile displays the number of transactions exceeding the performance threshold (based on Average Response time per
dialog step).
Users can configure a different threshold for each transaction. Thus, each transaction will be rated and placed in a Green,
Yellow or Red area set. The rating is performed using Last Hour, Yesterday or Last 7 Days data.
The blue arrow shows the trend of the worst transaction among the ones configured for the system.
A trend is calculated for each transaction comparing the performances of yesterday (last hour or last 7 days depending on the
configuration) with the last 8 weeks (or 12 months according to the configuration).
If the difference between yesterday (last hour or last 7 days) and last 8 weeks (12 months) exceeds a specific, configurable
threshold (in %) then the orientation of the arrow will change accordingly.

Tactical Dashboard 7.2                                                                                                                  PUBLIC
Scenarios                                                                        © 2021 SAP SE or an SAP affiliate company. All rights reserved.   30
3.9.2 Detail View
The detail view will provide additional information for each transaction:
• Last 24h/Last 7 days/Last 30 Days/Last 12 Months Trend Graph for each transaction
• Pie chart representing within each sector different transactions steps compared with the all the other transactions in the
system
• List of Transactions out of SLAs (Green/ Yellow/ Red/ No Data)
• List of all the transactions Trends and specific SLAs (Maximum and Average response time plus trend)
Tactical Dashboard 7.2 PUBLIC
Scenarios © 2021 SAP SE or an SAP affiliate company. All rights reserved. 31Transactions Performance: Detail View The data in the Pie Chart, SLA Summary and Transaction Trends is calculated based on the selected period in the trend graph. The analysis can be focused on a specific transaction by clicking on the name in the Trend Graph legend like in image below. Click the legend again to go back to full view. Tactical Dashboard 7.2 PUBLIC Scenarios © 2021 SAP SE or an SAP affiliate company. All rights reserved. 32
Transactions Performance: Detail View - By Trend

3.9.3 Configuration

The configuration of the transactions performance scenario is quite simple. It is sufficient to select the proper scenario and
system in edit mode.
And then add the necessary transaction following the procedure described below.

                                              Transactions Performance - Configuration

Tactical Dashboard 7.2                                                                                                                   PUBLIC
Scenarios                                                                         © 2021 SAP SE or an SAP affiliate company. All rights reserved.   33
3.10 PI Monitoring
The PI Scenario in the Tactical Dashboard allows the monitoring of PI messages (errors, scheduled and successful) on a PI
domain.
• The Error Status groups messages of a particular PI domain which are in any error status
• The Scheduled Status consider messages of a particular PI domain in any non-final status, including currently scheduled,
waiting, pending, or currently processed
o e.g. if the adapter engine is consuming all the threads, the messages are hanging causing a backlog situation
3.10.1 Tile and Main View
The main tile shows the successful messages in green and the number of scheduled and error messages in yellow and red. The
trend compares the number of errors between yesterday and the average in the past 7 days.
PI Monitoring: Tile and Main View
3.10.2 Detail View
Like any other scenario in the Tactical Dashboard, the user can access a more detailed view by clicking on the system entry in
the Main Tile.
The detailed view will provide additional information:
• Last 24h*/Last 7 days Trend Graph for messages in error, in status scheduled, and total number of successful messages.
• Trend summary for the different categories of message.
• Pie chart showing the share of message in error and scheduled.
Tactical Dashboard 7.2 PUBLIC
Scenarios © 2021 SAP SE or an SAP affiliate company. All rights reserved. 34PI Monitoring: Detail View 3.10.3 Configuration The configuration of the PI Monitor scenario relies on the setup of the standard Solution Manager PI Monitoring application in the “Integration Monitoring” area of Technical Monitoring (for the details on the configuration activities refer to the official TechMon Wiki, for Solution Manager 7.1 https://wiki.scn.sap.com/wiki/display/TechOps/Central+PI+Monitoring+with+SAP+Solution+Manager+7.1, and for Solution Manager 7.2 https://wiki.scn.sap.com/wiki/display/TechOps/Process+Integration+Monitoring). 3.11 Hana Memory The Hana Memory allows monitoring several KPIs related to the Memory of Hana Database. It provides information about the used, the resident and the available physical memory of the database Hana. Tactical Dashboard 7.2 PUBLIC Scenarios © 2021 SAP SE or an SAP affiliate company. All rights reserved. 35
3.11.1                   Tile and Main View

                                       Hana Memory: Tile and Main view

Three information are displayed in the main Tile: Used memory, Available physical memory and Resident memory trend. The
first two are based on yesterday’s values while the trend is based on the las 8 weeks values.

 •      Used Memory is the total amount of memory currently in use by SAP HANA.
 •      Available physical memory is the DRAM memory installed on the host.
 •      The Resident memory is the physical memory in operational use by a process.

The rating of the Scenario is based on two thresholds defined on the percentage of the %(used/Available physical memory) and
on the resident memory comparison. If one of the two is red, then the Hana Memory Scenario is rated as red.

The %(Used/ Available physical memory) has a conventional “green to yellow to red” threshold.

The color of the trend chart in the System Tile is based on the evaluation of a threshold defined for the comparison of the
Resident memory between Last Week and Last 8 Weeks.

3.11.2                   Detail View

The detail view provides one chart, DB Memory. The Database Memory shows the Available physical memory, the Resident
memory and the Used memory for the selected periods:
 •      Today with hour granularity.
 •      Yesterday with hour granularity.
 •      Last week with daily granularity
 •      This week with daily granularity.
 •      Last month with daily granularity.
 •      This month with daily granularity.
 •      Last 3 months with daily granularity.
 •      Last 12 months with monthly granularity.

Tactical Dashboard 7.2                                                                                                                PUBLIC
Scenarios                                                                      © 2021 SAP SE or an SAP affiliate company. All rights reserved.   36
Hana Memory: Detail View
3.11.3 Configuration
As explained before, two thresholds are configurable to assign a rating to the Scenario, one on the Used memory and one on
the Resident memory comparison.
Hana Memory Configuration
The first threshold is used to rate the Used memory percentage in the main tile.
The second one is used to evaluate the color of the Resident memory Trend in the main tile.
Tactical Dashboard 7.2 PUBLIC
Scenarios © 2021 SAP SE or an SAP affiliate company. All rights reserved. 374 Dashboard
Once the configuration has been done, you can access the dashboard to see what you have configured. To access the
dashboard based on the view, please follow section 4.1.
4.1 Access Dashboard
You can access it by using Focused Insights Launchpad as follow:
• Select Tactical tile.
Select Tactical Tile
• Select the instance you want to go to and select “Go to Dashboard” button.
Select Tactical Instances to Jump to
Tactical Dashboard 7.2 PUBLIC
Dashboard © 2021 SAP SE or an SAP affiliate company. All rights reserved. 38Once inside the dashboard with selected instances, you will see as below:
Tactical Dashboard - Instances View
You can switch between selected instances by clicking the title of the instance. The default view when you access the
dashboard will be Tiles view, with Scenarios perspective. The number of scenarios showing up will be based on the
configuration of the instance as shown previously.
4.2 Dashboard Layout
When you enter the application, the default view will be based on tiles view and scenarios perspective as shown in the below
screenshot.
Tactical Dashboard
Tactical Dashboard 7.2 PUBLIC
Dashboard © 2021 SAP SE or an SAP affiliate company. All rights reserved. 394.2.1 Header
Dashboard Header (2 instances are displayed)
The header is composed of (from left to right):
• Side pane toggle button.
• SAP Logo.
• Dashboard Model Name: Tactical Dashboard.
• Instances' timer settings (in case multiple instance is used), which manipulates all instances' timer.
• User Settings button with user name as label. When chosen, it pops up a menu:
User's Menu
o Choose Information to open Basic Information Dialog.
Tactical Dashboard 7.2 PUBLIC
Dashboard © 2021 SAP SE or an SAP affiliate company. All rights reserved. 40Basic Information Dialog
o Choose Personalization to open the Personalization pane, in this pane figure the Global Settings section:
Personalization Pane - Global Settings
In this dialog the user can select these options:
§ Color schema theme "Light or Dark"
Below a screenshot of the dashboard with the dark mode.
Tactical Dashboard 7.2 PUBLIC
Dashboard © 2021 SAP SE or an SAP affiliate company. All rights reserved. 41Tactical Dashboard - Dark Theme
§ The maximum number of messages to store in the message dialog.
§ The Auto Switching of Instances:
- Set the inactive time for the dashboard to determine user is idle to activate the function.
- Set waiting time between switch of instances
Note
Here is the parameters list that can be added to the application URL to perform the activities described below:
• ColorScheme=Dark to select dark mode (ColorScheme=Light is the default mode)
• fullScreen=X to display dashboard in fullscreen
• refreshTimer=X where X is the refresh time to set in minutes (By default, the refresh time is the selected one in the
configuration application)
• autoSwitchOnIdle=true/X working with carousel feature, it enables the auto-switching between the displayed instances
(autoSwitchOnIdle=false by default)
• statuses=green,red,grey,yellow to filter on the item status. If statuses=red,green the items with red and green ratings
will remain, the others will disappear
• view=Tabular or Tiles to use tabular or tiles
• perspective=Systems or Scenarios to show systems or scenarios perspective
Tactical Dashboard 7.2 PUBLIC
Dashboard © 2021 SAP SE or an SAP affiliate company. All rights reserved. 424.2.2 Instances Selection Header
This header allows you to switch between instances manually.
Instance Selection Header
Each instance will have its own refresh timer which is a circle icon containing the time set in minutes.
You can click on the refresh icon to manually manage the timer refresh instance.
Instance refresh timer
4.2.3 The Content Area
The content area is in the middle-center of the dashboard. This is where you see the content of the selected instance.
Content Area
Tactical Dashboard 7.2 PUBLIC
Dashboard © 2021 SAP SE or an SAP affiliate company. All rights reserved. 43This area is covered by the navigator which contains:
• Navigating items: which show where you are, and where you are from
• Message inbox button
• Full screen button which allows you to show only the content area
• The type of displayed view button Tabular or Tiles
• The perspective button Systems or scenarios
• The statuses filters button
• Refresh button
• Expand all tiles button
• Collapse all Tiles button
• Refresh Timer
4.3 Content Navigation
In the Tiles view, you can select on the entries of the tile to navigate to the details view of the respected system, and scenario.
Tile View - Click Entry to Navigate
In the Tabular view, you can select the cell to navigate to the details view of the respected system, and scenario.
Tabular View - Click Cell Item to Navigate
While navigating down, the navigator will keep track of where you are, and where you were by navigating items. You can go
back to the previous level by select the left arrow button. You can also click to any navigating item to go back to that level.
Tactical Dashboard 7.2 PUBLIC
Dashboard © 2021 SAP SE or an SAP affiliate company. All rights reserved. 44Navigator - Navigating Items Tactical Dashboard 7.2 PUBLIC Dashboard © 2021 SAP SE or an SAP affiliate company. All rights reserved. 45
www.sap.com/contactsap

© 2021 SAP SE or an SAP affiliate company. All rights reserved.
No part of this publication may be reproduced or transmitted in any form or
for any purpose without the express permission of SAP SE or an SAP affiliate
company.
SAP and other SAP products and services mentioned herein as well as their
respective logos are trademarks or registered trademarks of SAP SE (or an
SAP affiliate company) in Germany and other countries. All other product
and service names mentioned are the trademarks of their respective
companies. Please see http://www. sap.com/corporate-
en/legal/copyright/index.epx#trademark for additional trademark
information and notices.

                           Click here to enter text.
You can also read