J.P. Morgan Aviation, Transportation and Industrials Conference March 3, 2015 - WestJet

Page created by Michelle Mason
 
CONTINUE READING
J.P. Morgan Aviation, Transportation and Industrials Conference March 3, 2015 - WestJet
J.P. Morgan
Aviation, Transportation and Industrials Conference
                  March 3, 2015
J.P. Morgan Aviation, Transportation and Industrials Conference March 3, 2015 - WestJet
Caution regarding forward-looking information

    Certain statements set forth in this presentation and statements made during this presentation, including, without
    limitation, information respecting WestJet’s ROIC goal of a sustainable 12%; the anticipated timing of the 737 MAX
    deliveries and the associated benefits of this type of aircraft and the LEAP-1B engine; our 737 and Q400 fleet
    commitments and future delivery dates; our expectation that upgrades to Plus seating will generate significant
    incremental revenue; our plans to introduce wide-body service with initial flights planned between Alberta and Hawaii in
    late 2015; our expectations of further expansion through WestJet Vacations, additional flights and new airline
    partnerships; the installation timing and features of our new in-flight entertainment system; WestJet Encore’s network
    growth plans; and our expectations to retain a strong cash balance are forward-looking statements within the meaning
    of applicable Canadian securities laws.

    By their nature, forward-looking statements are subject to numerous risks and uncertainties, some of which are beyond
    WestJet’s control. Readers are cautioned that undue reliance should not be placed on forward-looking statements as
    actual results may vary materially from the forward-looking statements due to a number of factors including, without
    limitation, changes in consumer demand, energy prices, aircraft deliveries, general economic conditions, competitive
    environment, regulatory developments, environment factors, ability to effectively implement and maintain critical
    systems and other factors and risks described in WestJet’s public reports and filings which are available under WestJet’s
    profile at www.sedar.com.

    Any forward-looking statements contained in this presentation and statements made during this presentation represent
    WestJet’s expectations as of the date of this presentation and are subject to change after such date. WestJet does not
    undertake to update, correct or revise any forward-looking statements as a result of any new information, future events
    or otherwise, except as may be required by law.

    March2015

2
J.P. Morgan Aviation, Transportation and Industrials Conference March 3, 2015 - WestJet
Non-GAAP measures

    This presentation contains disclosure respecting non-GAAP financial measures including, without
    limitation, return on invested capital (ROIC); CASM, excluding fuel and employee profit share;
    adjusted net earnings; adjusted diluted earnings per share; adjusted net debt to adjusted earnings
    before interest, taxes, depreciation, amortization and rent (EBITDAR); and cash to last twelve months
    revenue. These measures are included to enhance the overall understanding of WestJet’s financial
    performance and to provide an alternative method for assessing WestJet’s operating results in a
    manner that is focused on the performance of WestJet’s ongoing operations, and to provide a more
    consistent basis for comparison between reporting periods. These measures are not calculated in
    accordance with, or an alternative to, GAAP and do not have standardized meanings. Therefore, they
    may not be comparable to similar measures provided by other entities. Readers are urged to review
    the section entitled “Reconciliation of non-GAAP and additional GAAP measures” in WestJet’s
    management’s discussion and analysis of financial results for the year ended December 31, 2014,
    which is available under WestJet’s profile at www.sedar.com, for a further discussion of such non-
    GAAP measures.

3
J.P. Morgan Aviation, Transportation and Industrials Conference March 3, 2015 - WestJet
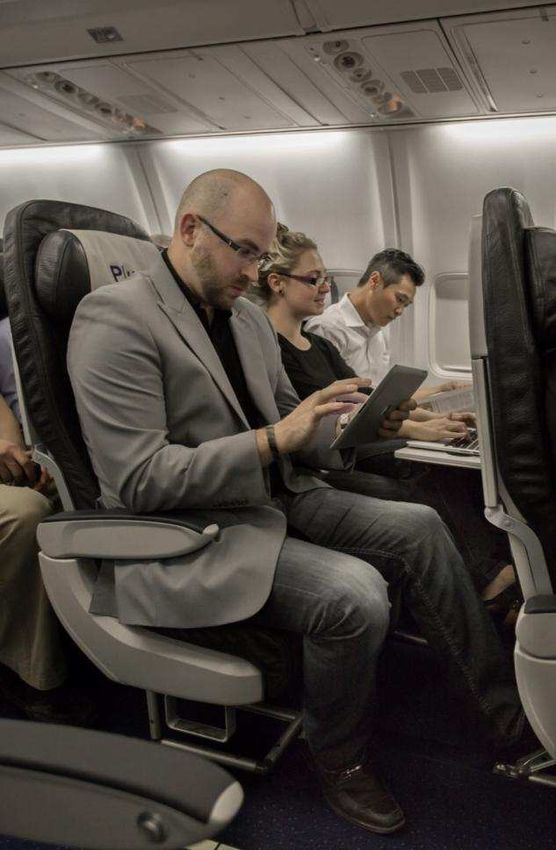
WestJet’s track record of profitability since inception

                                                                Net Earnings ($ millions)1
    350
    300
    250
    200
    150
    100
    50
      0
    -50
               1996
                        1997
                                1998
                                        1999
                                                 2000
                                                         2001
                                                                 2002
                                                                         2003
                                                                                  2004
                                                                                          2005
                                                                                                 2006
                                                                                                        2007
                                                                                                               2008
                                                                                                                      2009
                                                                                                                             2010
                                                                                                                                    2011
                                                                                                                                           2012
                                                                                                                                                  2013
                                                                                                                                                         2014
    Notes:
    (1) 2010-14 presented under IFRS; 2009 and prior presented under previous Canadian GAAP.

4
J.P. Morgan Aviation, Transportation and Industrials Conference March 3, 2015 - WestJet
WestJet’s goal to generate 12% return on invested capital

                                                               Return on Invested Capital 1
    15%
    14%
    13%
    12%                                                                                                                                 Sustainable
                                                                                                                                           goal
    11%
    10%
    9%
    8%
    7%
    6%
    5%
                2005 2006 2007 2008 2009 2010 2011 2012 2013 2014

    Notes:
    (1) 2010-14 presented under IFRS; 2009 and prior presented under previous Canadian GAAP; on a trailing 12 month basis before tax.

5
J.P. Morgan Aviation, Transportation and Industrials Conference March 3, 2015 - WestJet
The WestJetter culture

    • Our corporate culture is one of our foundational elements and we strongly believe it to be a
      tremendous capability and competitive advantage
    • We strive to maintain a culture where WestJetters act as leaders and owners and are committed
      to, and passionately pursue, our mission and vision, while living by our values

       EMPLOYEE DEVELOPMENT                                                 SAFETY PRIORITY
       WestJet’s Altitude Leadership                                        As WestJetters, our mission is to
       Development Program was                                              provide safe travel to everyone
       launched in 2007, focused on                                         in WestJet's world and safely
       developing a community of                                            deliver our guests to their final
       leaders                                                              destination
                                                    We
                                                 take care
                                                   of our
       CULTURE OF                                                           COMPENSATION
       EMPOWERMENT                                people                    PROGRAMS
       WestJetters are encouraged to                                        Profit sharing, the Employee
       find solutions and make                                              Share Purchase Plan and the
       decisions to ensure each guest                                       Owner's Performance Award
       has an outstanding experience                                        reward WestJetters for taking
       when flying with us                                                  care of our guests

6
J.P. Morgan Aviation, Transportation and Industrials Conference March 3, 2015 - WestJet
Consistently recognized by the industry and our guests

                    • Aon Hewitt Best Employers in Canada (2015)

                    • Interbrand Canada’s Best Canadian Brands, rank #20 (2014)

                    • Canada’s Most Preferred Airline (2014)

                    • Value Airline of the Year (2014)

                    • Canada’s Most Attractive Employer (2014/2013/2012)

                    • Highest equity score: airline, vacation package supplier brands
                      (2013)

                    • Gold Stevie Award Best Transportation Company (2013)

                    • Chairman’s Circle Award: WestJet Vacations (2013)

                    • WestJet RBC MasterCard ranked #1 in Canada (2014/2013)

                    • WestJet RBC MasterCard Named Canada’s Top Travel Rewards
                      Credit Card (2013)

                    • Gregg Saretsky Named Top New CEO (2013)

7
J.P. Morgan Aviation, Transportation and Industrials Conference March 3, 2015 - WestJet
8
J.P. Morgan Aviation, Transportation and Industrials Conference March 3, 2015 - WestJet
Laying the groundwork for long-term growth

    FLEXIBLE INVESTMENT IN FLEET                                       FARE BUNDLES & “PLUS” SEATING
    • Order for 65 Boeing 737 MAX aircraft with delivery dates         • Fare bundles – Econo, Flex and Plus – focus on
      of September 2017 through 2027                                     incremental revenue
    • Converting 15 Next Generation 737 deliveries to 737 MAX
                                                                       • Upgrades to Plus seating are expected to generate
      for a net increase of 50 firm commitments for
                                                                         significant incremental revenue
      737 MAX aircraft
    • Fleet plan offers significant growth potential and flexibility
      in the form of lease extension options and 10 737 MAX
      purchase options in 2020 / 2021

    INVESTMENT IN WESTJET ENCORE                                       CALCULATED INTERNATIONAL EXPANSION
    • Taken delivery of 15 Bombardier Q400 NextGen                     • In November 2013, WestJet announced Dublin, Ireland
      aircraft as of the end of 2014                                     its first transatlantic destination, followed by Glasgow, UK
                                                                         in October 2014
    • Firm commitments to purchase 15 additional aircraft
      through 2016
                                                                       • In July 2014, WestJet announced its entry into wide-body
    • Options to take on an additional 15 aircraft between               service, with initial flights planned between Alberta and
      2016 and 2018                                                      Hawaii in late 2015

                                                                       • Further expansion expected to occur through WestJet
                                                                         Vacations, additional flights and new airline partnerships

9
J.P. Morgan Aviation, Transportation and Industrials Conference March 3, 2015 - WestJet
Growth and strong financial
performance continues
Operating highlights – Q4 2014
     39th consecutive quarter of profitability and record fourth quarter earnings

                                      Q4 2014            Q4 2013           Change
     Total revenue (millions)          $994.4             $926.4             7.3%
     Net earnings (millions)            $90.7              $67.8            33.8%
     Diluted earnings per share         $0.70             $0.52             34.6%
     Operating margin                  14.0%              11.0%             3.0 pts
     RASM (revenue per available
     seat mile) (cents)
                                        15.59              15.59             0.0%
     Yield (revenue per revenue
     passenger mile) (cents)
                                        19.57              19.43             0.7%

     Load Factor                       79.7%              80.3%            (0.6 pts)
     CASM, excl. fuel and
     employee profit share (cents)
                                        9.21               9.29             (0.9%)
     Fuel costs per litre (cents)        81                 92             (12.0%)

11
Operating highlights – Full-year 2014
     10th consecutive year of profitability and record adjusted net earnings

                                                                    Full-year 2014 Full-year 2013                                                              Change
     Total revenue (millions)                                           $3,976.6       $3,662.2                                                                 8.6%
     Adjusted net earnings
     (millions)1
                                                                               $317.2                                    $268.7                                  18.0%
     Adjusted diluted earnings per
     share1
                                                                                $2.46                                     $2.03                                  21.2%
     Operating margin                                                          12.0%                                     10.9%                                   1.1 pts
     RASM (revenue per available
     seat mile) (cents)
                                                                                15.54                                     15.28                                    1.7%
     Yield (revenue per revenue
     passenger mile) (cents)
                                                                                19.09                                     18.69                                    2.1%

     Load Factor                                                               81.4%                                     81.7%                                 (0.3 pts)
     CASM, excl. fuel and
     employee profit share (cents)
                                                                                  9.15                                      9.06                                   1.0%
     Fuel costs per litre (cents)                                                   90                                        91                                 (1.1%)
     Notes:
     (1) Full-year 2014 adjusted results exclude a pre-tax non-cash loss of $45.5 million associated with the sale of 10 of WestJet’s oldest Boeing 737 aircraft. No adjustments made to full-
     year 2013
12
Costs remain under control

                 18
                 16
                                                                                                       1.70          1.67      1.86
                 14              2.20
                                                      1.70                                1.21
                                                                                 1.00
                 12                                                       1.20
 cents per ASM

                                                                                          4.32         4.50          4.34      4.26
                                 3.50                 4.70                       3.50
                 10                                                       3.20

                   8
                   6
                                 8.57                                     8.45   8.80     8.85         9.12          9.06      9.15
                   4                                  8.29

                   2
                   0
                               20071                2008                2009     2010    2011          2012          2013     2014

                                           CASM (ex fuel and profit share)              Profit Share          Fuel      Op. Margin

                 Notes:
                 (1) Excludes reservation system impairment of $31.9 million.

13
Modernizing our fleet – sale to Southwest

 • Selling 10 of our oldest Boeing 737-700s in 2014-15
 • Buying 10 new Boeing 737-800s in 2014-15
 • In Q3 2014 we recognized a pre-tax non-cash loss of $45.5 million,
   calculated using a foreign exchange rate of 1.12 associated with the
   10 aircraft
 • Transaction creates value:
     • Lowers CASM by effectively adding incremental capacity
     • Benefits associated with a younger fleet
     • Accelerates our move towards more optimal fleet mix
     • Allows new planes to be financed in a low interest rate environment
     • Assists transition to our long-term in-flight entertainment connectivity
       strategy once finalized
     • Maintains Fleet flexibility
14
737 Boeing MAX purchase agreement
     Growing our fleet and improving costs

 • WestJet announced in August 2013 an order for 65 Boeing 737
   MAX aircraft with delivery dates of Sep 2017 through 2027
 • Key benefits of this order:
     • Maintains the flexibility we have built into our fleet plan, including
       future lease renewal options
         – Boeing 737 fleet size between 120 and 164 aircraft by 2023
     • Improved operational costs: CFM International LEAP-1B engines
       expected to reduce fuel burn and CO2 emissions by 13% compared
       with today’s most efficient single-aisle airplanes
     • New Boeing Sky Interior will contribute to an enhanced guest
       experience

15
Measured growth - 737 flexible fleet plan
      including fleet modernization

 175                                                                         164
                                                               154     159
                                                        149
 150                                             143
                                          131                                 44
                                  124                           43      44
                          119                     30     36
 125             114
          107                      17      24
                   5      11
 100                                       11     23     29                   44
                                                                34      39

     75
                                                                                    120
     50   107    109      108     103      96     90     84     77      76    76
     25

     0
          2014   2015    2016    2017     2018   2019   2020   2021   2022   2023
            737 NG Committed Fleet                737 MAX Committed Fleet
            Cumulative Lease Extension Options
16
Q400 NextGen fleet plan also builds in flexibility

     50
                                                                         45
                                                            43
     40
                                              34            13           15
                                               4
     30

     20
                                              30            30           30
                                    25
     10
                       15
            8
     0
           2013       2014         2015      2016          2017          2018
            Q400 NextGen Committed Fleet   Cumulative Purchase Options

17
Building on our capabilities
Market opportunities
     Significant market opportunities exist For WestJet both domestically and abroad

                Domestic                                           Transborder   Int’l            Long-Haul
                 $7Bn                                                 $6Bn       $2Bn               $10Bn

                                                                                                Air Canada
         Air Canada
                                                            Air Canada &          AC &
          & Other                                                                 Other
                                                            Other Airlines
           Airlines                                                              Airlines

                                                                                            Other International
                                                                                                  Airlines
             WestJet
                                                                                 WestJet
                                                                    WestJet

      Source: Internal estimates using public capacity and traffic information

19
Airline partnerships: Expanding our network reach

 •   Access to destinations & demand beyond WestJet’s network
 •   Strategically selecting partners from all major world regions
 •   Creating international travel options for the business traveler
     Codeshares - 13                                   Interlines – 33
     Air France                                        Aeromexico S.A                      First Air
     American Airlines                                 Air China Limited                   Hainan Airlines Co. Limited
     British Airways                                   Air New Zealand                     Hong Kong Dragon Airlines
     Cathay Pacific Airways                            Air Pacific Limited                 Icelandair
     Delta Air Lines                                   Alaska Airlines                     Jet Airways
     China Airlines                                    Alitalia Compagnia Aerea Italiana   LATAM Airlines Group1
     China Eastern Airlines                            Asiana Airlines Inc.                Pakistan International Airlines
     China Southern Airlines                           Canadian North Inc                  Qatar Airways
     Japan Air Lines                                   Central Mountain Air                Royal Air Maroc
     KLM                                               Condor Flugdienst GmbH              SATA
     Korean Air                                        EL AL Israel Airlines               Transaero Airlines
     Philippine Airlines, Inc.                         Emirates                            US Airways
     Qantas Airways                                    Etihad Airways                      Virgin Australia
                                                       Finnair Oyj

     Notes:
     (1) LATAM Airlines Group includes seven individual partner airlines
20
Expanding our reach across segments

                Unbundled                                                                                  Bundled 

                   Low Price Segment                    Mid-Value Oriented                  High-Value Oriented
                         Econo                                 Flex                                Plus
               Low fare bundle                      Mid fare bundle                     High fare bundle
 Guest Mix
               Leisure                              Business/Leisure                    Business traveller primarily
 Price         Lowest fare plus optional services   Low fare plus optional services     Higher fare with included
                                                                                        flexibility, conveniences, comfort
 Product       Basic service from A to B, extras    More value, some extras for a fee   Fully inclusive and fully flexible
               for a fee
 Guest         Shop for the lowest price for VFR    You need some flexibility but are   You don’t want to sweat the small
 proposition   or a low-cost vacation. Pay for      still looking to save.              stuff. You need maximum
               what you need.                                                           flexibility and a bit more room to
                                                                                        get the work done.

21
WestJet market evolution

                                              Leisure                               Business/ Leisure                                      Business

                                                                                                                                 85%
     Cost/Product Relevance
        (CASM ex. Fuel)

                                                                              Through fare bundles
                                                                              WestJet can attract a
                                  Unbundling our product                      greater share of the
                                  protects our share of                       business oriented
                                  the low price segment                       segments

                                                              WestJet Today

                                                                                                     % of Flying Public
                                                    20                   40                       60                            80
                                     Low Price Segment                                     Value Oriented                                  Business Cabin
                              •   Ancillary Unbundled Product Offering         •   Increased schedule quality                          •     Traditional Business Class
                              •   Basic schedule (no partners)                 •   Airline Partnerships                                •     Mature codeshare
                              •   Product focus is low price                   •    Rewards;, bundled& a la carte value-added                 capabilities
                                                                               •                                                       •     Tiered service
                                                                                   Enhanced distribution content capabilities
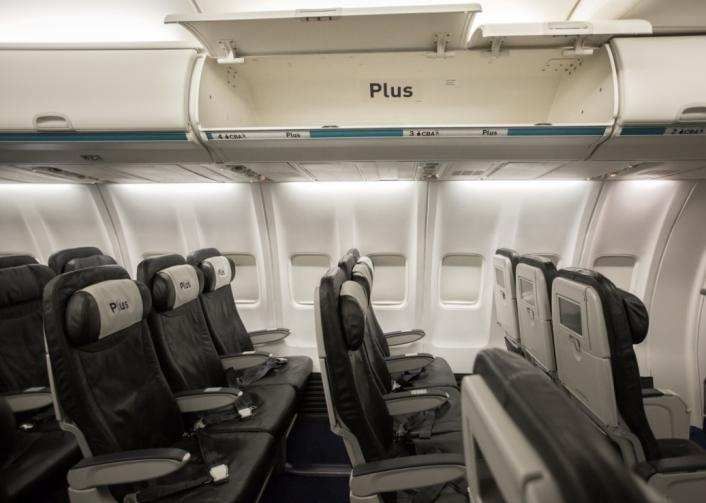
22
Plus fare product is a win-win for WestJet and its guests

23
WestJet Rewards Tiers provides greater benefits
      for our loyal guests

                                           Teal                       Silver           Gold
        12 month            Up to $1,499          $1,500 to         $4,000 to          $6,000
     qualifying spend                              $3,999            $5,999          and beyond
                                        WestJet dollar earn rates
      WestJet flights            1%                 3%                  5%              5%
     WestJet Vacation           0.5%                1%                  1%              1%
        packages
                                        WestJet dollar earn rates
     Up to 1.5% on everyday purchases and up to 2% on WestJet flight and Vacations purchases
                                with the WestJet RBC Mastercard
                          1% on car rentals and hotels booked at westjet.com
                        All tiers earn WestJet dollars on partner-marketed flights

     • Companion flights, lounge vouchers, seat selection vouchers and free
       checked bags are just some of the benefits of silver and gold tiers
24
Growing ancillary revenue per guest

$12.00
                                                             $11.05
$11.00

$10.00
                                                     $8.94
 $9.00
                      $7.74            $7.89
 $8.00

 $7.00
            $6.03
 $6.00

 $5.00

 $4.00
            2010      2011             2012          2013    2014
                       Ancillary revenue per guest
25
The evolution of inflight entertainment

 • February 2014: WestJet signed multi-year agreement with Panasonic
   for new inflight entertainment & connectivity (IFEC) system
 • New IFEC will feature wireless internet connectivity, streaming video,
   and other robust content
 • Installation has begun and expect to complete on WestJet’s fleet
   over next two years
 • Key benefits include:
     • Increased value proposition for business travellers – addition of Wi-Fi
       enables guests to make their time in the air as productive as possible
     • Increased efficiency – removing seatback monitors reduces aircraft
       weight and increases fuel efficiency
     • Guests can use their personal devices to access content, and purchase
       vacation packages or other merchandise online
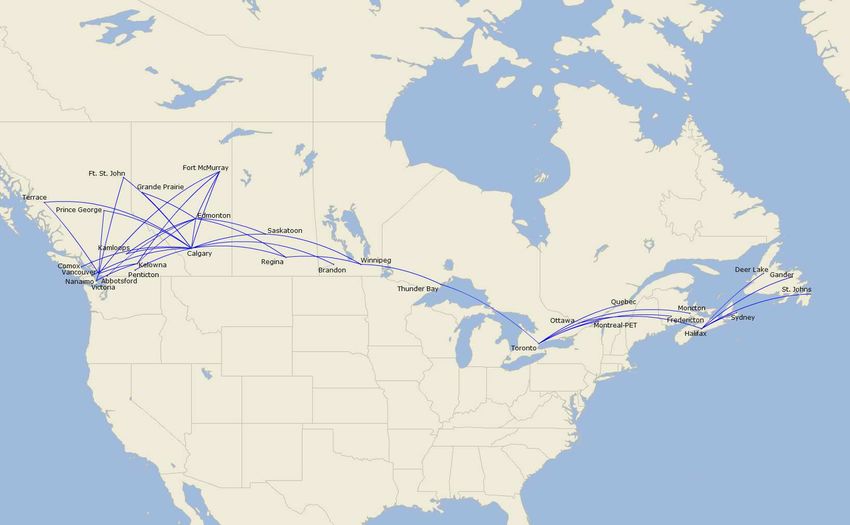
26
WestJet Encore
WestJet Encore: significant network growth

                    October 2015:
               146 departs at 31 stations
     Note: 146 departures is based on a typical Wednesday in March

28
WestJet Encore has lowered fares and stimulated
                           demand

                                       Impact of WestJet Encore on traffic volumes on new routes
                           60%                                                                                                                          20%
Change in traffic volume

                                                                                                                                                               Change in average fare
                           50%                                                                                                                          10%
                           40%                                                                                                                          0%
                                                                                                                             40-55% year-over-year
                           30%               Fares drop and demand is stimulated                                            growth in traffic volumes
                                                                                                                                                        -10%
                                           as soon as WestJet Encore begins service
                           20%                                                                                                                          -20%
                           10%                                                                                                                          -30%
                            0%                                                                      20-40% year-over-year                               -40%
                                                                                                  reduction in average fares
                           -10%                                                                                                                         -50%
                                       -12                 -9                -6       -3      Start       +3           +6            +9           +12
                                                                                              Month
                                                                             Traffic volume                      Average fare
                            Source: IATA PaxIS database, December 23, 2014

      •                     Total traffic at new Encore airports increased between 40%-55% after WestJet Encore
                            entered and lowered fares

29
WestJet Encore at maturity

 •   Organizational structure: wholly owned subsidiary
 •   Fleet size: up to 45 x 78-seat Q400 turboprop aircraft
 •   Network and schedule
      – National operation (Eastern and Western)
      – Domestic and transborder operations

Type of flying                   Description
                                 Flights to/from new destinations not currently served
 New destinations
                                 by the WestJet network
                                 Flights between existing destinations not currently
 Join the dots
                                 flown by WestJet
                                 Flights on some existing short-haul routes that benefit
                                 from increased frequency and higher load factors;
 Schedule improvements
                                 B737 flying will be redeployed to maximize the
                                 network

30
Critical success factors remain the same
     for WestJet Encore

            Guest experience and low cost

      Guest experience and culture   Low cost
      • Consistent WestJet guest     • Obtain meaningful and
        experience                     sustainable cost advantage
      • Consistent WestJet values      vs. regional competitors
      • Maintain caring culture      • Low fares to stimulate
      • Engaged workforce              demand and steal traffic
                                     • Expand low-fare high-value
                                       proposition to new markets

31
We have the financial strength
to put our strategy into action
Financial strength supports growth
     WestJet assigned an investment grade credit rating by S&P in February 2014

          Capital Structure                        Liquidity                  Capital Allocation
      • Committed to maintaining a       • Expect to retain strong cash   • Committed to our goal of a
        strong and flexible balance        balance position                 sustainable 12% ROIC target
        sheet
                                         • Strong free cash flow          • Disciplined return of capital
      • Guidelines of:                     supplements balance              to shareholders via both our
                                           sheet liquidity                  dividend and share
       •
Relative liquidity & leverage ratios – December 31, 2014

                                    50%
             Cash / LTM Revenue

                                    40%       34%
Liquidity

                                    30%
                                    20%
                                    10%
                                     0%
                                              WestJet

                                                                                                                                                           United
                                                                                                                                          JetBlue
                                                         Spirit

                                                                         Alaska

                                                                                                                          Southwest
                                                                                                          Air Canada

                                                                                                                                                                           Delta
                                                                                         American
                                        4.0
                  Adjusted Net Debt /
                  Adjusted EBITDAR1

                                        3.0
 Leverage

                                        2.0
                                                                       1.36
                                        1.0
                                        0.0
                                                                         WestJet

                                                                                                                                                           United
                                                                                                                          JetBlue
                                               Alaska

                                                         Southwest

                                                                                          Spirit

                                                                                                          Delta

                                                                                                                                                                           Air Canada
                                                                                                                                           American
            Notes:
            (1) Trailing 12 month basis; adjusted EBITDAR exclude a pre-tax non-cash loss of $45.5 million associated with the sale of 10 of WestJet’s oldest Boeing 737 aircraft.
34
Returning value to shareholders – Dividend & NCIB

                                                                                                                                                                                      $0.14
                       150

                                                                                                                                                                                              Dividend per share
                                                                                                                                                                                      $0.12
                       145                                                                                                                                                            $0.10
      # Shares (mln)

                       140                                                                                                                                                            $0.08
                       135                                                                                                                                                            $0.06
                       130                                                                                                                                                            $0.04
                       125                                                                                                                                                            $0.02
                       120                                                                                                                                                            $0.00
                             Q3/10
                                     Q4/10
                                             Q1/11
                                                     Q2/11
                                                             Q3/11
                                                                     Q4/11
                                                                             Q1/12
                                                                                      Q2/12
                                                                                              Q3/12
                                                                                                      Q4/12
                                                                                                              Q1/13
                                                                                                                      Q2/13
                                                                                                                              Q3/13
                                                                                                                                      Q4/13
                                                                                                                                              Q1/14
                                                                                                                                                      Q2/14
                                                                                                                                                              Q3/14
                                                                                                                                                                      Q4/14
                                                                                                                                                                              Q1/15
                                                                                     # Shares                     Dividend
     Initiated a $0.05 quarterly                                                                              Normal Course Issuer Bid
     dividend,                                                                                                       Completed first NCIB August 2011 for $106 million
     November 2010; increased to:                                                                                    Completed second NCIB November 2012 for $112
      $0.06 in February 2012                                                                                         million
      $0.08 in August 2012                                                                                          Third bid expired February 2014 –repurchased
      $0.10 in February 2013                                                                                         86% of the 6.6 million shares under the bid for
      $0.12 in February 2014                                                                                         $137 million
      $0.14 in February 2015                                                                                        TSX approved fourth NCIB up to 2 million shares or
                                                                                                                      1.6%, announced on May 6, 2014
35
Summary – why invest in WestJet

 •   Proven track record of profitably, low cost structure and ROIC focus
 •   Award-winning culture and highly engaged workforce
 •   Pursuing profitable growth opportunities
 •   Strong brand in the marketplace and expanding airline partnerships
 •   Investment grade credit rating, strong balance sheet and liquidity
 •   Committed to generating and returning value to shareholders

36
You can also read