INVESTOR PRESENTATION - Full Year 2016 Results - Essentra plc
←
→
Page content transcription
If your browser does not render page correctly, please read the page content below
INVESTOR PRESENTATION

Full Year 2016 Results

17 FEBRUARY 2017
AGENDA

 1. Introduction from the new Chief Executive     -   Paul Forman

 2. Financial Review - 2016                       -   Stefan Schellinger

 3. Initial reflections & considerations for 2017 -   Paul Forman

 4. Q&A

                                                        © 2013 ESSENTRA PLC   2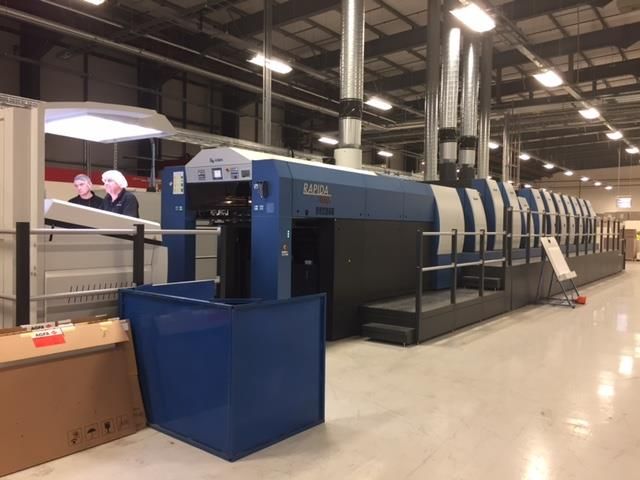
INTRODUCTION

Paul Forman
Chief Executive

                  © 2013 ESSENTRA PLC
FY 2016: SUMMARY

 • Significant revenue, profit and EPS decrease, largely driven by continued deterioration
   in Health & Personal Care Packaging and short-term commercial issues in Filter
   Products
    – Total revenue decline of 9% on a like-for-like basis
    – Total adjusted operating profit down 29% (at constant FX) to £132m
    – Adjusted EPS lower by 31% (at constant FX) to 36.3p

 • Impairment in the carrying value of Health & Personal Care Packaging of £124m
 • Net debt of £379m (FY 2015: £374m), reflecting improved H2 operating cash
   conversion
 • FY 2016 dividend unchanged at 20.7p per share
 • Disposal of Porous Technologies on track to complete in Q1 2017
    – Pro forma impact on leverage as at 31 December 2016 reduces net debt to EBITDA ratio from
      2.3x to 1.4x

 • Comprehensive business review already underway: clear corporate portfolio strategy
   to restore medium-term growth to be communicated with HY 2017 results at end-July

                           A year of challenge and change
                                                                                                  4
FINANCIAL REVIEW - 2016

Stefan Schellinger
Group Finance Director

                          © 2013 ESSENTRA PLC
INCOME STATEMENT - SUMMARY
                                                                            FY 16                       FY 15            Growth
                                                                              £m                         £m     Actual       Constant
                                                                                                                 FX            FX
Revenue                                                                    1,103.7                 1,098.1       +1%              -8%
Like-for-like1                                                             1,088.0                 1,196.8       -1%              -9%
Operating profit2                                                           131.9                       171.5    -23%             -29%
Operating margin                                                            12.0%                   15.6%       -360bps       -370bps
Profit before tax2                                                           119.4                      161.2    -26%             -32%
Adjusted earnings2                                                           94.8                       123.6    -23%             -31%
Adjusted earnings per share2                                                36.3p                       47.6p    -24%             -31%

1   At constant exchange rates, adjusted for the acquisition of Clondalkin SPD (from 30 January 2015)
2 Adjusted   to exclude intangible amortisation and exceptional operating items
                                                                                                                                         6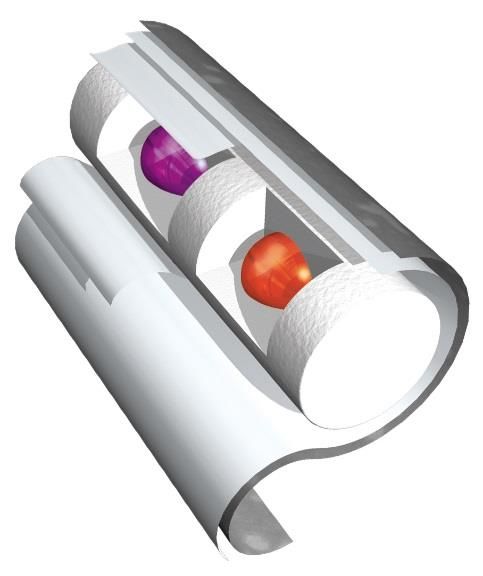
REVENUE BY SBU
                                                                           FY 16                 FY growth

                                                                             £m                   Constant
                                                                                                    FX
                Health & Personal Care Packaging                            430.2                        -6%

                Like-for-like1                                                                           -9%

                Component Solutions                                         302.6                        -3%

                Component Solutions ex-PPT                                  290.3                        -1%

                Filtration Products                                         374.4                    -14%

                Eliminations                                                (3.5)

                Group                                                     1,103.7                        -8%

                Group – at actual FX                                                                 +1%

1   At constant exchange rates, adjusted for the acquisitions of Clondalkin SPD (from 30 January 2015)
                                                                                                               7
COMPONENT SOLUTIONS
FY 2016 REVENUE: £303M, LFL -3% (-1% EX-PPT). OM -200BPS
• Broad-based Components growth in Continental
Europe and Asia
– More stable H2 performance in the UK
– US initiatives have arrested rate of decline vs H1 -
remains a work-in-progress
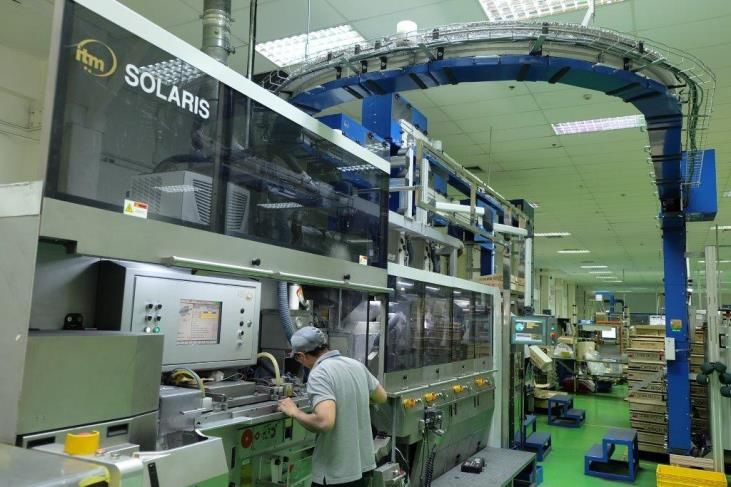
• Continued operational initiatives
– Global inventory reduction programme
– Automation of certain processes in Malaysia
– Consolidation of footprint in China
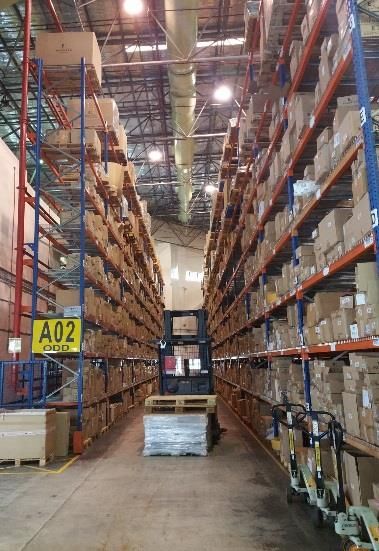
Doubling in SKUs in Singapore regional hub • Increase in access solutions, supported by new
warehouse, to better serve the Asia region
platform introductions
– Category marketing materials also launched in all
regions
• Strong result in Extrusion, supported by continued
benefit from expertise in complex, technical profiles
– Significant new contract awards
• Impact of oil & gas backdrop on PPT result …
– … BUT well-positioned for an industry recovery
• Site footprint consolidation and further efficiencies
– Offset by UK and US softness, PPT decline and
Launch of new category marketing materials across all Extrusion mix effect 8
geographic regions
FILTRATION PRODUCTS
   FY 2016 REVENUE: £374M, LFL -14%. OM -240BPS
                                                               • Underlying filter volumes < FY 2015 …
                                                                   – Sizeable European contract not offset by new
                                                                     business
                                                                   – De-stocking in China
                                                                   – Delay in transfer of business from the US to Asia
                                                                   – Slower ramp-up of new projects

                                                               • … but continued recognition of innovation
                                                                 capabilities
                                                                   – Esp. smaller diameter and tube capsule filters
                                                                   – Increase in number of joint development projects
      Further investment in Asia, to support special filters
                            growth
                                                               • Geographic footprint enhanced and optimised
                                                                   – Excellent growth in Dubai
                                                                   – Transfer of Jarrow activities to Hungary completed
                                                               • Porous Technologies supported by new contract
                                                                 awards and commercialisation of recent wins
                                                                   – Led by health & personal care

                                                               • PT disposal on track for completion in Q1 2017
                                                               • Margin decline driven by volume and mix effect
                                                                 of lower special filters volume
                                                                   – Partly mitigated by continued efficiency benefits
Launch of innovative new capsule filters to meet consumer demand                                                   9
                     in this growing segment
HEALTH & PERSONAL CARE PACKAGING
FY 2016 REVENUE: £430M, LFL -9%. OM -550BPS
• Significant decline in H&PC revenue …
– Integration challenges at certain acquired sites
– Impact of “pruning” less profitable business
• … but further innovation and commercialisation
– “Freshness” labels in FMCG segment
– Cartons, leaflets and labels in H&PC sector
– Premium packaging capabilities in beauty
• Further weakness in tapes
– Ongoing trend of removing value-added features in
Tobacco segment …
Investment to support shorter-run, premium packaging – … but more normalised backdrop in US PoP
capabilities
• Kamsri acquired assets successfully transferred to
Essentra Bangalore facility
– Additional carton line subsequently added
– New domestic business wins
• Design Hub launched
– Combines structural and creative design with technical
packaging expertise
• Margin dilution due to revenue decline / operational
integration challenges / double-running costs and
Development of creative packaging solutions, mix effect of tobacco tear tape
10
combining design with technical expertise1
OPERATING PROFIT BY SBU
FY 16 Growth Margin Margin
£m Constant FY 16 FY 15
FX
Health & Personal Care 34.5 -44% 8.0% 13.6%
Packaging
Component Solutions ex- 56.9 -7% 19.6% 21.2%
PPT
PPT (2.5) n/a -20.2% 5.7%
Filtration Products 59.0 -25% 15.8% 18.3%
Central Services (16.0)
Group 131.9
Group – at actual FX 12.0% 15.6%
1 Adjusted to exclude intangible amortisation and exceptional operating items
11INCOME STATEMENT – CONTINUED
FY 16 Growth
£m Actual Constant
FX FX
Operating profit1 131.9 -23% -29%
Net finance charge (12.5) -21% -19% Higher average
net debt
Profit before tax1 119.4 -26% -32%
Taxation (23.9)
Tax rate down
- Underlying tax rate 20.0%
280bps
Net income1 95.5 -23% -31%
Adjusted earnings1 94.8 -23% -31%
EPS - adjusted1 36.3p -24% -31%
EPS – diluted, adjusted1 36.3p -23% -30%
1 Adjusted to exclude intangible amortisation of £32.9m and an exceptional pre-tax charge of £133.7m
12EXCEPTIONAL ITEMS
£m
Transaction costs from business acquisitions and disposals
Disposal of Porous Technologies1 4.7
Acquisition of Kamsri 0.3
5.0
Acquisition integration and restructuring costs
Healthcare Clondalkin integration 2.8
Components Asia 1.7
4.5
Other
Impairment of HPC SBU assets (primarily intangible assets) 123.9
Filtration Products 1.4
Release of deferred consideration (1.1)
124.2
Total Group 133.7
£124m impairment loss in regards to H&PCP
1 Including costs incurred on corporate reorganisation and cost of a claim settlement associated with the exit of Porous Technologies
13CASH FLOW1
£m
220.0 Operating Cash Conversion = 96%
(FY 2015 = 57%)
200.0
180.0
2
31.4 1.7 (38.3)
160.0
140.0 131.9
126.7 (17.4)
120.0
(11.3)
0.8 98.8
100.0
80.0
60.0
40.0
20.0
0.0-
Operating Non-cash Working Net capex Operating Tax Interest paid Pension Free cash
profit1 items capital cash flow 1 contributions flow1
1 Adjusted to exclude intangible amortisation and exceptional operating items 14
2 Being Depreciation of £34.8m and Share Option Expense / Other Movements of £(3.4)mNET DEBT RECONCILIATION
£m
As at 1 January 2016 373.9
FX 56.1
As at 31 December 2016 379.3
Change in net debt after FX (50.7)
Of which:
Free cash flow (98.8)
Dividends 54.0
Exceptionals 10.6
Net cashflow from employee trust shares (2.3)
Acquisitions 0.1
Other (14.3)
(50.7)
Net debt / EBITDA ratio of 2.3x
NOTE: 15
Negative numbers denote a cash inflow, positive numbers a cash outflowDISPOSAL OF POROUS - UPDATE
Key metrics (2016A)
2016 Group external revenue exc. Porous
• Purchase price*: £220m (£998.5m)
• Revenue: £105.2m £301.8m
269.1m
• Operating profit: £23.2m
• Employees: c.521
• Key sites divested**: 3x US, 1x Germany
£427.6m
Financial impact
• Pro forma FY 2016 net debt to EBITDA of 2016 Group OP exc. Porous
(£108.7m*** - 10.9% margin)
1.4x
• EPS dilution of c. 7.1p (FY 2016A) £35.8m
- Before redeployment of capital £54.4m
• Exceptional book gain of > £100m, subject
to customary completion adjustments and
foreign exchange
£34.5m
* Free of cash and debt
** Certain shared sites subject to Transfer of Service Agreements Component Solutions H&PC Packaging Filtration Products
*** After Central Services of £(16.2)m
Transaction on track to complete in Q1 16DIVIDEND
24.0
20.7 20.7
20.0
18.3
16.0 15.4
Pence
12.5
12.0
8.0
4.0
0.0
FY12 FY13 FY14 FY15 FY16
Unchanged dividend versus FY 2015
17INITIAL REFLECTIONS &
CONSIDERATIONS FOR 2017
Paul Forman
Chief Executive
© 2013 ESSENTRA PLCON THE PLUS SIDE …
• Strong position in niche markets
– Only global independent filter manufacturer
– #2 in the healthcare secondary packaging market
– Leading global manufacturer and distributor of industrial components
• International footprint
– Not global – strength in Europe and North America …
– … however, present across 33 countries, with Asia representing a growth opportunity
• Customer relationships
– Blue-chip customer list – from tobacco MNCs through pharma and FMCG leading names, to
major industrial manufacturers / OEMs
• Technical expertise
– Product innovation
– Operational centres of excellence
– Supply chain expertise
• Talented and dedicated people – clear internal desire to progress
• Strong balance sheet post-Porous Technologies divestment
Clear foundations to build from 19… & WHAT NEEDS TO BE ADDRESSED
• Lack of coherent corporate strategy
– Absence of alignment behind a common vision and purpose
– Inherent risk in capex / opex and commercial strategies
• Absence of common processes
– Or, to the extent that they exist, they are not resulting in optimal outcomes / sufficiently robust
• Market / customer sensing capabilities
– See 2016 profit warnings …
• Quantity and quality of resource
– Too thinly stretched in certain key areas
• “Penny wise, pound foolish …”
• Short-term focus and predisposition to fight fires, not prevent them
• Culture and morale
– Priority as Chief Executive is to create a safe, respectful and diverse working environment,
which enables talent to flourish
– Need to operate more as a team – not in silos
– Communication from the top has been sporadic and not consistent
– Little internal belief that a career could be developed
Financial & operational stability are key near-term priorities 20ROOT CAUSES OF ISSUES TO BE
ADDRESSED …
• Sub-optimal site integration
– Additional sales loss and cost overruns
– Poor service levels
• Quality
• OTIF (On Time in Full deliveries)
• Lead times
– Limited best-practice sharing => missed opportunities and repletion of mistakes
• Loss of people
– Part of drive to achieve cost synergies and / or …
– … changed circumstances
– => Haemorrhaging of skills and central / local contacts
• Also less in tune with markets and more prone to external surprises
• Matrix organisation
– Works against clarity of roles and accountability
– Insufficient investment in certain key capabilities to match increased scale
• Very incomplete perspective on where we should be going in the future
• Fragmented and often old network of IT systems
– Do not support co-ordinated action, ongoing business improvement or effective planning
Relevant across the Group – but particularly in H&PCP … 21SUMMARY OF FINDINGS & WHAT WE’RE ALREADY DOING • Strategic strengths are definitely there – Across all 3 SBUs • Issues are predominantly self-inflicted and not market-related – Therefore, capable of reversal • Strategy development programme already underway – will be shared in July • No further footprint change for the foreseeable future – Stabilise what we have and regain sales momentum • “SWAT” team, to focus on underperforming sites (esp. in H&PCP) and IT systems challenges • Development of a new set of customer retention programmes • I have met a number of excellent and passionate colleagues – Senior team are aligned and all are fired up to deliver • Regional and SBU matrix structure will be disbanded w.e.f 1 March → 3 global divisions – Phase 1 changes already communicated, phase 2 to follow with strategic review – IT to report directly into the Chief Executive • I have done this before – Re-establishment of clear strategic direction – Stabilising short-term commercial and operational issues – Returning a company in mature industries to growth – Building successful teams to achieve the above It will take some work and time – but we have a clear programme in place22
2017 CONSIDERATIONS / OUTLOOK
• Lower 2016 jump-off point

• Modest growth anticipated in CS: modest decline in Filters owing to tow pricing

• Further deterioration in H&PCP in the last couple of months of 2016 and into 2017
  – Weaker exit run rate
  – Need to stabilise challenged sites
  – A significant work in progress …

• Divestment of Porous Technologies during Q1 2017 (+ve impact on gearing)

• Some pricing and cost headwinds
  – H&PCP
  – Filters (tow pass-through)
  – Eg, raw materials, merit increases

• Possible measured investment in people and / or capability, to underpin future growth

• 2 SBUs on a more stable footing, but H&PCP receiving short-term focus and remedial
  action owing to significant decline at end-2016 and into 2017
  – Taken in aggregate, anticipate a decline in LFL revenue and operating profit in 2017

               Early signs of greater stability in some areas, but
                  decline in H&PCP will take time to reverse                               23
Q&A
© 2013 ESSENTRA PLCAPPENDICES
© 2013 ESSENTRA PLCINCOME STATEMENT – REPORTED BASIS
FY 16
£m
Adjusted operating profit 131.9
Intangible amortisation (32.9)
Exceptional operating items (133.7)
Reported operating loss (34.7)
Net finance charge (12.5)
Loss before tax (47.2)
Taxation 7.6
- Underlying tax rate 20.0%
Net income (39.6)
EPS (15.4)p
EPS - diluted (15.4)p
26DISCONTINUED OPERATIONS
RECONCILIATION Continuing ops. Discontinuing ops Total Group
£m £m £m
External revenue 998.5 105.2 1,103.7
Adjusted operating profit 108.7 23.2 131.9
Intangible amortisation (30.2) (2.7) (32.9)
Exceptional operating items (128.5) (5.2) (133.7)
Reported operating (loss) / profit (50.0) 15.3 (34.7)
Net finance charge (12.5) - (12.5)
(Loss) / profit before tax (62.5) 15.3 (47.2)
Taxation credit / (expense) 11.5 (3.9) 7.6
(Loss) / profit after tax (51.0) 11.4 (39.6)
(Loss) / earnings per share – reported (19.8)p 4.4p (15.4)p
(Loss) / earnings per share – adjusted 29.2p 7.1p 36.3p
27REVENUE GROWTH – BY REGION
1
FY16 FY growth FY growth
£m Constant LFL2
FX
Europe 522.7 -11% -12%
Americas 387.3 -7% -9%
Americas ex-PPT 375.4 -6% -8%
Asia 193.7 -1% -1%
Group 1,103.7 -8% -9%
Group – at actual FX +1%
1 Revenue by destination
2 At constant exchange rates, adjusted for the acquisitions of Clondalkin SPD (from 30 January,2015)
28EXCHANGE RATES
Year ended 31 December 2016 Average Closing
US $/£ 1.36 1.24
Euro €/£ 1.23 1.17
Impact of a one cent change Op. Profit (£m)
US $/£ 0.4
Euro €/£ 0.3
Year ended 31 December 2015 Average Closing
US $/£ 1.53 1.47
Euro €/£ 1.37 1.36
29DISCLAIMER IMPORTANT LEGAL NOTICE THIS DOCUMENT IS STRICTLY CONFIDENTIAL TO THE RECIPIENT AND HAS BEEN SUBMITTED TO YOU SOLELY FOR YOUR INFORMATION. THE RECIPIENT MAY NOT REPRODUCE OR REDISTRIBUTE ANY PART OF THIS DOCUMENT TO ANY PERSON IN ANY FORM. THIS DOCUMENT AND THE PRESENTATION TO WHICH IT RELATES (“PRESENTATION”) NEITHER CONSTITUTES, NOR FORMS PART OF, AN ISSUE FOR SALE OR SUBSCRIPTION OF, OR SOLICITATION OF ANY OFFER OR INVITATION TO SUBSCRIBE FOR, UNDERWRITE OR OTHERWISE ACQUIRE OR DISPOSE OF ANY SECURITIES OF ESSENTRA PLC (THE “COMPANY”) NOR SHOULD IT OR ANY PART OF IT FORM THE BASIS OF, OR BE RELIED ON IN CONNECTION WITH, ANY CONTRACT OR COMMITMENT WHATSOEVER WHICH MAY AT ANY TIME BE ENTERED INTO BY THE RECIPIENT OR ANY OTHER PERSON, NOR DOES IT CONSTITUTE AN INVITATION OR INDUCEMENT TO ENGAGE IN INVESTMENT ACTIVITY UNDER SECTION 21 OF THE UK FINANCIAL SERVICES AND MARKETS ACT 2000, NOR DOES IT CONSTITUTE AN INVITATION TO EFFECT ANY TRANSACTION WITH THE COMPANY OR TO MAKE USE OF ANY SERVICES PROVIDED BY THE COMPANY. THE DISTRIBUTION OF THIS DOCUMENT IN OTHER JURISDICTIONS MAY BE RESTRICTED BY LAW AND PERSONS INTO WHOSE POSSESSION THIS DOCUMENT COMES SHOULD INFORM THEMSELVES ABOUT, AND OBSERVE, ANY SUCH RESTRICTIONS. WHILE THE INFORMATION IN THIS DOCUMENT AND THE OPINIONS ARE BASED ON SOURCES BELIEVED TO BE RELIABLE THE COMPANY HAS NOT INDEPENDENTLY VERIFIED THE CONTENTS OF THIS DOCUMENT. ACCORDINGLY, NO REPRESENTATION OR WARRANTY, EXPRESS OR IMPLIED, IS MADE AS TO AND NO RELIANCE SHOULD BE PLACED ON THE FAIRNESS, ACCURACY, COMPLETENESS OR CORRECTNESS OF THE INFORMATION OR OPINIONS CONTAINED IN THIS DOCUMENT OR IN ANY PRESENTATION OR OTHER COMMUNICATION (WHETHER WRITTEN OR ORAL) ACCOMPANYING THIS DOCUMENT. THE INFORMATION AND OPINIONS CONTAINED IN THIS DOCUMENT OR THE PRESENTATION ARE PROVIDED AS AT THE DATE OF THIS PRESENTATION AND ARE SUBJECT TO CHANGE WITHOUT NOTICE. NEITHER THE COMPANY NOR ITS SHAREHOLDERS NOR ANY OF THEIR ASSOCIATES OR AFFILIATES NOR ANY OF THEIR RESPECTIVE DIRECTORS, MEMBERS, OFFICERS OR EMPLOYEES SHALL HAVE ANY LIABILITY WHATSOEVER FOR ANY LOSS HOWSOEVER ARISING DIRECTLY OR INDIRECTLY FROM ANY USE OF THIS DOCUMENT OR ITS CONTENTS OR OTHERWISE ARISING IN CONNECTION THEREWITH. NEITHER THE INFORMATION IN THIS DOCUMENT NOR THE PRESENTATION SHOULD NOT BE INTERPRETED AS A PROFIT FORECAST NOR SHOULD ANY INFORMATION CONTAINED HEREIN BE INTERPRETED TO MEAN THAT THE FUTURE EARNINGS PER SHARE OF THE COMPANY WILL NECESSARILY MATCH OR EXCEED THE HISTORICAL PUBLISHED EARNINGS PER SHARE. PAST PERFORMANCE CANNOT BE RELIED ON AS A GUIDE TO FUTURE PERFORMANCE. ALL STATEMENTS OTHER THAN STATEMENTS OF HISTORICAL FACTS INCLUDED IN THIS PRESENTATION, INCLUDING, WITHOUT LIMITATION, THOSE REGARDING THE COMPANY’S FINANCIAL POSITION, BUSINESS STRATEGY, PLANS AND OBJECTIVES OF MANAGEMENT FOR FUTURE OPERATIONS (INCLUDING DEVELOPMENT PLANS AND OBJECTIVES RELATING TO THE COMPANY’S SERVICES) ARE 'FORWARD-LOOKING STATEMENTS'. FORWARD-LOOKING STATEMENTS INVOLVE KNOWN AND UNKNOWN RISKS, UNCERTAINTIES AND OTHER IMPORTANT FACTORS THAT COULD CAUSE THE ACTUAL RESULTS, PERFORMANCE OR ACHIEVEMENTS OF THE COMPANY OR THOSE MARKETS AND ECONOMIES TO BE MATERIALLY DIFFERENT FROM FUTURE RESULTS, PERFORMANCE OR ACHIEVEMENTS EXPRESSED OR IMPLIED BY SUCH FORWARD-LOOKING STATEMENTS. THESE RISKS AND UNCERTAINTIES INCLUDE INTERNATIONAL, NATIONAL AND LOCAL CONDITIONS AND OTHER FACTORS INCLUDING THOSE DESCRIBED UNDER “MANAGEMENT OF PRINCIPAL RISKS” IN THE COMPANY’S ANNUAL REPORT AND ACCOUNTS. SUCH FORWARD-LOOKING STATEMENTS ARE BASED ON NUMEROUS ASSUMPTIONS REGARDING THE COMPANY’S PRESENT AND FUTURE BUSINESS STRATEGIES AND THE ENVIRONMENT IN WHICH THE COMPANY WILL OPERATE IN THE FUTURE AND SUCH ASSUMPTIONS MAY OR MAY NOT PROVE TO BE CORRECT. THESE FORWARD-LOOKING STATEMENTS SPEAK ONLY AS AT THE DATE OF THIS PRESENTATION. THE COMPANY EXPRESSLY DISCLAIMS ANY OBLIGATION (OTHER THAN PURSUANT TO LAW) OR UNDERTAKING TO DISSEMINATE ANY UPDATES OR REVISIONS TO ANY FORWARD- LOOKING STATEMENTS CONTAINED HEREIN TO REFLECT ANY CHANGE IN THE COMPANY’S EXPECTATIONS WITH REGARD THERETO OR ANY CHANGE IN EVENTS, CONDITIONS OR CIRCUMSTANCES ON WHICH ANY SUCH STATEMENT IS BASED.
INVESTOR PRESENTATION

Full Year 2016 Results

17 FEBRUARY 2017
You can also read