Investor Presentation August 2017 - Investor Contact: Website: www.trin.net - Trinity Industries, Inc.
←
→
Page content transcription
If your browser does not render page correctly, please read the page content below
Investor Presentation
August 2017
Investor Contact: TrinityInvestorRelations@trin.net
Website: www.trin.net
Forward Looking Statements

This presentation contains “forward looking statements” as defined by the Private
Securities Litigation Reform Act of 1995 and includes statements as to
expectations, beliefs and future financial performance, or assumptions underlying
or concerning matters herein. These statements that are not historical facts are
forward looking. Readers are directed to Trinity’s Form 10-K and other SEC filings
for a description of certain of the business issues and risks, a change in any of
which could cause actual results or outcomes to differ materially from those
expressed in the forward looking statements. Any forward looking statement
speaks only as of the date on which such statement is made. Trinity undertakes no
obligation to update any forward looking statement or statements to reflect
events or circumstances after the date on which such statement is made.

                                                                                2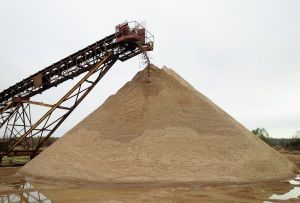
Agenda

I.     Overview
II.    Key Investment Considerations
III.   Strategy and Vision
IV.    Financial Highlights
V.     Appendix

                                       3
I. Trinity Industries, Inc. Overview
• Trinity Industries, Inc. is a diversified industrial
company that owns complementary market-
leading businesses providing products and
services to the energy, chemical, agriculture,
transportation, and construction sectors
• Trinity operates through five business segments:
• Rail Group
• Railcar Leasing and Management Services
Group (“Leasing”)
• Inland Barge Group
• Construction Products Group (“CPG”)
• Energy Equipment Group (“EEG”)
External Revenue by Business Group(1)
• The Company serves its customers through $7,000 $6.00
manufacturing facilities located in North America $6,000 $5.00
and had approximately 14,500 employees at $5,000
quarter end June 30, 2017 $4.00
Revenue
EPS
$4,000
$3.00
• Total Revenue and EBITDA for the LTM 06/17 was $3,000
$2.00
$4.0 billion and $890 million, respectively $2,000
$1,000 $1.00
$0 $0.00
($mm) 2009 2010 2011 2012 2013 2014 2015 2016 LTM
All share and per share information has been retroactively adjusted to reflect (2) 06/17
the 2-for-1 stock split effective in June 2014. Rail Group Leasing Barge
CPG EEG All Other
All Footnotes throughout the presentation are listed on Slide 27. EPS, Total Company-Diluted
4II. Key Investment Considerations
Leading Market
Positions
Diversified Portfolio of
Seasoned Performers
Businesses
Flexible and Cost-
Focused on
Effective
Enrichment Value
Manufacturing
5Leading Market Positions in North America
Rail Group Leading manufacturer of railcars
Leading manufacturer of railcar axles
Leading manufacturer of railcar coupling devices
Railcar Leasing and Leading provider of railcar leasing and management
services
Management Services
Group
Inland Barge Group Leading manufacturer of inland barges and fiberglass
barge covers in the United States
Construction Products Leading full-line manufacturer of highway guardrail and
crash cushions in the United States
Group
Leading producer and distributor of lightweight and
natural construction aggregates in the western and
southwestern United States
Energy Equipment Leading manufacturer of structural wind towers
Group Leading manufacturer of storage and distribution
containers and tank heads for pressure and non-
pressure vessels
Leading manufacturer of steel structures for electricity
transmission and distribution
6Diversified Portfolio of Businesses
PAST (FY 2000) Elevating Our Financial Performance PRESENT (LTM 06/17)
Total Revenues = $2.7 B Trinity’s long-term goal is to establish Total Revenues = $4.0 B
sustainable earnings growth over economic
cycles 7%
$5.50 Calendar Year EPS
21%
42%
$4.50 Revenue
Revenue
Revenue Revenue
$3.50
$2.50 12%
$1.50 18%
$0.50
4%
-$0.50 18%
2004 2005 2006 2007 2008 2009 2010 2011 2012 2013 2014 2015 2016 LTM 29%
(3) 06/17
Operating Operating
We strive to outperform prior cyclical peaks
Profit (1) Profit (1)
with higher EPS and better returns; raise the 11%
earnings floor; and improve balance sheet
strength during cyclical downturns
38%
(2) (2) Rail Leasing CPG EEG Barge
(2) (2)
All Footnotes throughout the presentation are listed on Slide 27.
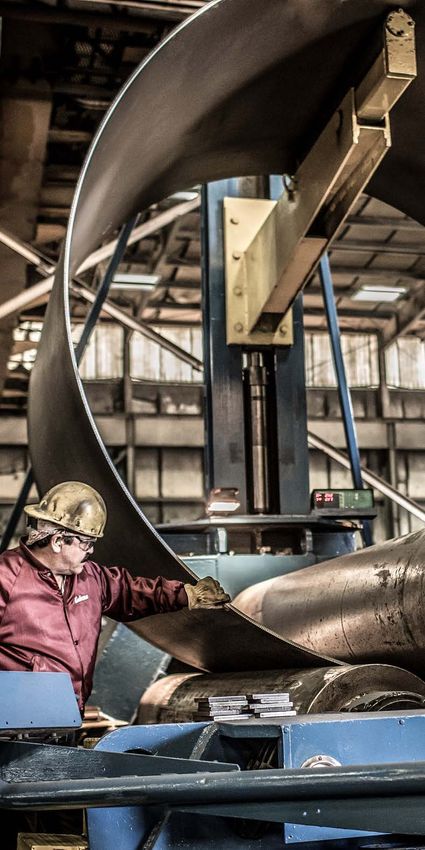
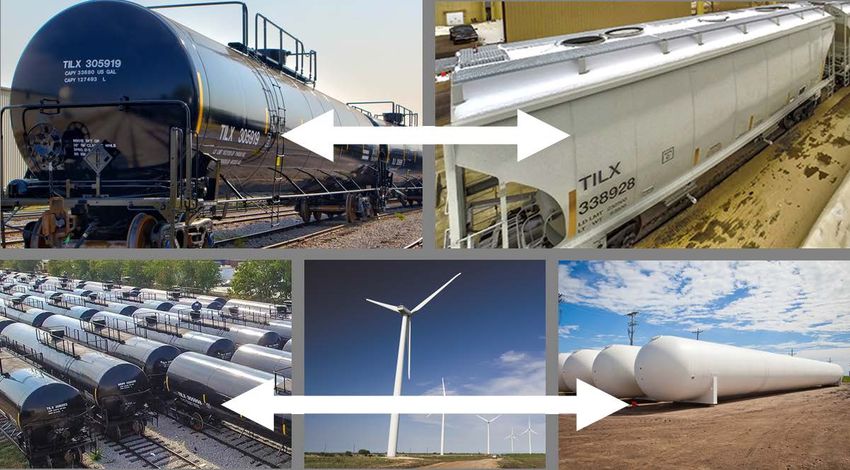
7Flexible and Cost-Effective Manufacturing
Flexibility
Trinity's manufacturing flexibility
across products and business
segments enhances our ability to
opportunistically respond to
changes in market demand
Cost-Effective
Trinity’s manufacturing scale,
vertical integration, and presence
in the Southern U.S. and Mexico
provides cost effective benefits
across multiple business
segments
In recent years, Trinity has invested in its manufacturing footprint to establish “multi-purpose”
facilities, enhancing its flexible manufacturing footprint.
8Focused on Enrichment Value
External Reporting Groups
Rail Leasing Construction Energy Inland Barge
Trinity focuses on …generating synergies
collaboration across that enhance value and
business segments… ultimately provide
competitive benefits
Operational Focus Areas
Customer Internal Shared Best Facility Centralized
Sharing Component Manufacturing Optimization Cost Savings
Sourcing Practices
9Seasoned Performer Across Market Conditions
Incorporated in 1933 with a strong corporate culture and commitment to
Company values
Seasoned management team knows how to assess the market, proactively plan
for cycles and quickly adapt to changing market conditions
Cost-effective and flexible manufacturing footprint is a competitive advantage
for many of our product lines
Significant liquidity position of approximately $2.3 billion and a strong balance
sheet at quarter end June 30, 2017
Track record of maintaining a healthy liquidity position across the business
cycle; “investment-grade” credit ratings from two of the three principal rating
agencies
S&P – Rating of “BBB-” with an Outlook of “Stable”
Fitch – Rating of “BBB-” with an Outlook of “Stable”
Moody’s – Rating of “Ba1” with an Outlook of “Stable”
10III. Strategy and Vision: Operational
Be a premier, diversified industrial company
that generates superior earnings and returns
for shareholders
Acquire Complementary Product Portfolios
Diversify Through Organic Growth
Selectively Build our Backlogs
Maximize Manufacturing Efficiency
Strategically Grow the Lease Fleet
11Strategy and Vision: Financial
As of 06/30/17
Balance Sheet Debt ~ $3.3 B(1)
Recourse Debt Working Capital
Senior Notes(1) $400
Convertible Subordinated Notes(1) 449
Capital Leasing Obligations(1) 30
Total Recourse $879 mm
Maintain a Capital
Non-Recourse Leasing Debt(2)
Warehouse Facility(1) $168 conservative and Expenditures
Long-term Financings: liquid balance
Wholly-Owned(1) 915
Partially-Owned(1) 1,356
sheet to be
Total Non-Recourse Leasing $2,439 mm attractively
positioned to
Available Liquidity ~ $2.3 B
capitalize on Acquisitions
Cash, Cash Equivalents, opportunities
& Short Term Marketable Securities $988
Corporate Revolver Availability 507
Warehouse Availability 832
Total Available Liquidity $2,327 mm
Shareholder
Equity ~ $4.3 B Distributions
All Footnotes throughout the presentation are listed on Slide 27.
12Strategy and Vision: RIV Platform
▪ Railcar Investment Vehicles, or “RIVs”, are customized portfolios of leased
railcars for institutional investors and other entities that are developed and
managed by TrinityRail
▪ TrinityRail is the first in the industry to create a platform of RIVs for
institutional investors. Since FY 2006, we have placed approximately $5.2
billion to various RIVs(1)
▪ Institutional investors continue to invest in RIVs developed and managed by
TrinityRail because of the scale and diversity of our products and services,
the strength of our commercial relationships, our “cradle to grave” asset
expertise, and our track record of value-creating investments
All Footnotes throughout the presentation are listed on Slide 27.
13IV. Financial Highlights
Trinity’s EPS Summary FY 2009 – LTM 06/17(3)
LTM 06/17 vs. LTM 06/16(1) $6.00
$5.08
Revenues decreased 26.7% to $4.0 billion from $5.00
$5.46 billion $4.00
$4.19
Operating profit decreased 52.0% to $475.1 million $3.00
(2) $2.38
from $990.1 million $2.25
$2.00 $1.59 $1.62
EBITDA decreased 36.9% to $889.7 million from $1.00 $0.67
$0.88
$0.43
$1.41 billion
$0.00
Earnings per common diluted share decreased 2009
(4)
2010
(5)
2011 2012 2013 2014 2015 2016 LTM
06/17
58.1% to $1.62 from $3.87 per diluted share
Trinity’s EBITDA Summary FY 2009 – LTM 06/17(6)
$1,800 $1,713
$1,600 $1,502
$1,400
$1,200
$989 $1,032
$1,000 $890
$774
$800
$612
$600 $443 $470
$400
$200
$0
2009 2010 2011 2012 2013 2014 2015 2016 LTM
All Footnotes throughout the presentation are listed on Slide 27. 06/17
14Guidance and Outlook (As of July 26, 2017)
Total Company
EPS ~ $1.10- $1.30 for FY 2017
Manufacturing and Corporate Capital Expenditures ~ $90mm - $110mm in FY 2017
Elimination Impact of Net Income Attributable to Noncontrolling Interest ~ $0.06 per share in FY 2017
Rail Group
Revenues ~ $2.0B in FY 2017
OP Margin ~ 9.5% in FY 2017
Shipments ~ 18,000 in FY 2017
Leasing Group
Revenues from Operations ~ $720mm in FY 2017
OP from Operations ~ $310mm in FY 2017
Revenue Eliminations ~ $690mm in FY 2017
OP Elimination Impact ~ $90mm in FY 2017
Net Leasing Investment ~ $315mm - $365mm in FY 2017
Total Sales of Leased Railcars ~ $300mm - $350mm in FY 2017
Inland Barge Group
Revenues ~ $155mm in FY 2017
OP Margin ~ 1.5% in FY 2017
Construction Products Group
Revenues ~ $510mm in FY 2017
OP Margin ~ 14% in FY 2017
Energy Equipment Group
Revenues ~ $950mm in FY 2017
OP Margin ~ 10% in FY 2017
Any forward-looking statements made by the Company speak only as of the date on which they are made. The Company is under no obligation to, and expressly
disclaims any obligation to, update or alter its forward-looking statements, whether as a result of new information, subsequent events or otherwise.
15Appendix:
Operating Business Summaries
16Rail Group
Market Positioning Current Performance(4)
Leading manufacturer of railcars, railcar axles, and coupling Trinity delivered 21,855 railcars representing 42.7% of industry
devices in North America shipments during LTM 06/17; Trinity received orders for 9,970
railcars representing 30.3% of the industry total during LTM 06/17
Broadest product offering for railcar manufacturing in North
America Trinity’s $2.7 billion order backlog of 27,580 railcars accounts for
41% of industry backlog as of 06/17 and includes a broad mix of
Networking of customers between railcar sales and railcar
railcar types across many industrial sectors
leasing
Investment in maintenance services has expanded capabilities Orders received for the second quarter of 2017 of 5,705 railcars
were strong relative to recent quarters and reflected a broad mix
for our lease fleet and key customers
of railcar types. While encouraged by the order level, a sustained
Focus on new and advanced engineering designs level of improvement in rail industry fundamentals needs to
Centralized sourcing provides cost savings continue to declare a market recovery
Streamlined manufacturing efficiencies
Business Conditions/Demand Outlook Rail Group Revenues and OP Margin(1)
100,000 Railcar Deliveries (1958 - 2020P) $5,000 24.0%
$4,462
90,000 Projections based on Third Party estimates(3) $4,500 $3,817 20.0%
80,000 $4,000
$3,500 16.0%
70,000
$2,868 $3,077
60,000 $3,000
12.0%
$2,481
50,000 $2,500
$2,013 8.0%
40,000 $2,000
30,000 $1,500 $1,275 4.0%
20,000 $895
$1,000
10,000 $522 0.0%
$500
0
$- -4.0%
($mm) 2009 2010 2011 2012 2013 2014 2015 2016 LTM
(2) 06/17
All Footnotes throughout the presentation are listed on Slide 27. Railcar Revenue Parts & Components Revenue OP Margin
17Railcar Leasing & Management Services Group
Market Positioning Current Performance
Leading provider of comprehensive railcar leasing and Delivered solid financial performance during the LTM 06/17 driven
management services by lease fleet growth, high fleet utilization, and disciplined cost
management initiatives
Marketed with railcar sales activities as TrinityRail®
Secondary markets continue to reflect strong valuations of leased
Provider of operating leases offering ‘one stop shopping’ for railcar assets. We completed $100 million of leased railcar sales
TrinityRail shipping customers year-to-date and expect an additional $200-250 million during the
Scale of operations facilitates active participation in secondary remainder of FY 2017
market activities to create railcar investment vehicles and We expect to continue growing our lease fleet in FY 2017; as of
asset management services for institutional investors 06/17, our Rail Group backlog included $993 million of railcars
Total leased railcars under management, including railcars sold dedicated to the lease fleet
to institutional investors, were more than 106,700 as of June
30, 2017, an increase of 6.7% year-over-year
Business Conditions/Demand Outlook Leasing Operating Revenues and Profit (Excludes Car Sales)(3)
120,000 More Than Tripled the Size of Trinity’s Owned $800 60.0%
and Managed Lease Fleet since 2006 $700 $701 $716
100,000 $700
$632 50.0%
$587
$600 $529
80,000
$500 $493
$461 40.0%
60,000
$400
$329
40,000 $300 30.0%
20,000 $200
20.0%
$100
-
12/06 12/07 12/08 12/09 12/10 12/11 12/12 12/13 12/14 12/15 12/16 LTM $0 10.0%
(1) (2) 06/17 ($mm) 2009 2010 2011 2012 2013 2014 2015 2016 LTM
Managed Fleet Wholly-Owned & Partially-Owned 06/17
TILC Revenue Operations Margin PBT Margin
All Footnotes throughout the presentation are listed on Slide 27.
18Inland Barge Group
Market Positioning Current Performance
Leading manufacturer of inland barges and fiberglass barge Revenues down 50.0% in LTM 06/17 vs. LTM 06/16 as a
covers in the United States result of lower barge deliveries and product mix changes;
backlog at June 30, 2017 was $90.7 million
Multiple barge manufacturing facilities on inland waterways
enable rapid delivery Profit margins declined to 9.4 % in LTM 06/17 due to
product mix changes and a weak demand environment
Operating flexibility is a key differentiator causing pressure on volume
Barge transportation has a cost advantage in high-cost fuel Investments made over the past decade have enhanced the
environments Barge segment’s production flexibility positioning the
business to respond effectively as market demand changes
Business Conditions/Demand Outlook Inland Barge Group Revenues and OP Margin
Weak market conditions persist. Overcapacity and declines in freight $800 24%
movements along the inland waterways continue to create $700 $675 $653 21%
headwinds $639
$600 $577 18%
Replacement demand driver (as of 12/31/16):(4) $527 $549
3,409 out of 18,897 hopper barges, or approximately 18.0%, are $500 15%
$422
greater than 20 years old $400
$403
12%
867 out of 3,683 tank barges, or approximately 23.5%, are greater $300 $270 9%
than 20 years old
$200 6%
From 2000 to 2015, the industry had a build-to-scrap ratio of 0.9x; in
2016 the ratio was 1.8x $100 3%
$0 0%
($mm) 2009 2010 2011 2012 2013 2014 2015 2016 LTM
(1) (2) (3) 06/17
Revenues OP Margin
All Footnotes throughout the presentation are listed on Slide 27.
19Construction Products Group
Market Positioning Current Performance
Leading U.S. manufacturer of highway guardrail, crash Operating Profit increased 17.3% in LTM 06/17 vs. LTM 06/16,
cushions, and other protective barriers resulting from a strong performance in our construction aggregates
business and improved efficiencies in our highway products business
Leading producer and distributor of lightweight and natural
Over the last five years, we have repositioned the portfolio to align
construction aggregates in the western and southwestern with more consistent demand drivers. In Q1 2013, we exited the
United States concrete business through an asset swap for the lightweight
aggregates business. The Company added additional lightweight
Diversified exposure to commercial, residential, industrial,
aggregate facilities in early 2015 and during Q2 2017, expanding our
and highway markets
geographic presence
Demand tied to the North American infrastructure build out In addition, we acquired the assets of a trench shoring business
and federal funding subsequent to Q2 2017, increasing our presence in this business that
we entered in 2012 with a similar-sized acquisition. In Q2 2015, we
divested the galvanizing business
Business Conditions/Demand Outlook Construction Products Group Revenues and OP Margin(1)
Fixing America’s Surface Transportation ACT (FAST) passed $600
$552
15.0%
$525 $533 $523
in December 2015 and authorized a five-year funding bill $500
$484 $507 14.0%
of $305 billion for highways and other related transit $453 13.0%
programs, providing much needed stability for public $400 $354 12.0%
agencies charged with planning transportation projects $281
11.0%
$300
10.0%
Strong demand for aggregates in the southwestern U.S. $200 9.0%
market due to residential and non-residential investment 8.0%
$100
7.0%
Committed to finding opportunities to expand our product
$0 6.0%
portfolio and grow our aggregates market position ($mm) 2009 2010 2011 2012 2013 2014 2015 2016 LTM
(2) 06/17
All Footnotes throughout the presentation are listed on Slide 27. Highway Products Aggregates Other OP Margin
20Energy Equipment Group
Market Positioning Current Performance
Leading manufacturer of wind towers, steel utility Structural Wind Towers:
structures, storage and distribution containers, tank heads Backlog of $945 million as of 06/17 provides solid visibility and
for pressure and non-pressure vessels, and cryogenic stable production through 2019
transportation equipment used to store and transport Received structural wind tower orders of $1.2 billion in FY 2016,
liquefied gases in North America including a $940 million order for wind towers deliverable during a
three-year period, that began in 2017
Total Business Segment:
Operating Profit declined in LTM 06/17 compared to LTM 06/16
reflecting mixed demand conditions for the end markets the
Group serves
Business Conditions/Demand Outlook Energy Equipment Group Revenues and OP Margin
$1,200 16%
Five-year spending bill passed by the federal government in $1,114
December 2015 included a tax incentive for wind power energy $992 $1,013 $993 14%
$1,000
through 2019; the multi-year incentive provides developers the
12%
necessary stable planning environment to develop wind
$800
projects $665 10%
Current demand levels and production visibility for utility $600 $559 8%
structures are improving; long-term demand fundamentals $510 $473
remain positive as future growth in investment spending, $420 6%
$400
especially connecting renewable energy to the grid, is expected 4%
The storage container industry is highly competitive and $200
2%
experiencing pricing pressure from current market conditions;
long-term demand fundamentals are positive given the $0 0%
significant investment by chemical companies along the Gulf ($mm) 2009 2010 2011 2012 2013 2014 2015 2016 LTM
06/17
Wind Tower and Utility Structures Revenues Other Revenues OP Margin
21How TrinityRail’s RIV platform works
Sources of Railcars for TrinityRail’s RIV platform TrinityRail’s Managed Fleet
Newly built leased railcars from TrinityRail
TrinityRail’s RIV platform
▪ Since FY 2006, we have
placed approximately
$5.2 billion to various
Railcars from TrinityRail’s Wholly-Owned RIVs(1)
Fleet (i.e., “Reservoir of railcars”)
Railcars acquired in secondary market
All Footnotes throughout the presentation are listed on Slide 27.
22Value proposition for institutional investors
Why invest in leased railcars? Why align with TrinityRail?
▪ Railcars are a critical component ▪ Scale and diversity of railcar manufacturing
of North America’s – Largest manufacturer of railcars in North
transportation infrastructure, America
transporting a diverse range of
commodities, intermediate
– Most diversified railcar product line available
in North America
goods, and finished products
▪ Strength and breadth of commercial
relationships
▪ Stable, hard asset investments – Currently responsible for the leasing and
with attractive returns and an
management of more than 106,700 railcars
inflationary hedge component
▪ “Cradle to grave” asset expertise including
engineering, manufacturing, maintenance
▪ Long-lived assets with an average services, leasing and management services
useful life of ~35-40 years
▪ Integrated business model that provides market
intelligence on the markets we serve and our
▪ Long term shift of railcar customers’ ongoing needs
ownership from shippers & ▪ Track record of executing value-creating
railroads towards third party transactions with sophisticated institutional
lessors like TrinityRail partners
23Value proposition for Trinity
TrinityRail Trinity Industries
▪ Enhances our ability to meet the needs ▪ Provides Trinity with a level of financial
of large customers flexibility that is unique among diversified
industrial companies
▪ Provides financial capacity to enhance
lease origination capabilities and expand ▪ Enhances our ability to reinvest in our
lease portfolio funding diversification railcar leasing and management services
platform, our portfolio of diversified
industrial businesses, and in other
▪ Increases size of managed fleet,
opportunities that enhance shareholder
generating recurring management fees
returns
while allowing us to maintain close
relationships with the end users of the
railcars ▪ Diversifies earnings base by expanding
position in value chain
▪ Further develops Trinity Industries
Leasing Company brand as premier ▪ Potential for additional income through
asset manager profits recognized at time of sale and, in
addition, management fees earned over
the longer term
24Reconciliation of PBT Margin –
Railcar Leasing and Management Services Group
(in millions except for PBT Margin)
2009 2010 2011 2012 2013 2014 2015 2016 LTM 06/17
From Leasing Operations:
Revenue $ 329 $ 461 $ 493 $ 529 $ 587 $ 632 $ 700 $ 701 $ 716
Operating Profit $ 129 $ 200 $ 225 $ 243 $ 267 $ 288 $ 331 $ 313 $ 339
Less: Interest Expense (80) (139) (161) (174) (157) (153) (139) (125) (124)
Profit Before Tax (PBT) $ 48 $ 62 $ 64 $ 68 $ 110 $ 135 $ 192 $ 188 $ 215
PBT Margin 15% 13% 13% 13% 19% 21% 27% 27% 30%
25Reconciliation of EBITDA (1)(2) (in millions)
2009 2010 2011 2012 2013 2014 2015 2016 LTM 06/17
Income (loss) from continuing operations ($140.8) $69.4 $146.8 $251.9 $386.1 $709.3 $826.0 $364.7 $269.5
Add:
Interest expense 123.1 182.1 185.3 194.7 187.3 193.4 194.7 181.9 181.2
Provision/(Benefit) for income taxes (11.5) 37.3 92.2 134.0 204.4 354.8 426.0 202.1 149.4
Depreciation & amortization expense 147.1 180.9 187.7 193.7 211.5 244.6 266.4 283.0 289.6
Goodwill impairment 325.0 - - - - - - - -
Earnings from continuing operations
before interest expense, income
taxes, and depreciation and
amortization expense $442.9 $469.7 $612.0 $774.3 $989.3 $1,502.1 $1,713.1 $1,031.7 $889.7
“EBITDA” is defined as income (loss) from continuing operations plus interest expense, income taxes, and depreciation and amortization
including goodwill impairment charges. EBITDA is not a calculation based on generally accepted accounting principles. The amounts
included in the EBITDA calculation, however, are derived from amounts included in the historical statements of operations data. In
addition, EBITDA should not be considered as an alternative to net income or operating income as an indicator of our operating
performance, or as an alternative to operating cash flows as a measure of liquidity. We believe EBITDA assists investors in comparing a
company’s performance on a consistent basis without regard to depreciation and amortization, which can vary significantly depending
upon many factors. However, the EBITDA measure presented in this presentation may not always be comparable to similarly titled
measures by other companies due to differences in the components of the calculation.
(1) EBITDA for previous years has been adjusted as a result of the divestiture of the Company’s Concrete business
(2) Includes results of operations related to TRIP starting January 1, 2010
26Footnotes
Slide 4
(1) Intersegment Revenues are eliminated and Leasing Revenues include revenues related to TRIP Holdings beginning in FY 2010; CPG Revenues for prior years have also been adjusted as a result of the
divestiture of its Concrete business in March 2013
(2) FY 2009 EPS excludes a $325 million pretax Goodwill impairment amounting to $1.57 per share; reported FY 2009 EPS was $(0.91)
Slide 7
(1) Operating Profit Excludes All Other, Corporate and is reduced by Leasing Interest Expense of $7 million in FY 2000 and $123.9 million in LTM 06/17
(2) Rail percentage represents Operating Profit less all Intersegment Company Eliminations; Leasing percentage represents Operating Profit less Leasing Interest Expense
(3) FY 2009 EPS excludes a $325 million pretax Goodwill impairment amounting to $1.57 per share; reported FY 2009 EPS was $(0.91)
Slide 12
(1) Excludes unamortized discount and/or unamortized debt issuance costs
(2) Leasing railcar equipment has a net book value of $5.9 billion, excluding deferred profit and including partially-owned subsidiaries
Slides 13 and 22
(1) Based on value of leased railcars at time of sale
Slide 14
(1) LTM 06/17 vs LTM 06/16, all numbers on a Continuing Operations basis except for EPS, which reflects Total Company EPS
(2) Operating Profit includes Leasing Interest Expense
(3) EPS is for Total Company, including Discontinued Operations; LTM 06/17 per share amount consists of sum of individual quarters
(4) Excludes $325mm pre-tax impact of impairment of Goodwill amounting to $1.57 per share; reported FY 2009 EPS was $(0.91)
(5) Beginning in FY 2010, TRIP Holdings Revenues and Operating Profit were consolidated with the Leasing Group
(6) See Note in Appendix pg. 26 for Reconciliation of EBITDA; EBITDA for previous years has been adjusted as a result of the divestiture of the Company’s Concrete business
Slide 17
(1) Before eliminations for Intersegment Sales to Leasing and Intercompany Profit
(2) Excludes $325mm pretax charge for impairment of Goodwill; reported FY 2009 operating loss margin was 39.8%
(3) Sources: Historical data as reported per the Railway Supply Institute. 2017-2020 projections are an average of estimates provided by Global Insight (07/17) and Economic Planning Associates, Inc. (04/17)
and are provided as a point of reference
(4) Source: Industry total as reported per the Railway Supply Institute’s American Railway Car Institute Committee (ARCI)
Slide 18
(1) Includes TRIP Holdings starting in 2007
(2) Includes Partially-Owned Subsidiaries
(3) Operations Margin calculated using only revenues and profit from Leasing Operations including Partially Owned Subsidiaries and excludes Car Sales; PBT Margin calculated using Operating Profit from
Leasing Operations less Leasing Interest Expense; See Appendix pg. 25
Slide 19
(1) OP Margin excludes a $5.1mm net gain due to flood-related insurance settlements; reported OP margin 16.3%
(2) OP Margin excludes a $15.5 mm net gain due to flood-related insurance settlements; reported OP margin 19.4%
(3) OP Margin excludes a $3.8 mm net gain due to flood-related insurance settlements and the sale of leased barges; reported OP margin 18.5%
(4) Informa Economics (03/2017)
Slide 20
(1) Revenues and OP Margin in prior years have been adjusted as a result of the divestiture of the Concrete business in March 2013
(2) Acquired Quixote Corporation in February 2010 which increased Highway Products revenue by 31% during 2010
27You can also read