CAPITAL ONE SECURITIES 9TH ANNUAL ENERGY CONFERENCE - December 2014
←
→
Page content transcription
If your browser does not render page correctly, please read the page content below
CAPITAL ONE SECURITIES 9TH ANNUAL ENERGY CONFERENCE

                                      December 2014
Forward-Looking & Other Cautionary Statements
Please reference the last two pages of this presentation for important disclosures on:
Forward-looking statements
Non-GAAP measures
Reserves
Risked Resources
2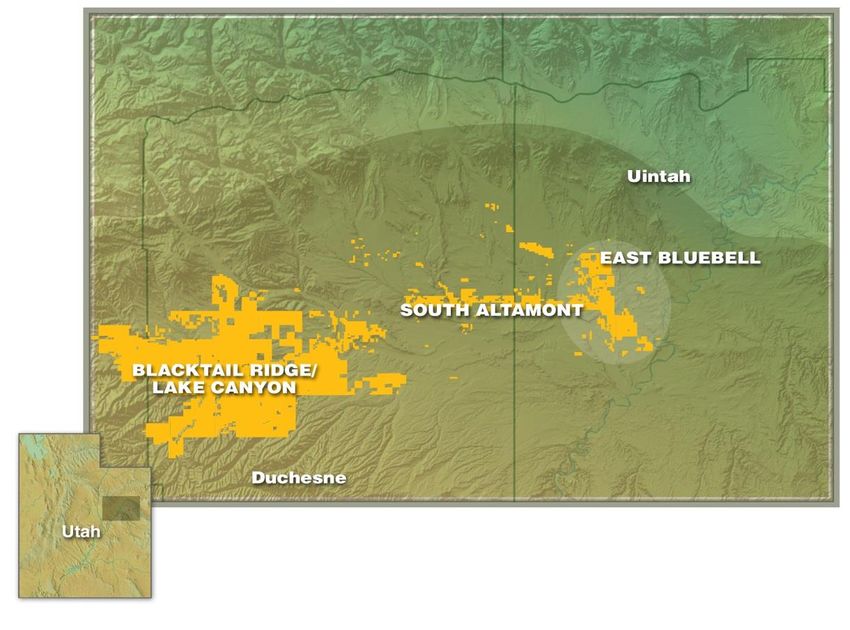
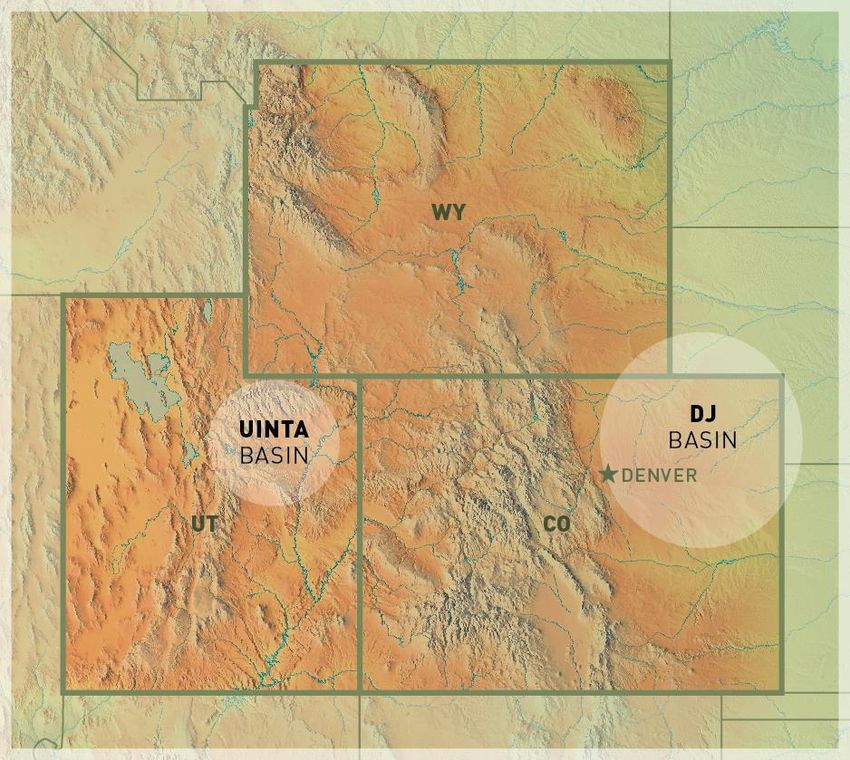
Company Overview (NYSE:BBG)
BBG is a Rocky Mountain based oil development company
~ $1 billion enterprise value
– ~$500 million market cap
2 areas of operation
– DJ Basin, Colorado & Wyoming
– Uinta Oil Program, Utah
3Q14 pro forma production ~70% oil
– Boe: 15,185 Boe/d
– Oil: 10,230 Bbls/d
– Gas: 20.1 MMcf/d
– NGLs: 1,610 Bbls/d
3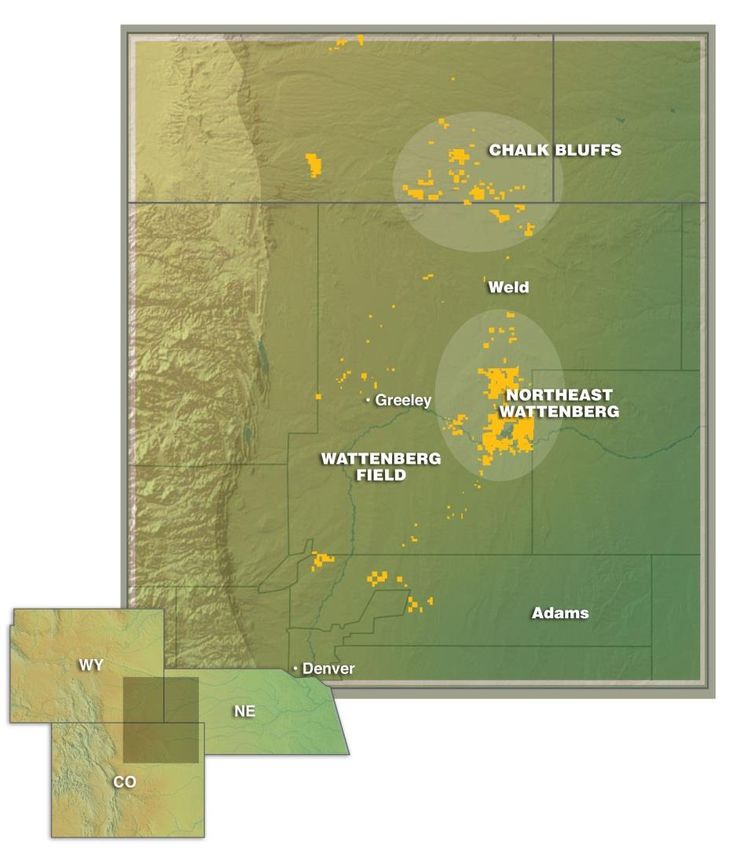
Value Creation 2014
2014 Accomplished key objectives
Completed transition from natural gas exploration company to oil development company
– Simplified portfolio to two core oil development programs
– Focused portfolio in DJ and Uinta basins that offer comparably strong returns
– Sold assets that we were no longer investing in
Added value to Northeast Wattenberg position by increasing net acreage 20% and
negotiating terms to increase flexibility for our drilling operations
Strengthened balance sheet: cut net-debt in half, established ample liquidity
Settled Cottonwood Gulch litigation with expected proceeds of $42mm
Allocated capital to most profitable programs increasing operating profit margin ~40%
Initiated extended reach lateral drilling program in DJ to maximize returns
– 27 longer lateral wells successfully drilled and completed to date
4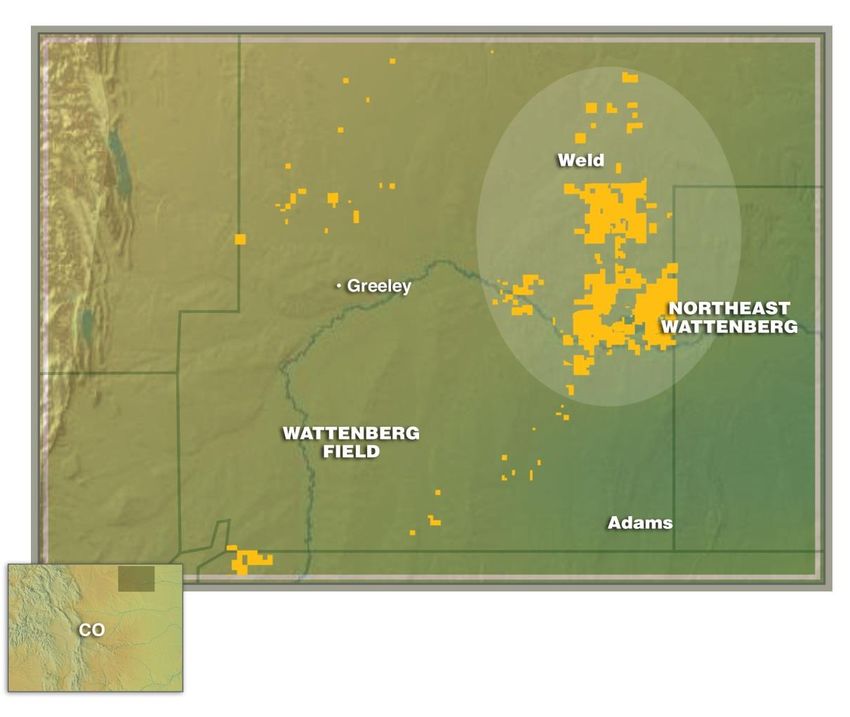
Exceptionally Well Positioned for 2015

Low exposure to risk in challenging commodity price environment
  • Fully hedged 2014 exit rate oil production – for 2015 ~11,000 b/d hedged at $90
    – Minimal sensitivity to oil prices, estimated at less than 5% of cash flow

  • Ample liquidity
    – $375 million revolver undrawn

    – $250+ million cash

  • Nominal drilling commitments to hold acreage
  • Flexibility in capital program - short term drilling and completion contracts enable
    flexibility in total capital commitments, timing of commitments and offer potential to
    negotiate improved costs
  • Expect double digit pro forma production growth in 2015 given contribution from wells
    already drilled coming on-line

                                                                                             5
Hedging Provides Price Predictability
Hedge on a 12-month forward basis to reduce risk and support capital expenditure
program
– 4Q14: 1.3 MMBoe; Oil: 10,600 Bbls/d at $93.88/Bbl; natural gas: 19,158 MMBtu/d at
$3.55/MMBtu
– 2015: 5.2 MMBoe; Oil 11,171 Bbls/d at $90.13/Bbl; natural gas: 20,000 MMBtu/d at
$4.13/MMBtu
– 2016: 2.0 MMBoe; Oil 4,746 Bbls/d at $87.46/Bbl; natural gas: 5,000 MMBtu/d at
$4.10/MMBtu
As of December 5, 2014 Volume (MMBoe)
Price ($/Boe)
2.5 $100
2.0 $80
Volume (MMBoe)
Price($/Boe)
1.5 $60
1.0 $40
0.5 $20
0.0 $0
4Q14 1Q15 2Q15 3Q15 4Q15
Notes: As of December 5, 2014. Average swap price is for illustrative purposes only and does not represent formal guidance.
6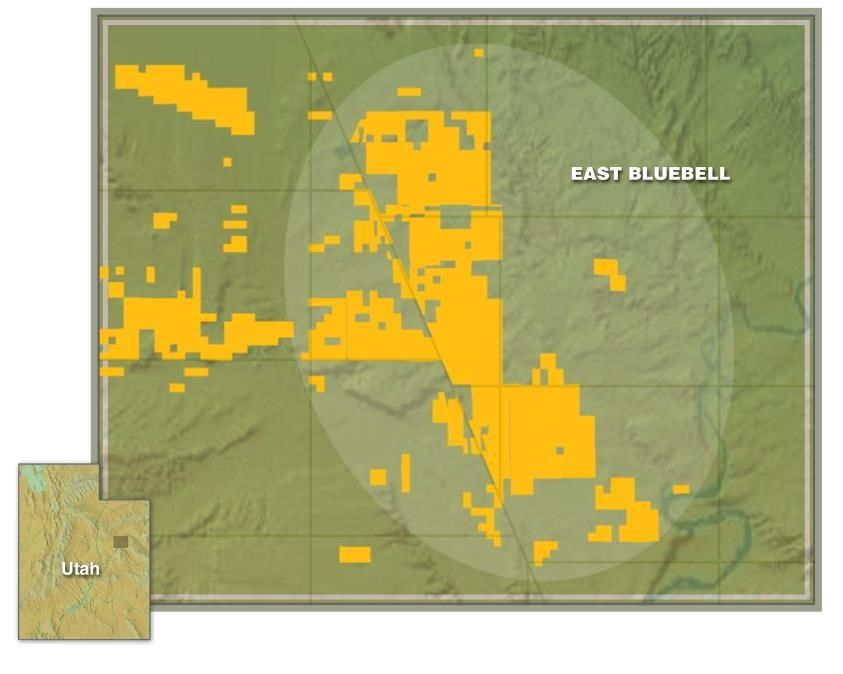
2015 Outlook: Operating Plan in Progress

Typically provide full year guidance late January

  • Current process and considerations in a challenging environment:
    – Reviewing range of scenarios/rig activity at multiple commodity prices

    – Maximum scenario under consideration = exit rate rig activity including 3 rigs in the DJ and 1 rig
      in UOP for total capital program of $475 million. Considering range of scenarios including
      significantly lower total capital expenditures

    – Investment decisions based on merits at pre-hedge pricing. Programs will be concentrated on
      highest return/best payback activity

    – Mindful of net-debt: EBITDAX with corporate objective of 2.5X or less

    – Mindful of timing and impacts to 2016 program

    – Cautious in baking-in cost reductions until they can be realized

                                                                                                           7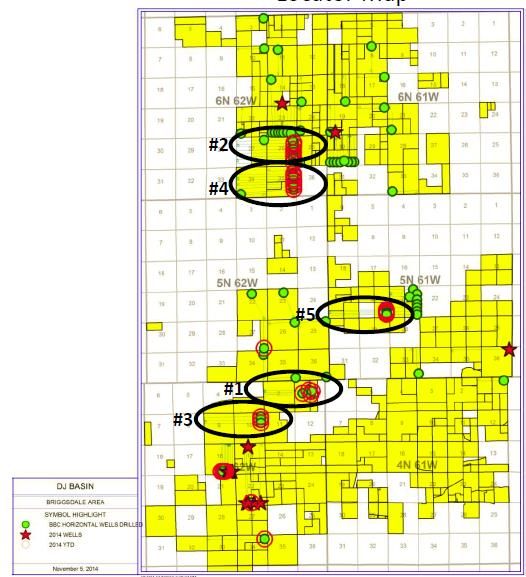
Preliminary Look at Returns

Sensitivity to commodity prices: returns hold up pre-hedge, favor XRLs

   • Investment decisions based on merits of investment pre-hedge
   • Northeast Wattenberg XRLs exceed 20% hurdle rate at $65 oil
        •    XRL assumptions: 870 MBoe EUR (3-stream); $8.25 MM D&C costs (includes additional costs for increased
            sand, stages and plug-n-perf but no additional EUR until evidenced over time)

        •   East Bluebell assumptions: 220 MBoe EUR; $2.5 D&C costs

                                                                                                                 8
Summary of September Transactions – Totaling $757 million
1. Simplified portfolio
2. Focused on highest return assets
3. Strengthened balance sheet, materially reduced debt
4. Increased Northeast Wattenberg position
Simplified portfolio
– 2 areas of operations down from 4
Focused on highest return assets
– DJ and Uinta Basins offer highest returns in portfolio
– Production 70% oil v. 39% oil pre-transaction
Strengthened balance sheet, materially reduced net debt
– ~$534MM v. $1.1 B
– Debt -to-EBITDAX moving toward long-term objective of 2.5X
Driving growth in the Northeast Wattenberg
– 7,856 net acres acquired, net acreage up ~20%
– 390 Boe/d production acquired
– Increased working interests gain increased control, ability to accelerate drilling
9
Net Debt Cut by More Than 50%

     ($ millions)                                        3Q14

     Outstanding Balance Revolving Credit Facility   $       -
     7.625% Senior Notes due 2019                        400.0
     7.000% Senior Notes due 2022                        400.0
     5.000% Convertible Senior Notes                      25.3
     Lease Financing Obligation                            3.7
       Total Debt                                    $   829.0
     Cash on hand                                        294.8
       Net Debt                                      $   534.2

     Borrowing Base                                  $   375.0
     Letter of Credit                                    (26.0)
     Cash on hand                                        294.8
      Liquidity                                      $   643.8

                                                                  10
Delivering High Growth from Core Oil Programs
Production (MMBoe) Operating Cash Flow* ($MM)
8 $300
6
$200
4
$100
2
0 $0
2010 2011 2012 2013 2014e 2010 2011 2012 2013 2014e
DJ UOP DJ UOP
Focused capital program on Uinta and DJ Basin development delivers strong
production and cash flow growth
*Operating cash flow is field level before general and administrative and interest expense.
11DJ BASIN
DJ Basin: Lots of Running Room
Added 7,856 net acres September 2014 to total 84,450 Niobrara and Codell Formations
Northeast Wattenberg: 49,365 net acres, up 20%
Chalk Bluffs: 22,680 net acres
Wattenberg interior: 12,405 net acres
Driving rapid growth
Production 3Q14: 8,270 Boe/d, up 150% from
3Q13
2014 plan: ~75% of capital program to drill ~65
gross/53 net and participate in ~47 gross/9 net
non-operated wells
Increased working interest through asset
exchange enables better control and flexibility
50 Miles
to make drilling program adjustments
BBG Acreage
Proved reserves YE13 66 MMBoe, up >350%
13DJ Basin: Production Growth
DJ Basin Net Production and Gross Operated Horizontal Wells Spud
9,000
8,270
6,000
Boe/d
3,000
1,564
0
3Q12 4Q12 1Q13 2Q13 3Q13 4Q13 1Q14 2Q14 3Q14
Operated
13 7 2 10 21 27 20 13 14
Wells spud
Driving continued growth
14Northeast Wattenberg: Prime Position Among Peers
Excellent position yet to be fully valued
Located between BCEI positions Niobrara Formation
Adjacent to NBL Wells Ranch East Pony/
BCEI Redtail
– Successful extended reach SYRG
laterals within 2 miles of
BBG position
NBL CRZO
Wells Ranch
Successful 40-acre spacing NBL
Loeffler Pad
Razor/Rohn
within 3 miles of BBG position
BCEI
PDCE
Continuation of geologic and Waste Mgt.
geophysical parameters across
position
BBG Acreage
10 miles
15Northeast Wattenberg – Driving Growth and Returns with XRLs
Extended Reach Lateral Program on Track
27 drilled and completed: 15 northern (all
Niobrara B), 12 southern blocks (5 Niobrara
B and 7 Niobrara C)
13 have reached peak production and are
on sales
( #1) 4-wells ~ 7,300’ laterals:
24-hour average IP: 770 Boe/d
30-day average IP: 548 Boe/d
60-day average IP: 447 Boe/d
(#2) 7 wells ~ 9,300’ laterals: 3 on sales*, 4
in flowback
(#3) 3 wells ~9,300’ laterals: all on sales
(#4) 7 wells ~9,300’ laterals: 3 on sales; 4
just completed
(#5) 4 wells ~ 9,300’ laterals in flowback
*Definition of sales includes wells that are producing hydrocarbons and initiated the 30-day IP period
16XRL Type Curve Performance
Peer wells prove type curve over two year time period
6 peer wells in close proximity continue to
follow 825 MBoe type curve (2-stream)
1,000
Average Daily Oil Production (BOPD)
100
10 Long Lateral Type Curve
(825 mboe)
1
0 30 60 90 120150180210240270300330360390420450480510540570600630660690720750780
Days On Production
Peer locations
17Northeast Wattenberg – Seeking Optimization
“Controlled” flowbacks on all XRLs
Downspacing test on four pads to mimic 40-acre spacing
Increased sand volumes on 4 wells to 12 mm lbs. v. 9 mm lbs.
Plug-and-perf completions on 5 wells v. sliding sleeve. Lower risk technique
Increased stimulation stages to 55 on 7 wells (~1/2 with increased sand)
One-third Increase in sand volume 25 v. 18 stages
Peer test: ~50% increase in EUR BBG test ~25% increase in EUR
18UINTA OIL PROGRAM
Uinta Oil Program
Large, Scalable Program: ~150,000 net acres
Wasatch, Green River Formations
East Bluebell: 23,675 net acres
Blacktail Ridge/Lake Canyon:
108,255* net acres
South Altamont: 20,200 net acres
Driving Steady Growth
Production: 6,800 Boe/d (3Q14)
2014 plan: ~15-20% of capital plan
with 51 gross/33 net operated wells
BBG Acreage Gas Production
10 Miles
2Q14 added 4,500 Bbl/d firm Oil Production
marketing agreement BBG Acreage
10 Miles
Proved reserves 53 MMBoe, up 10%
* Includes acreage to be earned.
20Uinta Basin: Well Positioned Among Peers
Wasatch, Green River Formations
DVN
EPE
CPG
CPG QEP
NFX
UPL
NFX
LINN
10 Miles BBG Acreage
21UOP: East Bluebell Execution
East Bluebell Program Offers Substantial Upside
36,895 gross/23,675 net acres Lower Green River
Development on 80-acre spacing with further
downspacing planned
Vertical wells targeting Lower Green River
formation
Early stage program, 20 wells drilled 2013
2014 Plans: Capture Value at East Bluebell
41 gross/27 net wells in 2014 plan
BBG Acreage
Production: 3,100 Boe/d (3Q14) 6 Miles
Drive capital efficiencies
Build out infrastructure
Continue delineation efforts
22UOP: East Bluebell Production Growth
East Bluebell Net Production and Gross Operated Wells Spud
4,000
3,100
3,000
Boe/d
2,000
1,435
1,000
0
3Q12 4Q12 1Q13 2Q13 3Q13 4Q13 1Q14 2Q14 3Q14
Operated
Wells spud 4 3 6 9 5 0 9 11 12
Increasing Activity and Growing Production
23Solid Foundation for Our Future
2014 accomplished what we set out to do
– Completed transition to oil development company with simplified two asset portfolio
– Increased Northeast Wattenberg position by 20%
– Strengthened balance sheet: cut net-debt in half, established ample liquidity
– Settled Cottonwood Gulch litigation with expected proceeds of $42mm
– Allocated capital to most profitable programs and increased operating profit margin ~40%
– Initiated extended reach lateral drilling program in DJ to maximize returns
– Upheld high standards for health, safety and environment
Exceptionally well positioned for 2015
– Fully hedged exit rate oil production, minimal sensitivity to oil prices
– Ample liquidity: $250 mm cash & undrawn revolver
– Nominal drilling commitments to hold acreage
– Flexibility in capital program
– Expect double digit pro forma production growth in 2015 from 2014 exit rate production
24APPENDIX
Natural Gas and Oil Hedges

As of December 5, 2014

Swaps
Period                          Oil                     Natural Gas

                     Volume           WTI Price     Volume      NWPL Price
                     (Bbls/d)          ($/Bbl)     (MMBtu/d)     ($MMBtu)

4Q14                     10,600           $93.88       19,158         $3.55

1Q15                     11,800           $90.46       20,000         $4.13

2Q15                     11,300           $90.39       20,000         $4.13

3Q15                     10,800           $89.81       20,000         $4.13

4Q15                     10,800           $89.81       20,000         $4.13

1Q16                      5,500           $87.61        5,000         $4.10

2Q16                      5,500           $87.61        5,000         $4.10

3Q16                      4,000           $87.24        5,000         $4.10

4Q16                      4,000           $87.24        5,000         $4.10

                                                                              26
Northeast Wattenberg – Driving Value Through Downspacing
5,280’
Actively evaluating four downspacing pilots
Two 9,300’ lateral B Bench wells
Two 9,300’ lateral C Bench wells staggered
beneath B Bench locations
All testing areas on Southern acreage block
Codell testing will follow
10,560’
B Chalk
C Chalk
Codell
Pilot Program Future Locations
Downspacing Pilot Location
27DJ Basin Operating Efficiencies
Average 4,000’ Lateral Drilling Average Drilling Cost per Foot
Days
18 17.1
$200
$173
11.8 $150
12
10.1
$108
$97
$100
6
$50
0
2012 2013 2014 YTD $0
2012 2013 2014 YTD
Standard reach lateral drill times improved by 15% year-over-year
Drilling cost per foot nearly cut in half since 2012
28DJ Basin: 20% Increase in Northeast Wattenberg Position
7,900 net acres acquired increasing NE Wattenberg 20% to 49,365 net acres
Southern Acreage Block Northeast Wattenberg
Post- Post-
YE2013 Transaction YE2013 Transaction
Gross Acreage 67,680 71,370
Net Acreage 21,100 29,000 40,500 49,365
Proved Reserves (MMBoe) (YE13) 17 19 56 58
Risked Resources (MMBoe) (YE13) 63 71 145 153
29DJ Basin Infrastructure
Existing local oil refining capacity and rail infrastructure >350mbbls/d
Capacity
Capacity Expansion Projects Timing
(MBbls/d)
Pony Express Pipeline 230 In Service
White Cliffs Expansion 75 In Service
Pony Express DJ Lateral 90 1Q15
Saddlehorn Pipeline Open Season 2016
Grand Mesa Pipeline Open Season 2016
Current gas processing capacity ~1.1 Bcf/d
2014 2015
Capacity Expansion Projects (MMcf/d)
Additions Additions
Anadarko 300 300
DCP Midstream 100 170
Front Range Pipeline brings NGLs access to Mt. Belvieu NGL market
NGL Pipelines Additions Capacity (MBbls/d) Timing
Front Range Pipeline 150 In Service
30DJ Basin Infrastructure – Expected Capacities
Cheyenne Crude
Terminal 52mbbls/d
Pony Express Conversion
In Service: 230-320mbbls/d
Pony Express NE CO Lateral
1Q15: 90mbbls/d
Suncor Refinery:
96MBbls/d White Cliffs Pipeline
In Service: 150mbbls/d
Plains Rail Facility:
2H14: 68mbbls/d
31East Bluebell Production Efficiencies
Average Drilling Days Average Drilling Cost per Foot
20.0 $200
18.1 $184
15.0 14.3 $150
$113
10.0
10.0 $100 $93
5.0 $50
0.0 $0
2012 2013 2014 YTD 2012 2013 2014 YTD
Operating efficiencies increasing; wells being drilled faster for less
Year-over-year 2014 average drilling days per well decreased 30%
Year-over-year 2014 average cost per foot decreased 20%
32Uinta Oil Program
Operator Current Black/Yellow Black/Yellow Capacity
Capacity (MBbls/d) Expansions (MBbls/d)
Chevron 15,000 ~5,000
Tesoro 15,000-20,000 ~20,000
Holly Frontier 10,000 14,000
Big West ~15,000 -
Silver Eagle 12,000 -
Total 65,000+ ~40,000
33Low-risk, Long-term Growth Profile – Year-end 2013
88% growth in proved reserves at three active oil programs
80% growth in risked resources at three active oil programs
~$350 million increase in Pretax PV10
$8.30/Boe 2013 F&D cost Year-end 2013
Proved +
Proved Risked Gross/Net
Proved Resources Drilling
Total Risked Resources (2013) Oil Gas/NGLs MMBoe MMBoe Locations
Denver Julesburg1
(oil/NGLs) 66 221 1,697/844
Uinta Oil
Program (oil) 53 171 1,795/785
Gibson Gulch,
Piceance (NGLs) 73 100 528/416
Powder River
Deep2 (oil) 5 95 1,370/284
0 100 200
MMBoe TOTAL 197 587 5,390/2,329
1DJ:Risked resources includes between 8-20 wells per section; majority based on standard length laterals
2Includes both 4,000 and 9,000 foot laterals and drilling locations spread over six different formations % OIL 42% 55%
Note: $3.67 per MMBtu HH and $96.91 per barrel WTI pricing used in reserve calculations
34UOP: Undeveloped Location Inventory
Risked Resources (171 MMBoe) 785 Net Drilling Locations
(Gross 1,795)
124
42
137
92
37 524
Blacktail Ridge/Lake Canyon Blacktail Ridge/Lake Canyon
East Bluebell East Bluebell
South Altamont South Altamont
80-acre and 160-acre spacing Positive testing enables potential to
Upside from downspacing respace
Plan to test EB 40-acre downspacing late
‘14/early ‘15
35DJ Basin Year-end 2013 Undeveloped Location Inventory
844 Net Undeveloped Locations
Total Gross: 1,697
94 130 Core Wattenberg
43
NE Wattenberg (North)
NE Wattenberg (South)
228 NE Wattenberg
349 (Western)
Chalk Bluffs
Based on standard length laterals, as of year-end 2013
Extensive inventory
Upside from down-spacing
Testing 40-acre spacing (4 wells per ¼ section) in 4 areas, to spud 2014
36Capital Program 100% Directed at Oil Growth
2014 Adjusted Guidance
Total capital of $560-$570 MM
2014 Capital % by Area
Total Production of 9.0 – 9.4 MMBoe
– Fourth quarter guidance 1.3 – 1.7 MMBoe
Uinta Oil
Program
Lease Operating Expense: $58-$62 million
Powder
River Deep
Gathering, transportation & processing: Program
DJ Basin
$36-$37 million
General and Administrative: $43-$45 million
37Land Summary
As of September 30, 2014
Average Gross Project Average BBG Working
Area Gross Acreage Net Acreage
NRI Interest
Active Oil Properties
Uinta Basin – Uinta Oil Program
Blacktail Ridge/Lake Canyon 126,710 58,160 82% 51%
Minimum to be earned 123,440 50,095 82% 51%
East Bluebell 36,895 23,675 83% 70%
Other 36,855 20,200 80-100% 70-90%
Total Uinta Oil Program 323,900 152,130
DJ Basin
Northeast Wattenberg 71,370 49,365 81% Varies
Wattenberg Core 16,300 12,405 84% 97%-100%
Chalk Bluffs 37,910 22,680 83% Varies
Other 3,860 3,000
Total DJ Basin Program 129,440 87,450
Powder Deep Oil Program 38,455 18,695 80% 10%-65%
Exploration & Other Properties
Piceance Basin – Cottonwood Gulch1 40,310 36,280 88% 90%
Paradox Basin – Yellow Jacket 297,280 208,215 83% 100%
Uinta Basin (Hornfrog, including to-be-earned) 30,585 16,820 85% 55%
DJ Basin – Sage Brush 27,065 11,305 83% 44%
Alberta Basin 86,990 59,040 83% 55%
Other 197,685 134,505 Varies Varies
Note: Ownership interest(s) include to-be-drilled locations and should be considered estimates as interests vary over time.
1 Subject to litigation
.
38Forward-Looking & Other Cautionary Statements
Reserve figures are presented as of December 31, 2013.
FORWARD-LOOKING STATEMENTS:
This presentation contains forward-looking statements. Forward-looking statements are dependent upon events, risks and uncertainties that may be outside the Company’s
control. Actual results could differ materially from those discussed in these forward-looking statements. In particular, the Company is providing updated “2014 Operating
Guidance,” which contains projections for certain 2014 operational and financial metrics. These and other forward-looking statements in this presentation are based on
management’s judgment as of the date of this presentation and include certain risks and uncertainties. Among a number of factors, operations plans are subject to change
during the year and such changes can materially affect projected results provided in the Company’s guidance. Please refer to the Company’s Annual Report on Form 10-K
for the year ended December 31, 2013 filed with the SEC, and other filings including our Current Reports on Form 8-K and Quarterly Reports on Form 10-Q, for a list of
certain risk factors that may affect these forward-looking statements.
Actual results may differ materially from Company projections and can be affected by a variety of factors outside the control of the Company including, among other things:
oil, NGL and natural gas price volatility, including regional price differentials; costs, availability and timing of build-out of third party facilities for gathering, processing,
refining and transportation; delays or other impediments to drilling and completing wells arising from political or judicial developments at the local, state or federal level,
including voter initiatives related to hydraulic fracturing; development drilling and testing results; the potential for production decline rates to be greater than expected;
regulatory delays, including seasonal or other wildlife restrictions on federal lands; exploration risks such as drilling unsuccessful wells; higher than expected costs and
expenses, including the availability and cost of services and materials; unexpected future capital expenditures; economic and competitive conditions; debt and equity
market conditions, including the availability and costs of financing to fund the Company’s operations; the ability to obtain industry partners to jointly explore certain
prospects, and the willingness and ability of those partners to meet capital obligations when requested; declines in the values of our oil and gas properties resulting in
impairments; changes in estimates of proved reserves; compliance with environmental and other regulations; derivative and hedging activities; risks associated with
operating in one major geographic area; the success of the Company’s risk management activities; title to properties; litigation; environmental liabilities; and, other factors
discussed in the Company’s reports filed with the SEC. Bill Barrett Corporation encourages readers to consider the risks and uncertainties associated with projections and
other forward-looking statements and to not place undue reliance on any such statements. In addition, the Company assumes no obligation to publicly revise or update any
forward-looking statements based on future events or circumstances.
NATURAL GAS LIQUIDS:
Effective January 1, 2013, the Company began reporting its production volumes on a three-stream basis, which separately reports NGLs extracted from the natural gas
stream and sold as a distinct product.
2013 year-end reserves are presented on a three-stream basis, and year-end 2012 reserves are recalculated to reflect three-stream volumes for comparability. NGL
volumes are converted to an oil equivalent based on 42 gallons per barrel and compared to overall gas equivalent production based on a 1 barrel to 6 Mcf ratio.
39Forward-Looking & Other Cautionary Statements
NON-GAAP MEASURES:
EBITDAX - is a non-GAAP financial measure. It is presented because management believes that it is useful to an investor for evaluating the Company’s operating
performance. This is a widely used measure by investors in the oil and gas industry to measure a company’s operating performance without regard to items excluded from
the calculation of such term, which can vary substantially from company to company depending upon accounting methods and book value of assets, capital structure and
the method by which assets were acquired, among other factors. There are significant limitations to using EBITDAX as a measure of performance, including the inability to
analyze the effect of certain recurring and non-recurring items that materially affect net income or loss, the lack of comparability of results of operations of different
companies and the different methods of calculating EBITDAX reported by different companies. The Company’s calculation of EBITDAX is discretionary cash flow plus cash
interest expense and cash tax expense added back.
RESERVE and RESOURCE DISCLOSURE -The SEC permits oil and gas companies to disclose proved, probable and possible reserves in their filings with the SEC. The
Company does not plan to include probable and possible reserve estimates in its filings with the SEC.
We may use certain terms, such as “risked resources,” that the SEC’s guidelines strictly prohibit us from including in filings with the SEC. The calculation of risked
resources, and any other estimates of reserves and resources that are not proved, probable or possible reserves are not necessarily calculated in accordance with SEC
guidelines. Our estimate of risked resources is not prepared or reviewed by third party engineers, is determined using strip pricing, which we use internally for planning and
budgeting purposes, and may differ from an un-risked estimate of proved, probable and possible reserves. The Company’s estimate of risked resources is provided in this
release because management believes it is useful, additional information that is widely used by the investment community in the valuation, comparison and analysis of
companies; however, the Company’s estimate of risked resources may not be comparable to similar metrics provided by other companies. Investors are urged to consider
closely the disclosure in our Annual Report on Form 10-K for the year ended December 31, 2013, available on the Company’s website at www.billbarrettcorp.com or from
the corporate offices at 1099 18th Street, Suite 2300, Denver, CO 80202. You can also obtain this form from the SEC by calling 1-800-SEC-0330 or at www.sec.gov.
FINDING AND DEVELOPMENT COST – Finding and development cost is a non-GAAP metric commonly used in the exploration and production industry. Calculations
presented by the Company are based on costs incurred, as adjusted by the Company, divided by reserve additions and are unaudited.
40You can also read