Half Year Results 2021 - Topps Tiles Plc
←
→
Page content transcription
If your browser does not render page correctly, please read the page content below
Half Year Results 2021
                         1
Agenda

 ▪ HY21 Highlights
   & Strategy –
   Rob Parker

 ▪ Financial Performance –
   Stephen Hopson

 ▪ Operations & Outlook –
   Rob Parker

                             2
HY21 Highlights
  & Strategy

   Rob Parker
Chief Executive Officer

                          3
HY21 in Summary

                                                             HY21 Performance Summary

                                                         Retail LFL sales            +2.0%
                                                         Sales                     £103.2m
                                                         Adj. Pre Tax Profit        £5.1m
                                                         Adj. EPS                    2.11p
                                                         Stat Pre Tax Profit        £4.0m
                                                         Adj Net Cash               £15.4m

          Customer          Retail visitors    Commercial Sales             Net Cash YoY
     Satisfaction 87.5%     c. 450k p/w          £4.1m, -10%                  +£32.7m

        Strong Q1, followed by a much more challenging Q2 due to CV19 restrictions
                                                                                             4
Retail Business Q1 vs Q2
  Q1 – Strong Performance                         Q2 – Covid Disruption
  ▪ Very strong sales performance with LFL        ▪ National lockdown from early January included
    growth of 19.9%                                 new restrictions on browsing tile showrooms
  ▪ Performance buoyed by continued home          ▪ Impact for Retail business was a counter service
    improvement boom and strategic progress         model for registered traders only, click & collect
                                                    for homeowners
  ▪ Record level of Group sales for the quarter
    at £62.5m, +14.5% YoY                         ▪ Homeowners increasingly switched into digital –
                                                    web traffic +46% YoY, sales 135%+ YoY
  ▪ Gross margin of 59.1% - within range of
    guidance                                      ▪ Samples key for customers – significant increase
                                                    in demand through web site
  ▪ Adjusted pre tax profit of £6.1m (excluding
    Govt support)                                 ▪ Stores remain key – c.85% of sales fulfilled
                                                    through the store during restrictions (incl Click &
  ▪ M2 growth +19% YoY, growing ahead of
                                                    Collect)
    sales
                                                  ▪ Following initial drop of c.25% LFL, sales steadily
  ▪ Digital strength - web traffic +39%, sales
                                                    improved over the period, net impact -17.3% LFL
    +70% YoY

                                                                                                          5
Current Trading - Retail
  • LFL growth on a 2 year basis has averaged 16.8% in the five weeks post lifting of restrictions
  • Gross margin is improving as business KPIs normalise – trade/retail mix, coverings/essentials mix
    and direct delivery costs
  • Order bay has also improved rapidly post re-opening – approximately doubling in the first three
    weeks post trading restrictions being lifted

                                                                            Current trading

                                                Trading        Trading
                                              Restrictions   Restrictions

                                                                                                        6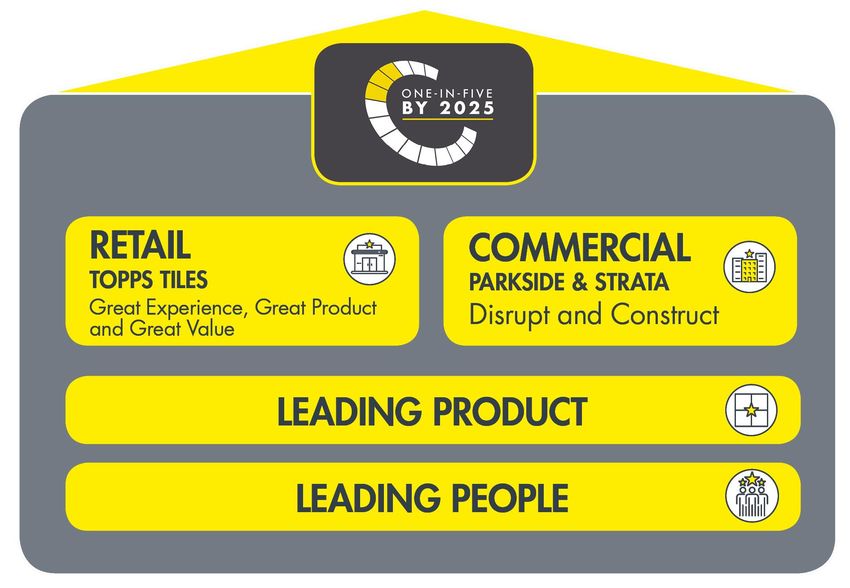
Goal & Strategy

                         Goal                                               Strategy

  ▪ Group goal of 1 in 5 by 2025 – 20% market share    ▪ Strategy focused on growth to take market share
    (17% today)                                        ▪ Core Group strengths of product and customer
  ▪ Applies to coverings, adhesive & grouts – c.£1bn     service leveraged through two trading businesses
    addressable market                                 ▪ Retail business is existing leader in domestic market,
  ▪ Need to outperform market by c.3.5% p.a.             with opportunities to grow further
  ▪ Equates to sales of c.£250m by 2025 - material     ▪ Commercial represents two brands, clear ambition to
    upside in Group profitability                        be #1 by 2025 (est. £25m of sales)
                                                                                                                  7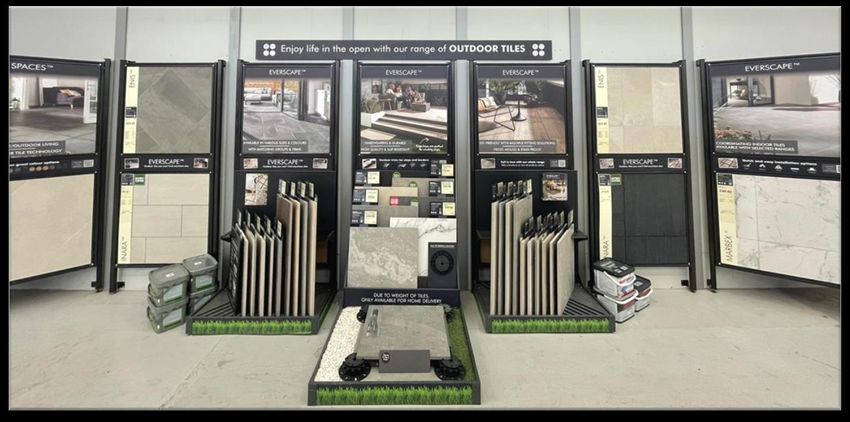
Strategic Progress

    Group

    ▪ Market share goal now embedded across                  ▪ Leading People - world class service needs great
      business – 1 in 5 by 2025 provides great focus           colleagues - engagement at 80%
    ▪ Leading Product – lead on innovation and               ▪ Environmental agenda growing in importance and
      leverage specialism and scale to drive long term         future source of competitive advantage
      value

    Retail                                                      Commercial
    ▪ Omni-channel strategy highly valued by                    ▪ CV19 related disruption continues to impact
      customers – physical presence remains                       market
      important                                                 ▪ H1 sales of £4.1m, down 10%
    ▪ Web site ranked in top 50 by RXUK (only tile              ▪ ONS ‘Private Commercial’ down 17.5% over H1
      specialist in top 350)
                                                                ▪ Sales from disrupted hospitality and leisure
    ▪ Market leading web traffic – est. 25% share                 sectors down 80% but 35% growth from other
    ▪ Stronger push into value – trade bulk deals, Get            sectors
      The Look For Less (GTLFL), retail essentials pricing      ▪ Strategic supply relationships key – unrivalled
      & promotions                                                access to product

                                                                                                                    8
Retail - Omni-channel Business Model
➢ c.45% of weekly
  visitors, flat yoy                            ➢ c.55% of weekly
                                                  visitors, up c.40%
   ➢ 331 stores                                           yoy
➢ c.40% of online                              ➢ #1 SEO rank on 16
 orders collected                                of 20 search terms
     from store
                                               ➢ 25% share of online
➢ 98% of total sales                              tile related traffic
   involve a store
                                               ➢ Pureplay accounts
                                                  for 30% of online
                                 c.450,000              sales
                                visitors per
   ➢ 65k Instagram                 week
       followers
     ➢ Instagram                                ➢ Dedicated UK
     engagement up                                 based call
        100% YoY                                     centre
     ➢ Facebook                                 ➢ 331 local store
   impressions up 100%                              teams for
           YoY                                      queries &
 ➢ Engaged audience                                  ordering
   of 600k on Pinterest
                                                                         9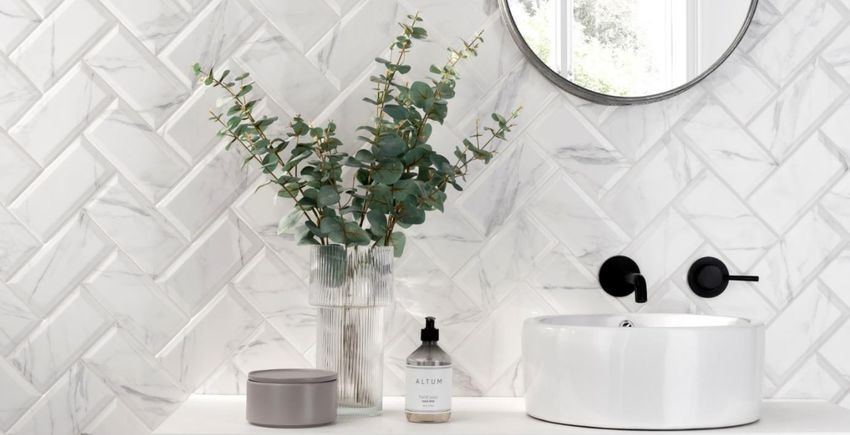
Financial
  Performance

Stephen Hopson
Chief Financial Officer

                          10
Income Statement Highlights - adjusted measures
26 weeks ended 27 March 2021
HY 21 HY 21
HY 20* YoY
(IFRS16) (IAS17)
Sales - £m 103.2 103.2 106.2 (2.8)%
Gross Profit - £m 59.5 59.5 62.8 (5.3)%
Gross Margin % 57.6% 57.6% 59.2% (1.6)ppts
Opex - £m 52.3 54.3 61.2 (14.5)%
Interest - £m 2.1 0.2 0.4 +425%
PBT - £m 5.1 5.0 1.2 +325%
Net Margin % 4.9% 1.1% +3.8ppts
EPS - pence 2.11p 0.60p +252%
▪ Retail LFL sales increase 2.0% : Q1 +19.9%, Q2 (17.3)%; Commercial sales £4.1m vs £4.5m in PY, down 10%
▪ Group gross margin decrease of 1.6 ppts. Retail and Commercial margins both down 1.6 ppts.
▪ Adjusted operating expenses reduce due to Government support through rates holiday (£4.4m), savings from
store closure programme (£2.3m) and cost reduction programme (£1.9m).
▪ BAU element of IFRS16 now included in adjusted metrics - impact immaterial at PBT level
▪ Adjusted PBT of £5.1m against £1.2m last year
Note - Adjusted measures exclude several items which are either one off in nature or fluctuate significantly from year to year (such as some property related items)
* Adjusted measures in FY2020 excluded the impact of IFRS16 11Gross Margin Performance
FY20 H1 21
▪ Quarter one gross margin in line with 59-60% guidance and flat to H1 20
▪ Quarter two significantly impacted by trading restrictions:
▪ Higher trade customer mix
▪ Higher ‘essentials’ mix
▪ More direct delivery costs
▪ Gross margins increasing following lifting of lock down towards previous guidance
12Adjusted Operating Expenditure Bridge
▪ Inflation of c. 0.5% with zero wage inflation in light of Covid response, regulatory cost increase of £0.2m from national living wage
▪ Employee profit share increases by £1.0m, particularly due to Q1 trading
▪ Leicester head office and warehouse now leased following freehold disposal in FY20
▪ Annualisation of cost reduction programme delivering a further £1.9m savings in the half year
▪ Average of 339 stores vs 360 in the prior year generating £2.3m reduction in costs
▪ Government support – business rates relief of £4.4m
▪ BAU element of IFRS16 now included in adjusted opex – new depreciation expense lower than previous lease expense (but
interest element is higher by a broadly offsetting amount)
13Adjusted Profit Before Tax Bridge
▪ Q1 was a record quarter for sales, with margins in line with guidance
▪ Q2 Retail LFLs down 17.3%, margins down 3.7 ppts vs Q1; positive comparison with previous lockdown
▪ Estimated impact of trading restrictions in Q2 £10.9m
▪ Government support in adj profit consists of business rates only
▪ Opex savings (pre IFRS16) from efficient management of retail store estate & annualisation of FY20 cost
reduction programme; offsets from employee profit share, HO lease and modest inflationary costs
▪ IFRS16 ‘business as usual’ now included in adjusted numbers – effect immaterial at PBT level 14Adjusted Net Cash and Liquidity (Pre-IFRS 16)
27 March 2021
▪ Net cash increase of £32.7m compared to a
year ago
▪ FY20 result included WC gain at year end
due to strong Q4 trading
▪ H1 WC movements include £13.7m swing in
payables from year end, £2.6m higher stock
and £2.1m in accruals and other items
▪ Capex includes LED lighting, two new
openings and store improvements
▪ WC expected to improve by year end as
trade normalises but remember 53rd week
(£7m outflow) and VAT repayment (£6m
Credit facilities outflow over period to March 22)
Facility Limit Expiry ▪ £54m of headroom to facilities with no debt
Revolving Credit Facility £39m July 2022
▪ No interim dividend, however expect to
Headroom to facilities at half year end of £54m reinstate dividends by end of year –
payment covering full year earnings
Note – Adjusted net cash / debt excludes lease liabilities under IFRS 16 15Operations
& Outlook
Rob Parker
Chief Executive Officer
16Group Strategy
17Leading Product
▪ Key source of competitive advantage – we are
experts in ranging and sourcing of tiles and
associated products
▪ Leveraging scale – 70% of group spend through
strategic supply partners
▪ 20 new ranges launched so far this year, over 40%
design-led by us in collaboration with partners
▪ Topps Group now holds over 200 registered marks
including Flute™ (pictured) launched in Q2 this
year
▪ Unrivalled and unique iterative cycle of change
maintained despite pandemic; including new
growth opportunities – Outdoor, anti-bacterial
tiles, Luxury Vinyl Tiles and increased value offer
across coverings and essentials
18Hero Range – Everscape™
▪ Porcelain 2cm tiles represent a significant growth opportunity
▪ Domestic consumer focus on home and outdoor living
spaces has been accelerated as a result of the pandemic
▪ Commercial sector see porcelain as attractive material
under new building regulations for non-combustible materials
▪ Porcelain outperforms traditional materials; increased safety,
durability, ease of installation, easy care and maintenance
▪ Topps group have made strong progress already with proven
sales rate since 2019 in Retail and Commercial
▪ Range doubled in Spring 21’ – we are at the
forefront of design and innovation including in-
house led developments and a market leading
essentials and accessories offer
▪ New range includes strong value offer at entry
level price point of just £25/m2.
19Leading People
▪ High levels of engagement are key to
delivering world class customer service – 80%
for FY20
▪ Strong well-being agenda – focus on – Mental
/ Financial / Physical / Social / Career health,
including Mental Health First Aiders and
Employee Assistance Programme
▪ Internal progression key - 43% of vacancies
filled internally (PY 35%)
▪ Improved colleague turnover YoY, store
manager turnover down to 12.8%
▪ Focus on D&I and gender within the
organisation. Female colleagues constitute
25.5% of the workforce, and 20% of managers
▪ Two new NEDs appointed to the Board – now
1/3 female composition
20Environment
▪ Environmental agenda now established
under Groupwide Sustainability Council
▪ ISO14001 - Commercial business is underway
with process of applying for accreditation
▪ LED lighting - 72 remaining stores to be
completed in H2 with the retro-fit of energy
efficient lighting. 1,400 tonnes of carbon
saving pa with c.£1m pa reduced running
costs
▪ World Land Trust - new strategic partnership
now agreed with WLT to assist with carbon
balancing
▪ New PrincipleTM range – launches in H2 – 98%
recycled material with industrialised
production – world first
New ‘PrincipleTM’ range
98% recycled material
21Retail
22Great Experience - Digital
▪ Web site rated in top 50 of UK Retailers by RXUK (only tile
specialist in top 350)
▪ Digital key for introduction and research – Topps traffic
accounts for c.25% of tile related search terms
▪ 250,000+ unique weekly visitors – market leading share,
growing at c.40%
▪ Free samples service online - demand trebled during Q2
lockdown
▪ Tile My Home – new augmented
reality functionality – popular with
both fitters and home owners
▪ Social media a key area of focus –
capability being expanded
23Great Experience – Stores
▪ Strong evidence that customers value omni-
channel capabilities - majority will visit at some
stage and c.85% use a store for collection (even
during lockdown)
▪ World class customer service difficult to replicate
online – infrequent purchase means homeowners
value friendly knowledgeable specialist advice –
87.5% OSAT rating
▪ Fitters value physical offer – representing >55% of
sales – loyalty driven through trade discounts,
rewards scheme, relationships advice and
convenience
▪ Store portfolio reducing modestly over time to
enhance returns – reducing by c.30 to an ongoing
estate of 300
▪ Flexibility in portfolio is a strength - average
unexpired lease term of 3.2 years
24Great Value
▪ ‘Value’ a greater area of focus for both
coverings and essentials
▪ Lower priced ranges (Commercial
26Commercial Strategic Rationale
▪ Commercial market is approximately the same
size as domestic - entry in 2017 doubled our
addressable market whilst maintaining our
specialism in tiles
▪ Strategy of ‘disrupt and construct’ with an
ambition to be #1– est. £25m of sales by 2025 –
key component of our 1 in 5 by 2025 goal
▪ Group specialism - supplier relationships and
scale are key sources of competitive advantage
▪ World class customer service – client relations vital
▪ Two brands with clear differentiation – Parkside –
focus on design led tile specifications (esp Leisure,
Hospitality & Housebuilding), Strata – technical tile
specialists (esp Retail & Transport)
▪ Participation provides insights into tile trends and
new technology through close relationships with
designers and architects
27Performance and Strategic Progress
▪ H1 sales of £4.1m, down 10% YoY
▪ Sales team focus re-orientated away from hospitality &
leisure sectors (was 40% of sales, currently 10%) – majority of
decline offset by c.35% growth in other sectors
▪ Hospitality & Leisure sales deferred not lost - our product still
specified
▪ Establishing reputation as reliable, friendly professionals
across industry – supported by our Leading People strategy
(key to future success)
▪ Scale operations established – 55 people – 30 in sales roles,
seven design studios – creative spaces to engage
architects and designers
▪ Environmental pull strong – we are well positioned to service
through our Leading Product strategy – increased focus on
green agenda
▪ Trading loss of £0.9m, H2 projected to reduce (subject to
continued recovery in forward indicators)
28Case Study - Next (Fosse Park, Leicester)
• Next Fosse Park - new flagship concept
• 17,000m2 of shopping space - a journey of experiences
through home interiors, fashion, books and travel
• Store design uses a range of porcelain floor tiles - creating
zones that help shoppers to understand direction store
flow
• Wood effect and concrete effect porcelain and Natural
Stone marble mosaics - a bespoke natural stone design
that’s exclusive to Next
Photo Credit © Alicia Clarke 29Case Study - Marriott Hotel, Kensington
• Inspired from the museums, architecture and culture of the
Kensington district
• Parkside worked with interior designer to help create a
range of themes – from an ultra modern reception area to
a classic mid century themed restaurant
• Tiles supplied for the reception area (check in desk, counter
and floor) include a large format terrazzo and 3D effect tiles
• Restaurant utilises custom mosaics and crochet patterned
tiles hand inspired by traditional hand-painted terracotta
tiles
30Summary and Outlook
▪ Summary
▪ H1 performance varied – Q1 very successful, Q2 dominated by Covid restrictions
▪ Growth strategy to deliver market share goal of ‘1 in 5 by 2025’
▪ Opportunities for further growth in Retail, supported by Commercial business with clear
ambition to be #1
▪ Business well capitalised with strong balance sheet - £15.4m net cash at half year
▪ Current trading and Outlook
▪ Retail trading post lockdown strong – 5 weeks are +16.8% on a 2 year LFL basis
▪ Outlook for domestic home improvement remains strong – business will benefit
▪ Commercial forward indicators improving – confident of improved performance over H2
▪ Intention to re-instate dividend based on full year earnings
31Q&A
32Appendix
33Market Data
October 20 to March 21 : +7.0% YoY
October 20 to March 21 : (17.5)% YoY
Sources: ONS ‘Output in the construction industry’ – volume seasonally adjusted data (2018 = 100); Nationwide House Price Index; National Statistics Monthly Property Transactions (residential); GfK Consumer Confidence Index 34Cash Flow Highlights (Pre-IFRS 16)
26 weeks ended 27 March 2021
HY 21 HY 20 YoY
£m £m £m £m £m £m
Cash flows generated by operations before WC 8.9 5.0 3.9
Change in working capital (18.4) (2.0) (16.4)
Interest (0.3) (0.5) 0.2
Tax - (1.0) 1.0
Operations (9.8) 1.5 (11.3)
Capital expenditure (2.5) (3.1) 0.6
Sale proceeds & other investments 1.7 - 1.7
Investments (0.8) (3.1) 2.3
Free cash flow (10.6) (1.6) (9.0)
Dividends - (4.5) 4.5
Increase/(reduction) in net cash (10.6) (6.1) (4.5)
▪ Free cash flow was a £10.6m outflow on a pre-IFRS 16 basis, with closing net cash of £15.4m
▪ Key drivers for the reduction in net cash were:
▪ £18.4m outflow of working capital with the following key movements : higher stock (£2.6m) from lower trading and excess
Brexit stock, high year end FY20 creditors from strong trading replaced by lower creditors from lower trading in lockdown
(£13.7m), £2.2m changes in accruals and other small items
▪ Reduced capital expenditure, no cash tax, no final dividend payment from the prior year
35Balance Sheet Highlights (Statutory – post IFRS 16)
27 March 2021
HY 2021 HY 2020 YoY HY 2021 (pre-IFRS 16)
Goodwill/Intangibles - £m 1.0 5.8 (4.8) 1.0
Freehold Property - £m 1.6 13.6 (12.0) 1.6
Fixed Assets - £m 23.7 31.9 (8.2) 23.9
Right-of-Use & Sublease Assets - £m 100.3 109.5* (9.2) -
Inventory - £m 32.0 30.6 +1.4 32.0
Receivables/Payables/Provisions - £m (41.1) (35.0) (6.1) (45.1)
Borrowings - £m - (39.0) +39.0 -
Lease Liabilities - £m (114.9) (118.7) +3.8 -
Cash - £m 15.4 21.7 (6.3) 15.4
Net Cash / (Debt) - £m (pre-IFRS 16) 15.4 (17.3) +32.7 15.4
Net Assets - £m 17.3 19.2 (1.9) 26.6
▪ Goodwill and intangibles reduction relates to the impairment of commercial assets (September 2020)
▪ The Group holds three freehold properties with a book value of £1.6m, having sold two properties during the half year (gross sale
price £1.7m)
▪ Fixed assets reduction relates to the warehouse and head office sale (completed FY20), as well as 28 fewer stores vs HY20 and
impairment due to closures
▪ Right-of-use & sublease assets of £100.3m, brought on balance sheet as a result of IFRS 16.
* HY2020 values restated as a result of the adoption of IFRS 16 and following the full year FY20 audit of the accounts.
▪ Inventory increased YoY with stock build in advance of Brexit being retained due to lower sales in Q2 as we worked under
lockdown trading conditions. Inventory days at 138 days (2020: 132)
▪ Lease liabilities of £114.9m brought on balance sheet from the implementation of IFRS 16
▪ Net cash position of £15.4m, a reduction of £10.6m from the year end position - an improvement of £32.7m YoY 36Statutory Income Statement
26 weeks ended 27 March 2021
HY 21 HY 20 YoY
Adjusted Profit before tax (£m) 5.1 1.2 3.9
Adjusting items (£m):
Property (1.8) (1.6) (0.2)
Furlough claims - to be repaid 1.0 - 1.0
IFRS 16 (HY 21: one off items only, HY 20 : total impact) (0.3) (2.8) 2.5
Profit before tax (£m) 4.0 (3.2) 7.2
▪ Adjusting items in FY21 consist of:
▪ Property related items including vacant property costs (£1.2m) and impairment of property assets (£0.6m)
▪ Furlough claims made in HY 21, to be repaid (£1.0m)
▪ IFRS16 impact for one off items (£0.3m) – with gain of £0.1m IFRS16 business as usual impact included in
adjusted profit from FY21 onwards
▪ HY20 IFRS16 Restatement - Statutory Profit before tax for the 26 weeks ended 28 March 2020 has been
restated to reduce the loss by £0.7m to £3.2m as a result of the adoption of IFRS 16 and following the audit of
the accounts for the 52 weeks ended 26 September 2020. These restated amounts have been included as
the comparator in the FY21 interim accounts. This restatement does not impact adjusted profit for HY20.
37You can also read