The 2016 Valentine's Day Mw 5.7 Christchurch earthquake: Preliminary report - NZSEE
←
→
Page content transcription
If your browser does not render page correctly, please read the page content below
The 2016 Valentine’s Day Mw 5.7 Christchurch
earthquake: Preliminary report
A. Kaiser, C. Holden, I. Hamling, S. Hreinsdottir, N.
Horspool, C. Massey, P. Villamor, D. Rhoades, B. Fry, E;
D’Anastasio, R. Benites, A. Christophersen, J. Ristau, W.
Ries, T. Goded, G. Archibald, C. Little & S. Bannister
2016 NZSEE
GNS Science, Lower Hutt. Conference
Q. Ma
University of Auckland, Auckland.
P. Denys & C. Pearson
University of Otago, Dunedin.
M.Giona-Bucci & P. Almond
Lincoln University, Lincoln.
S. Van Ballegooy & S. Wallace
Tonkin + Taylor Ltd
ABSTRACT: The Mw 5.7 Valentine’s Day earthquake struck just offshore from
Christchurch on February 14th February 2016, more than four years after the last major
earthquake of the Canterbury sequence (the Mw 5.9 on 23rd December 2011). This
moderate-sized earthquake caused further rockfall from known susceptible slopes in the
Port Hills and liquefaction in some parts of eastern Christchurch and Kaiapoi. Permanent
ground displacement as a result of fault movement measured up to 11 cm in the eastern
suburbs and recorded peak ground acceleration ranged up to 0.36 g. Response spectra
highlight that some buildings may have experienced ground shaking exceeding a
serviceability limit state event, and up to approximately 60% of an ultimate limit state
even, although significant damage is considered unlikely. Here, we present a summary of
the physical impacts, earthquake source models, ground motions and aftershock statistics
in the context of the ongoing Canterbury earthquake sequence.
1 INTRODUCTION
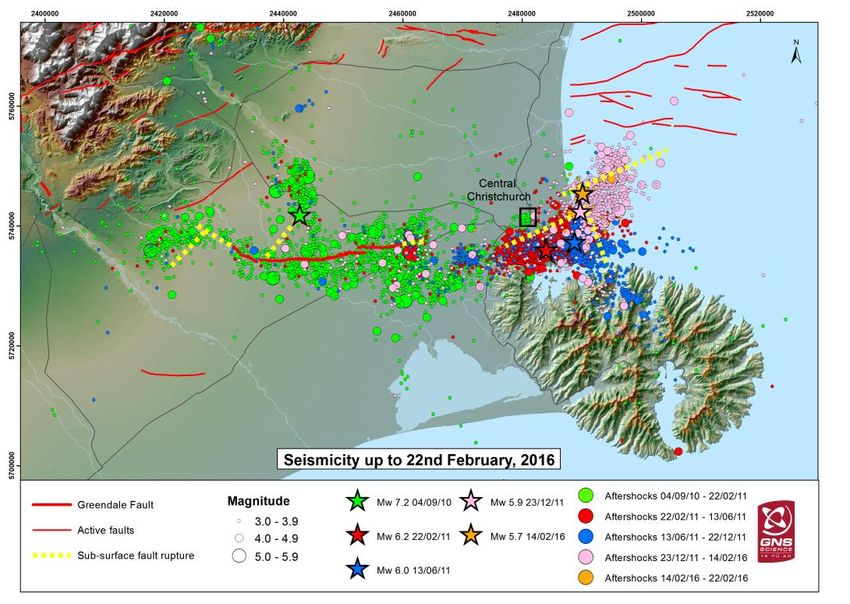
On February 14th 2016 a magnitude 5.7 earthquake struck just off the eastern shore of Christchurch
(Figure 1). This earthquake was the latest significant aftershock of the Canterbury earthquake
sequence, which began in 2010 with the Mw 7.1 Darfield Earthquake. The Christchurch region had
not experienced an earthquake of this magnitude or greater in over four years (i.e. since the Mw 5.9
earthquake on 23 December 2011). Prior to this event, GeoNet recorded the most recent aftershock
greater than magnitude 5 in May 2012. However, the probability of an earthquake of magnitude
greater than 5 within the Canterbury region for the next year was approximately 50% prior to this
event. While not as damaging as the four major earthquakes of the sequence in 2010 – 2011 (e.g.
Gledhill et al.; Kaiser et al.), this earthquake provides a timely reminder of the ongoing potential for
strong shaking in Canterbury. It also provides a useful opportunity to assess the impact of a moderate-
sized aftershock on the recovering city, given that the probability of another aftershock of magnitude 5
or greater occurring in the future is high (see discussion on GeoNet website:
http://info.geonet.org.nz/x/XIEO). We present initial observations compiled from a range of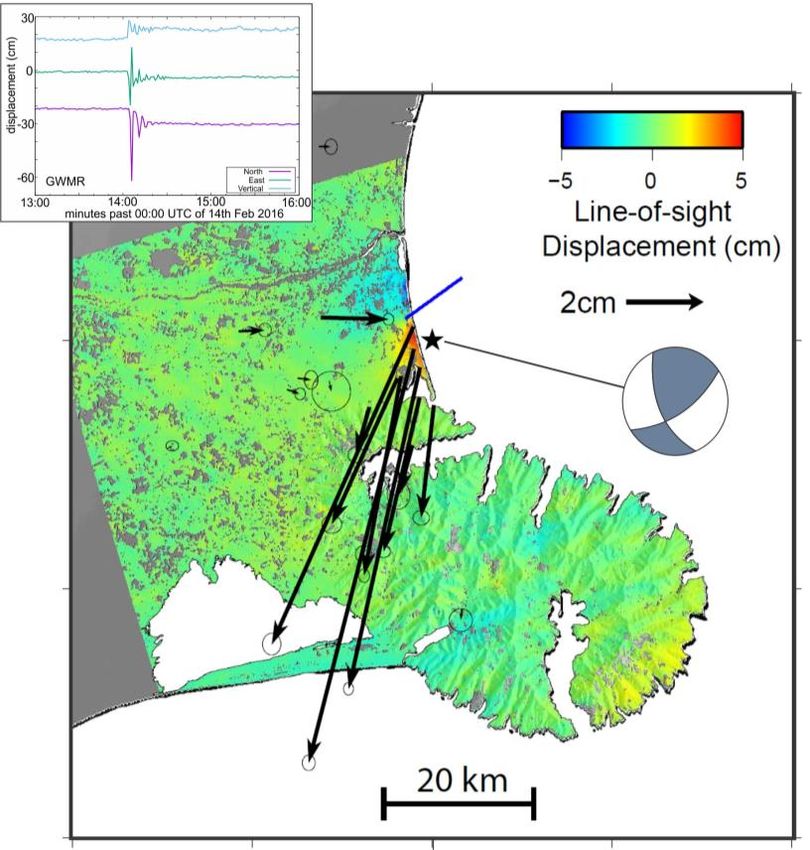
contributors summarising the physical impacts, earthquake source models, and ground motions, as
well as discussing the probability for future ground shaking in the region.

 Figure 1 - Location of the 2016 Valentine’s Day earthquake (orange star) in the context of the previous
                             events of the Canterbury earthquake sequence.

2 PHYSICAL IMPACTS

The earthquake initiated further rockfalls, cliff collapses and cliff top recession from susceptible
slopes in the Port Hills. Initial observations suggest that affected areas were contained within the
Canterbury Earthquake Recovery Authority’s official “red-zones” and the Christchurch City Council’s
hazard zones. Working with LINZ geotechnical engineers, the GeoNet landslide team re-surveyed the
main cliffs and re-mapped the cliff-top cracks in the Sumner area, to quantify cliff top cracking and
recession, and the volumes of debris that fell from the cliffs in response to the earthquake. These
surveys comprised terrestrial laser scanning (TLS) of the cliff faces and remote controlled aerial
footage of the inaccessible cliff edges (via UAV). Areas were also identified where blocks in the slope
have moved and not fallen, indicating the likelihood of further boulders falling off in the short-term.
At Whitewash Head (Figure 2) for example, new cracking, in response to the 14/02/2016 earthquake
was found to extend laterally across the cliff top, where homes had formerly been situated prior to
removal after “red-zoning”.
Based on our preliminary observations and measurements, the already damaged cliffs have been
further weakened by the earthquake-induced cracking and dilation of the rock masses caused by the
Valentine’s Day earthquake. Greater volumes fell from cliffs closer to the epicentre (i.e. Richmond
Hill Road and Whitewash Head) compared to those further away (i.e. Redcliffs and Shag Rock
Reserve). The volumes that fell from the cliffs in this earthquake are comparable to those volumes that
fell in previous earthquakes (post the destructive Mw 6.2 February 2011 earthquake), at similar levels
of peak ground acceleration. The volumes of debris falling from these cliffs are currently larger than
the long-term average volumes, estimated from the accumulation rate of debris at the cliff bottoms
prior to the 2010 Darfield mainshock. These data suggest a period of elevated rockfall and cliff
collapse hazard that could take many years to reduce to those levels that occurred before the 2010-
2011 Canterbury Earthquake sequence.

                                                   2
Figure 2 - Photograph of Whitewash Head taken on the 17/02/2016. Note the large crack in the cliff face.
Ground surface manifestations of liquefaction occurred in parts of the eastern suburbs of Christchurch
(Bexley, North New Brighton, Parklands, Spencerville and Brooklands) and as far north as Pines
Beach in the east of Kaiapoi township (Figure 3). The liquefaction manifestations were more localised
compared to those observed following the major events of the sequence in 2010 – 2011. This is
consistent with the fact that PGA in the affected areas was close to liquefaction triggering thresholds,
such that only the localised areas with the loosest soils liquefied. Only one minor instance of lateral
spreading was observed along the Avon River in North New Brighton. Liquefaction also occurred at
the time that the GNS Science-Lincoln paleoliquefaction team were analysing trenches opened across
the 2010-2011 liquefaction features at Pines Beach. Pines Beach had relatively extensive liquefaction
for a small event and at a distance of ~ 13 km from the epicentre compared with areas closer to the
source such as Brooklands, highlighting the fact it is a highly susceptible site. This can be attributed to
the presence of thick deposits of loose-to-medium dense non-plastic fine-grained sediments close to
the surface, and the very shallow water table (within 1 m of the surface). The 14 February liquefaction
features have helped understand the effects of liquefaction in the soil profile in coastal settings, which
will help identify similar prehistoric features elsewhere.

                                Figure 3 - Extent of observed liquefaction

                                                    3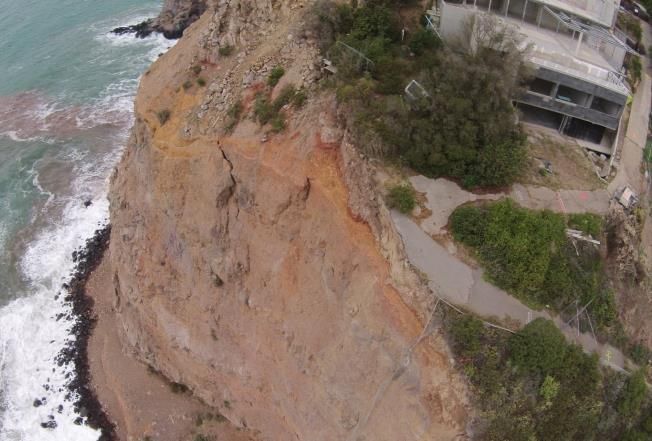
Preliminary GPS and InSAR observations (Figure 4) show that the ground onshore was permanently
displaced up to 11 cm in the horizontal direction and up to 6 cm in the vertical direction. Based on this
initial result there may be up to 6 cm of uplift in the New Brighton area with 1-2 cm of subsidence
towards Brooklands. The latest data indicate there is little significant change in the ground level of
flood prone areas around Aranui-Bexley. However, there may be local changes associated with
liquefaction or spreading which have not yet been assessed.

3 SOURCE MODELS

The Valentine’s Day earthquake focal mechanism (inset Figure 4) shows oblique-reverse dextral fault
motion. The faulting style and P-axis orientation of the mechanism is consistent with previous
mechanisms observed in Pegasus Bay during the Canterbury earthquake sequence (e.g. Ristau et al.
2013). Initial analysis of the spatial distribution of aftershocks does not clearly delineate the
orientation of the fault that ruptured. We also note, that variations in focal mechanism were observed
in the largest (Mw 4+) aftershocks.
Source modelling based on both geodetic displacements (measured by GPS and InSAR data) and
GeoNet strong motion data, favour the approximately East-West orientation of the fault plane, with
dip towards the south. Preliminary geodetic modelling suggests an approximately 8 km-long fault (see
the surface projection marked as blue line in Figure 4) with ~30 cm of slip. A preliminary model based
on strong motion data from 13 near-field stations is shown in Figure 5, suggesting a maximum slip of
nearly 1 m.

  Figure 4 - InSAR and GPS data showing ground displacement associated with the earthquake. Arrows
  indicate GPS measured displacements and colours indicate displacements measured from InSaR data.
The preliminary geodetic source model gives a best-fitting fault plane with surface projection indicated by
the blue line. The focal mechanism of the Valentine’s Day earthquake is shown to the right. Inset shows an
 example of data logged every second from permanent GPS station GWMR (2.5km NW of the epicentre).
   The site has been permanently displaced ~10 cm towards N, and ~4 cm towards E and up. However,
   during the earthquake, GWMR moved up to ~50 cm in the N-S plane and ~30 cm in the E-W plane,
                                    before reaching its final position.

                                                    4
Figure 5 - Preliminary source model based on strong motion data. Top left: Map view of fault slip and
  GeoNet strong motion stations (red diamonds); the yellow star is the GeoNet hypocentre. Bottom left:
 View of fault plane model looking north with slip indicated by colour scale (in metres). Right: Observed
(black line) and synthetic (red line) velocity seismograms filtered 0.1-1Hz and computed for the slip model
 described below; the duration is 50 seconds. Values above the traces are the maximum observed absolute
   velocities (m/s). The results favour an East-West fault plane (approximately: strike 54°, dip 65°, rake
 120°). The modelled rupture starts at a depth of 15 km and propagates up to 4 km, with a maximum slip
                      of nearly 1 meter. The estimated moment value is 7.9x10**17Nm.

4 GROUND MOTIONS

New Zealand Modified Mercalli Intensity (Dowrick 1996) was approximately MM5 for much of
Christchurch, but ranged up to MM8 for isolated suburbs, e.g. Scarborough and Phillipstown. These
MMI values were extracted from a community intensity map based on GeoNet felt reports and derived
following the method of Sbarra et al. (2010). The maximum recorded Peak Ground Acceleration
(PGA) reached 0.36 g in the vertical direction at New Brighton (station NBLC) and 0.29 g in the
horizontal direction at station PRPC in eastern Christchurch. The maximum recorded PGA was
significantly lower than that recorded during the February and June 2011 earthquakes (over 2 g) and
somewhat lower than that recorded during the Mw5.9 December 23rd 2011 earthquake (0.7 g
horizontal).
PGA (horizontal) has also been estimated for the entire Christchurch region using ShakeMap in Figure
6. The ShakeMap software, developed by the USGS (Wald, 1999, Worden, 2012), and calibrated for
New Zealand (Horspool, 2015) is used as the basis for estimating ground motion intensity at each
location. ShakeMap combines observed ground motions recorded at strong motion stations with
ground motion prediction equations (GMPE) to estimate ground motions across a region. ShakeMap
provides estimates of peak ground acceleration (PGA), spectral acceleration at 0.3s, 1.0s and 3.0s,
peak ground velocity (PGV) and MMI intensity as well as corresponding uncertainties. Near strong
motion stations the uncertainty will approach zero, and will reach the uncertainty of the GMPE away
from the stations. The ShakeMap for the Valentine’s Day earthquake estimates PGA in excess of 0.15
for eastern Christchurch and as far north along the eastern shoreline as Kaiapoi.

                                                    5
Figure 6 - Map of estimated horizontal PGA during the Valentine’s Day earthquake. Triangles represent
the locations of GeoNet strong motion stations and are coloured according to actual observed recordings.
Response spectra calculated from strong motion recordings from the Valentine’s Day aftershock
highlighted that some buildings may have experienced ground shaking exceeding a serviceability limit
state event, and up to approximately 60% of an ultimate limit state event. These are likely to be stiff
structures situated towards the east of Christchurch or near the foothills with structural period of less
than 0.5 second. An important feature to note is that the ground motion history is relatively short
duration (≈ 5 second) and thus significant damage is unlikely. Figure 7 presents a number of the
response spectra compared to the ultimate limit state design spectrum for site class D condition. More
comparisons are available at the NZSEE website (Link: http://www.nzsee.org.nz/information-and-
data-on-valentines-day-earthquake/).
The authors note that a more accurate building-specific comparison requires knowledge of i) the
ground condition, ii) specific building period, and iii) the age of design and construction. A number of
strong motion stations (e.g. NBLC – New Brighton Library, HPSC - Hulverstone Drive Pumping
Station) close to the epicentre also showed amplification of long period motion consistent with
significant site effects and possible liquefaction.

5 AFTERSHOCK STATISTICS

In the three weeks following the Valentine’s Day earthquake, aftershocks ranged up to magnitude 4.5,
with four aftershocks of magnitude greater than 4 recorded in the vicinity of the earthquake. The
earthquake increased the short-term probability of further earthquakes greater than magnitude 5 in the
Canterbury region (see discussion of the latest earthquake probabilities on the GeoNet website
(http://info.geonet.org.nz/x/XIEO). However, Figure 8 demonstrates that the Valentine’s Day
earthquake has only a small effect on the expected annual rates of such earthquakes in the context of
the Canterbury sequence as a whole. The annual probability of further MM7 ground shaking (i.e.
similar to the maximum experienced during the Valentine’s Day earthquake) calculated in the week
following the event ranged up to approximately 50% in parts of Christchurch and was highest in the
eastern and central suburbs.

                                                   6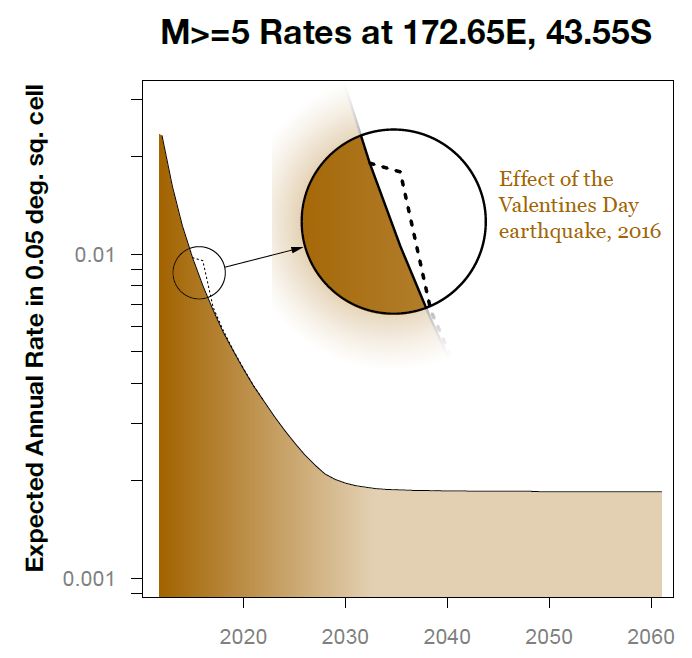
5% Damped elastic acceleration response spectra
                                           0.9

                                                                                                               Thick blue line represents Design
                                           0.8
                                                                                                               Spectrum from NZS1170.5
                                                                                                               Site Class D, Z=0.3 R=1 Sp=1

                                           0.7                                                                 Dotted black line represents 33%
                                                                                                               of the thick blue line (i.e. 33% code)

                                           0.6
               Spectral Acceleration (g)

                                           0.5

                                           0.4

                                           0.3

                                           0.2

                                           0.1

                                            0
                                                 0               0.5          1               1.5               2                 2.5                   3
                                                                                           Period (s)
                                                     DALS-N00E         OPW S-N00E           DHSS-N00E               MORS-N00E             GOVS-N00E
                                                     DALS-N90W         OPW S-N90W           DHSS-N90W               MORS-N90W             GOVS-N90W
                                                     GODS-N00E         SUMS-N00E            LCQC-N00E               SACS-N00E
                                                     GODS-N90W         SUMS-N90W            LCQC-N90W               SACS-N90W

Figure 7 - Response spectral accelerations calculated at a selection of GeoNet stations compared to design
spectra in Christchurch. Note, that locations closest to the epicentre (NBLC and HPSC) not included here
                                show higher levels of long period motion.

    Figure 8 - Effect of the Valentine’s Day earthquake on the expected annual rate of magnitude > 5
              earthquakes within a given ~5km-by-5km area in the centre of Christchurch.

                                                                                             7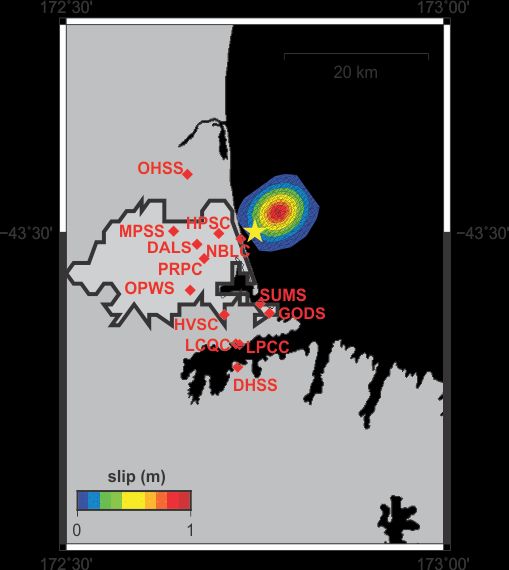
6 CONCLUSIONS

We present a preliminary report on the 14th February 2011 Valentine’s Day earthquake that struck a
few kilometres offshore from eastern Christchurch. Physical impacts of this moderate-sized
earthquake included rockfall from susceptible cliffs, localised liquefaction in parts of eastern
Christchurch and Kaiapoi, and permanent ground displacement up to 11 cm in parts of the eastern
suburbs. Preliminary source models based on geodetic and strong motion data suggest oblique-reverse
slip of up to 1m or less on an ~8km-long fault plane oriented approximately ENE-WSW. Peak ground
accelerations are estimated to have exceeded 0.15 g in the eastern suburbs of Christchurch, with the
highest PGA of 0.36 g recorded in the vertical direction at New Brighton. Response spectra highlight
that some buildings may have experienced ground shaking exceeding a serviceability limit state event,
and up to approximately 60% of an ultimate limit state even, although significant damage is
considered unlikely. This earthquake was an aftershock of the ongoing Canterbury earthquake
sequence. Although the Valentine’s Day earthquake increased the probability of earthquakes in the
region in the short-term, the effect on expected annual rates of earthquakes greater than magnitude 5
was small in the context of the Canterbury sequence as a whole.

7 ACKNOWLEDGEMENTS

We acknowledge the New Zealand GeoNet project and its sponsors EQC, GNS Science and LINZ,
who provided essential data and support for this preliminary report. The GPS data in Figure 3 is
derived from projects involving GeoNet, GNS Science, LINZ, University of Otago, Global Survey,
GeoSystems and Eliot Sinclair. We are very grateful to Paula Gentle (LINZ) for her efforts in
obtaining the GPS data. We also thank Neville Palmer for conducting GPS fieldwork. We thank J.
Kupec, C. Mangos and C. Gibbons (Aurecon NZ Ltd.) and Mark Yetton (Geotech Consulting Ltd.) for
their field observations and contribution to landslide assessment. Julian Thomson and Carol Smith
were part of the Pines Beach liquefaction field team. M. Jacka and J. Carter were part of the Tonkin +
Taylor liquefaction mapping effort. Silvia Canessa developed the Python code to obtain the
community MMI values quoted here. This paper presents a brief summary of many key aspects of the
earthquake science response, but many others have been involved in the overall response effort.

REFERENCES

Dowrick, D.J. (1996). The modified Mercalli earthquake intensity scale; revisions arising from recent studies of
  New Zealand earthquakes, Bulletin of the New Zealand National Society for Earthquake Engineering 29, 92–
  106.
Gledhill, K.R.; Ristau, J.; Reyners, M.E.; Fry, B.; Holden, C. 2011 The Darfield (Canterbury, New Zealand)
   Mw7.1 earthquake of September 2010 : a preliminary seismological report. Seismological Research Letters,
   82(3): 378-386; doi: 10.1785/gssrl.82.3.378
Horspool, N.; Chadwick, M.; Ristau, J.; Salichon, J; and Gerstenberger, M.C. 2015. ShakeMapNZ: Informing
   post-event decision making. Proceedings, 2015 Conference of the New Zealand Society for Earthquake
   Engineering, Rotorua, April, 2015.
Kaiser, A.E.; Holden, C.; Beavan, R.J.; Beetham, R.D.; Benites, R.A.; Celentano, A.; Collet, D.; Cousins, W.J.;
   Cubrinovski, M.; Dellow, G.D.; Denys, P.; Fielding, E.; Fry, B.; Gerstenberger, M.C.; Langridge, R.M.;
   Massey, C.I.; Motagh, M.; Pondard, N.; McVerry, G.H.; Ristau, J.; Stirling, M.W.; Thomas, J.; Uma, S.R.;
   Zhao, J.X. 2012 The Mw 6.2 Christchurch Earthquake of February 2011 : preliminary report. New Zealand
   Journal of Geology and Geophysics, 55(1): 67-90; doi:10.1080/00288306.2011.641182
Sbarra, P., P. Tosi and V De Rubeis (2010). Web-based macroseismic survey in Italy: Method, validation and
   results, Natural Hazards 54, 563-581.
Wald, D.J., Quitoriano, V., Heaton, T. H., Kanamori, H., Scrivner C.W., and Worden B.C. 1999. TriNet
  "ShakeMaps": Rapid generation of peak ground-motion and intensity maps for earthquakes in southern
  California. Earthquake Spectra 15, 537-556.
Worden, C.B., Gerstenberger, M.C., Rhoades, D.A., and Wald, D.J. 2012. Probabilistic Relationships between
  Ground Motion Parameters and Modified Mercalli Intensity in California.

                                                       8
You can also read