HealthPrism State of Missouri COVID-19 Response Vaccine Distribution Analysis - Missouri Covid Vaccine
←
→
Page content transcription
If your browser does not render page correctly, please read the page content below

HealthPrism™
                                                       State of Missouri COVID-19 Response
                                                           Vaccine Distribution Analysis
                                                                  September 01, 2021

Copyright © 2021 Deloitte Development LLC. All rights reserved.
Deloitte Consulting LLP Trade Secret and Confidential.                                  HealthPrismTM | Focusing Resources & Protecting Lives.   1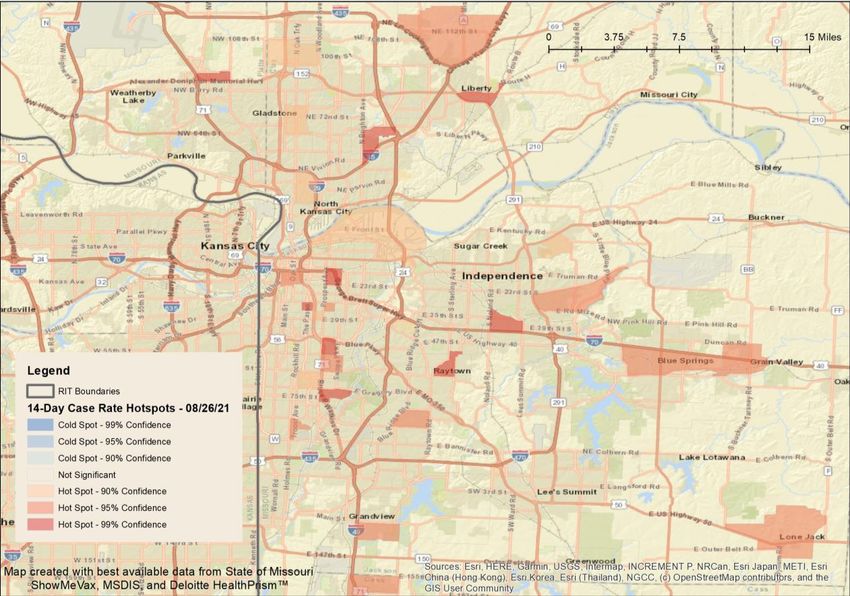
Table of Contents                                                                                                                                                         HealthPrism™
 This document includes COVID-19 data and analytics for the State of Missouri in support of their vaccine distribution process

 Follow the links below to view each section:

           Executive Summary [3]
           COVID-19 Case Rate Hotspots [4-5]
           Statewide Vaccination Progress (18+) [6-7]
           Statewide Vaccination Progress (12-17) [8-9]
           Regional Vaccination Rates Over Time [10]
           7-Day Statewide Vaccine Uptake (All Ages) [11-12]
           Regional Deep-dive: Region A [13-42]
           Appendix [43-47]

Copyright © 2021 Deloitte Development LLC. All rights reserved.
Deloitte Consulting LLP Trade Secret and Confidential.            For internal use only by State of Missouri. Output based on available data.   HealthPrismTM | Focusing Resources & Protecting Lives.   2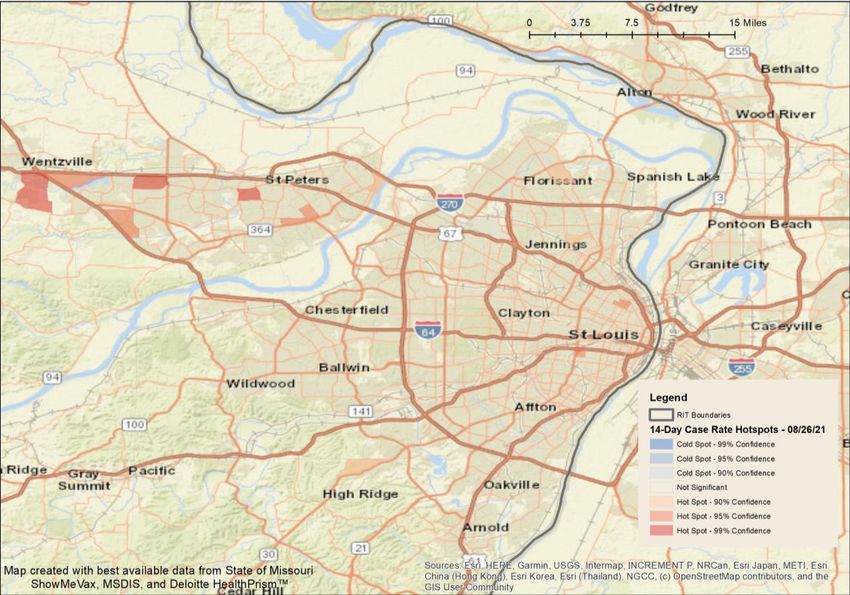
Executive Summary | Key Insights                                                                                                                                                                                     HealthPrism™

           S TAT E W I D E
             METRICS
                                                                                           2.3M                    -40k
                                                                                                                                                                                54%                  +0.8%

                                                                                                                                                                        18+ percent of eligible population
                                                                                18+ remaining unvaccinated of eligible
                                                                                                                                                                          that has initiated vaccination

                                                                 -     Case rate hotspots increased considerably in Region E – with 82% (14 of 17 hotspots) in proximity to I-55 and US-60
              COVID-19                                           -     Cape Girardeau, Mississippi, New Madrid, Scott, and Stoddard counties represent a small, but growing cluster of
             C A S E R AT E                                            increasing case rates and 9 case rate hotspots
             HOTSPOTS                                            -     Case rate hotspots persisted in Kansas City (16 within I-435) and St Louis (3 inside I-270), slightly higher than last week

                                                                 -     Vaccine initiations were close to the 10-week average of ~35k/week, but have slightly fallen for the 3rd straight week
                                                                 -     Regions C & F contained the largest percentage (74%) of vaccine uptake hotspots throughout the State – mainly in the
            VACCINE
                                                                       Census Tracts surrounding St. Louis and Columbia/Jefferson City
       U P TA K E T R E N D S
                                                                 -     Suburban and commuting regions surrounding Kansas City, Columbia/Jefferson City, and St. Louis led the State in number
                                                                       of 1st dose vaccinations

                                                                 -     Region A is the 3rd highest vaccinated, yet 127 of 340 (37%) Census Tracts in Region A have under 40% of their populations
                                                                       vaccinated
             REGION A
                                                                 -     Case rates have increased across Region A over the past 3 weeks, spreading along major transportation routes, connecting
             DEEP DIVE
                                                                       regional hubs in locations such as Warrensburg & Sedalia
                                                                 -     10 Census Tracts of focus were identified based on case rate, COVID-19 vulnerability, and vaccination rates

Note: Data on vaccinations include 1st round Moderna & Pfizer vaccinations and J&J vaccinations, are based on residence of the 18+ individual vaccinated (unless otherwise stated), and are from 8/27/2021. COVID-19 case rate data is a change analysis
of rates (cases per 100k) using data from 8/12/21 to 8/26/21.
Copyright © 2021 Deloitte Development LLC. All rights reserved.
Deloitte Consulting LLP Trade Secret and Confidential.                                        For internal use only by State of Missouri. Output based on available data.                 HealthPrismTM | Focusing Resources & Protecting Lives.     3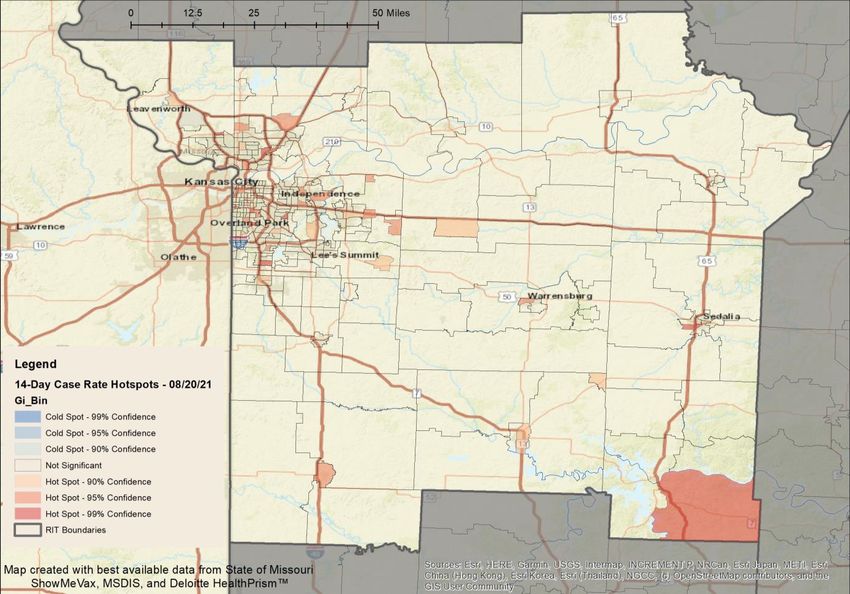
14-Day COVID-19 Case Rate Hotspots at the Census Tract Level                                                                                                                                                     HealthPrism™
 For the time period between 8/12/21 and 8/26/21, the change in COVID-19 case rate (per 100,000) is displayed on the left and case rate hotspots (areas with
 statistically significant changes in case rates in comparison to surrounding areas) are displayed on the right
                                           14-Day Case Rate Change                                                                                                14-Day Case Rate Hotspots

                                                   Regions A, E and F have experienced the highest increase of COVID-19 case rates for the past 3 weeks
                                  Case rate hotspots have considerably increased in Region E – with 82% (14 of 17 hotspots) in close proximity to I-55 and US-60
            Cape Girardeau, Mississippi, New Madrid, Scott, and Stoddard counties represent a small, but growing cluster of increasing case rates and 9 case rate hotspots
Note: Data normalized by population (per 100,000 residents) per Census Tract. COVID-19 case rate data provided by the State of Missouri as of 8/26/21. Previous 2-week change view provided in the Appendix, along with methodology, data sources,
and limitations.
Copyright © 2021 Deloitte Development LLC. All rights reserved.
Deloitte Consulting LLP Trade Secret and Confidential.                                      For internal use only by State of Missouri. Output based on available data.               HealthPrismTM | Focusing Resources & Protecting Lives.    4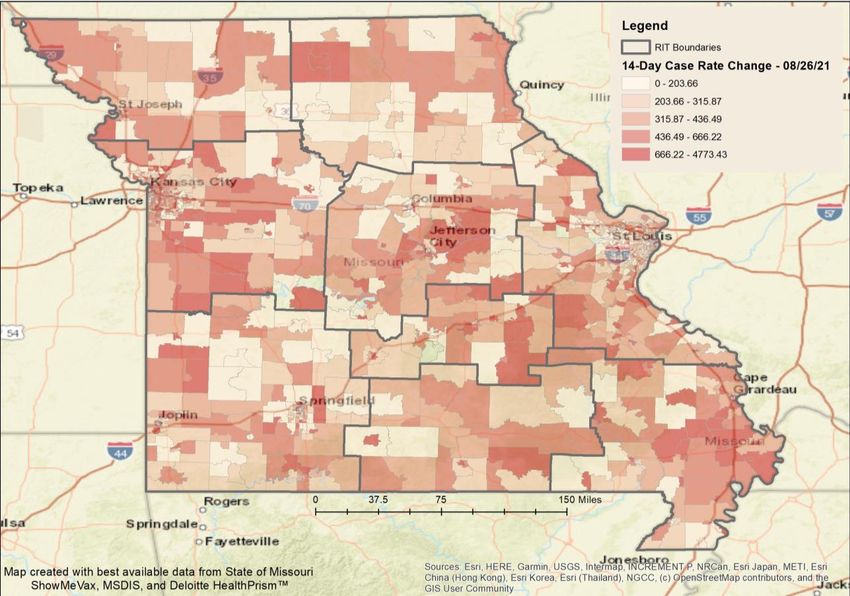
14-Day COVID-19 Case Rate Hotspots | Kansas City and St. Louis                                                                                                                                                   HealthPrism™
 For the time period between 8/12/21 and 8/26/21, case rate hotspots (areas with statistically significant changes in case rates in comparison to surrounding areas)
 are displayed on the left for Kansas City and on the right for St. Louis
                                                    Kansas City                                                                                                                  St. Louis

                                 Case rate hotspots persisted in the core of Kansas City (16 within I-435) and St Louis (3 inside I-270), slightly higher than last week
                              The communities of Wenztville and St. Peters (outside of St Louis) have experienced surges in case rate hotspots over the last 2 weeks
                  In Kansas City, 11 of the 16 case rate hotspots are within the vulnerable section of the SE I-435 corridor (according to the COVID-19 Vulnerability Index)
Note: Data normalized by population (per 100,000 residents) per Census Tract. COVID-19 case rate data provided by the State of Missouri as of 8/26/21. Previous 2-week change view provided in the Appendix, along with methodology, data sources,
and limitations.
Copyright © 2021 Deloitte Development LLC. All rights reserved.
Deloitte Consulting LLP Trade Secret and Confidential.                                      For internal use only by State of Missouri. Output based on available data.               HealthPrismTM | Focusing Resources & Protecting Lives.    5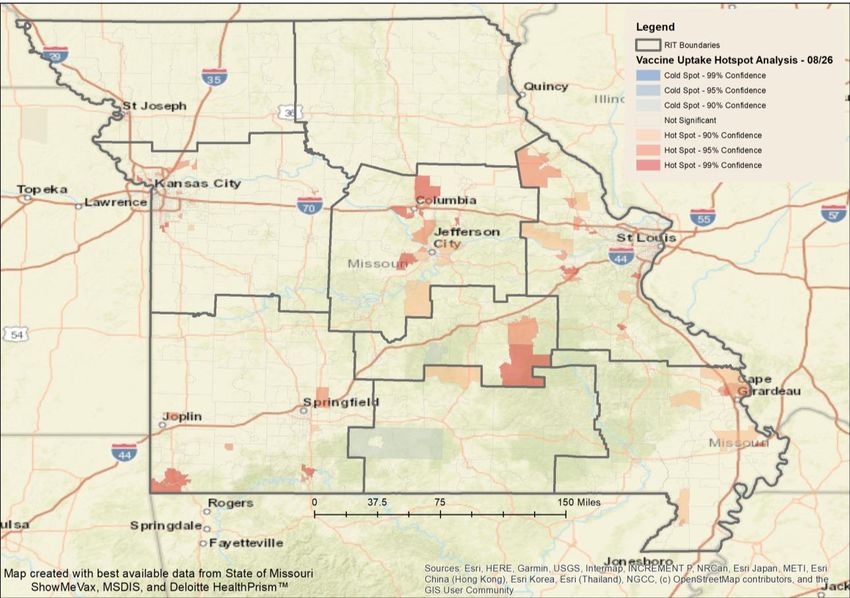
18+ Population | Remaining Unvaccinated                                                                                                                                                                             HealthPrism™
 Darker shades in the map on the left indicate Census Tracts with larger vaccination gaps, with regional drill downs for Kansas City and St. Louis provided on the right

                                                      V A C C I N AT I O N G A P ( # )
                                                                                                                                                     Kansas City

                                                H                            B

  Vaccination Gap
                                                    A                          F                  C                                                                                                          St. Louis
    Quintiles (#)
      0 – 940
      941 – 1,367
      1,368 – 1,851                                                                I
      1,852 – 2,437
      2,443 – 6,431

                                                    D                                                    E
                                                                                   G

                  Areas with the largest vaccination gaps continue to align with the more populated areas across Missouri – typically surrounding urban areas

Note: Data on vaccinations include 1st round Moderna & Pfizer vaccinations and J&J vaccinations, are based on residence of the 18+ individual vaccinated (unless otherwise stated) and are from 8/26/2021. Methodology, data sources, and limitations are
available in the Appendix. Full data set provided in corresponding Excel file.
Copyright © 2021 Deloitte Development LLC. All rights reserved.
Deloitte Consulting LLP Trade Secret and Confidential.                                        For internal use only by State of Missouri. Output based on available data.                 HealthPrismTM | Focusing Resources & Protecting Lives.    6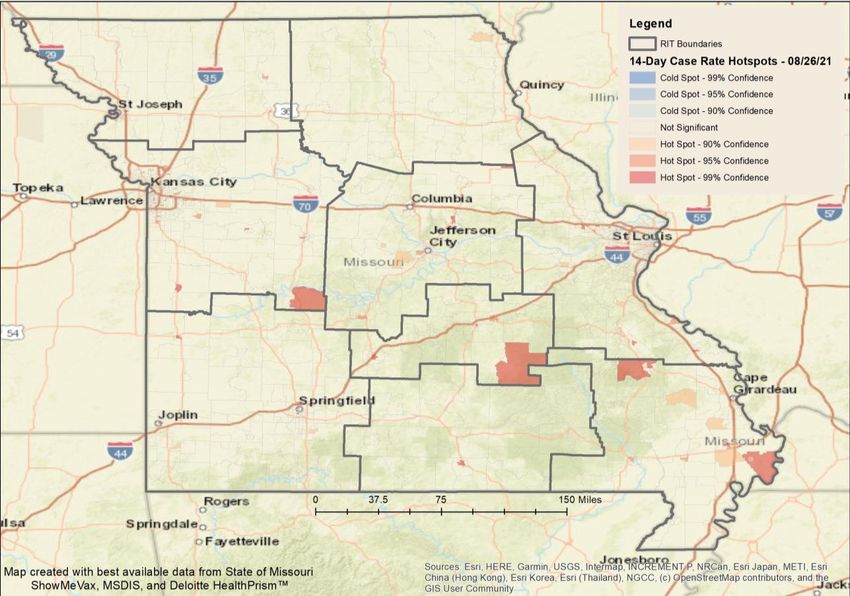
18+ Population | Percent Vaccinated                                                                                                                                                                                   HealthPrism™
 Darker shades on the map on the left indicate Census Tracts with higher percentages of residents who have initiated vaccination – with regional drill downs for
 Kansas City and St. Louis labeled to the right

                                                PERCENT WITH 1 DOSE (%)

                                                H                         B                                                                                                 4% (210K)
                                                                                                                                                                             Est. Amount of
                                                                                                                                                                         18+ Population that has
                                                                                                                                                                      Received Dose 1 but not Dose 2

                                                                                                                                                       Kansas City                                                   St. Louis
      Vaccinated                                    A                          F                   C
    Categories (%)
       0.0% - 29.9%
       30.0% - 39.9%
       40.0% - 49.9%                                                                I
       50.0% - 69.9%
       70.0%+ (Highest)

                                                     D                                                        E
                                                                                   G

                     Census Tracts with the highest percentages of unvaccinated populations are concentrated in more rural areas in Regions B, D, I, G, & E

Note: Data on vaccinations include 1st round Moderna & Pfizer vaccinations and J&J vaccinations, are based on residence of the 18+ individual vaccinated (unless otherwise stated) and are from 8/26/2021. Methodology, data sources, and limitations are
available in the Appendix. Full data set provided in corresponding Excel file. Estimate of population having received dose 1 but not dose 2 is calculated by taking the current second dose vaccinations and change in first dose vaccinations over 4 weeks
and dividing that total by the total first dose vaccinations.
Copyright © 2021 Deloitte Development LLC. All rights reserved.
Deloitte Consulting LLP Trade Secret and Confidential.                                           For internal use only by State of Missouri. Output based on available data.                 HealthPrismTM | Focusing Resources & Protecting Lives.      7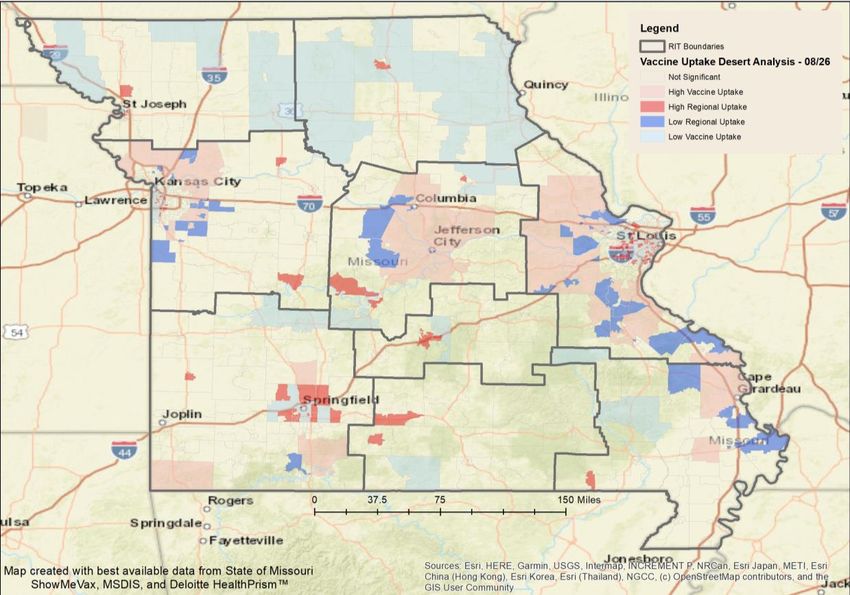
12-17 Population | Remaining Unvaccinated                                                                                                                                                                           HealthPrism™
 Darker shades on the map on the left indicate counties with larger vaccination gaps with regional drill downs for Kansas City and St. Louis labeled to the right

                                                     V A C C I N AT I O N G A P ( # )
                                                                                                                                                      Kansas City

                                               H                              B

  Vaccination Gap
                                               A                     F                       C
                                                                                                                                                                                                              St. Louis

    Quintiles (#)
      0 – 112
      113 – 172                                                               I
      173 – 240
      241 – 332
      333 – 803

                                                D                                                        E
                                                                             G

                   Similar trends persist for the 12-17 as with the 18+ population – more populated/urban areas have the largest number of unvaccinated
                                                        Region C continues to have the largest vaccination gap (91,760) for the 12-17 population

Note: Data on vaccinated individuals are based on 1st round Moderna & Pfizer vaccinations and J&J vaccinations, based on the residence of the individual vaccinated, and as of 8/26/2021. All vaccinations tagged to the “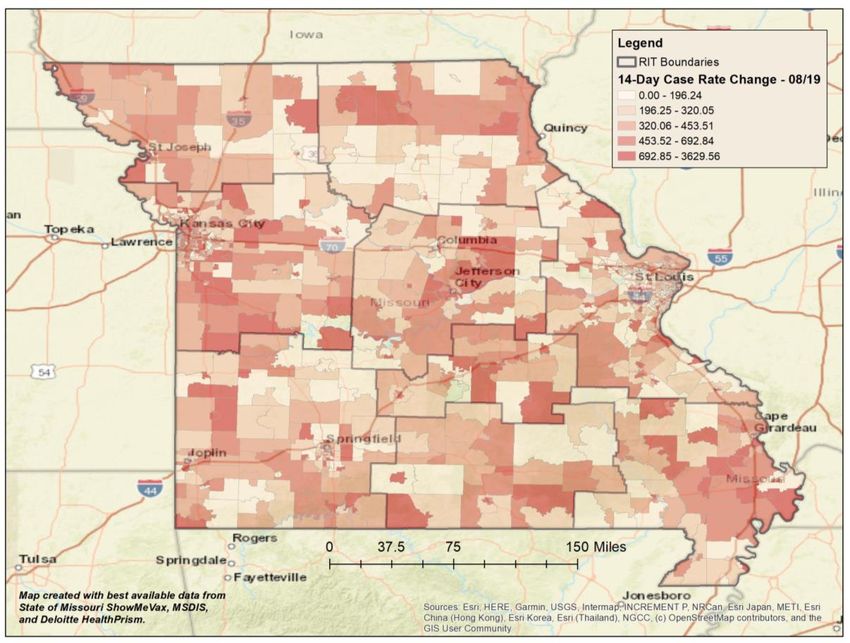
12-17 Population | Percent Vaccinated                                                                                                                                                                                  HealthPrism™
 Darker shades on the map on the left indicate counties with higher percentages of residents who have initiated vaccination – with regional drill downs for Kansas
 City and St. Louis labeled to the right

                                                PERCENT WITH 1 DOSE (%)

                                           H                          B                                                                                                        9% (41K)
                                                                                                                                                                               Est. Amount of
                                                                                                                                                                          12-17 Population that has
                                                                                                                                                                        Received Dose 1 but not Dose 2

                                                                                                                                                        Kansas City                                                    St. Louis
   Vaccinated                                   A                     F                        C
  Categories (%)
      0.0% - 29.9%
      30.0% - 39.9%
      40.0% - 49.9%                                                             I
      50.0% - 69.9%
      70.0%+ (Highest)

                                                D                                                          E
                                                                               G

                       The 12-17 cohort continues to lag behind 18+ – Region C has the highest percent vaccinated (47.3%) for this group, while Region G has the lowest (15.3%)
                                                                     Similar to the 18+ population – urban areas tend to have larger % vaccinated rates
Note: Data on vaccinated individuals are based on 1st round Moderna & Pfizer vaccinations and J&J vaccinations, based on the residence of the individual vaccinated, and as of 8/26/2021. All vaccinations tagged to the “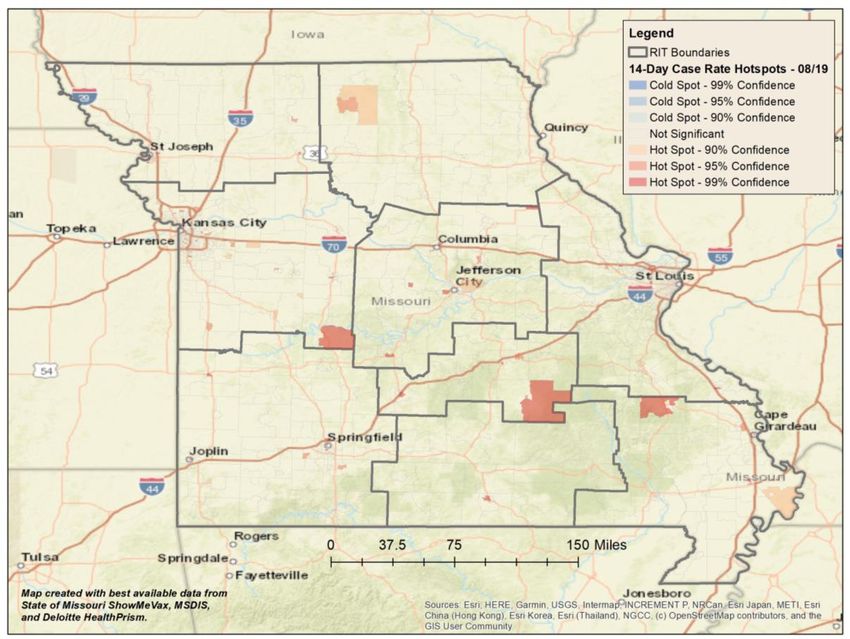
Regional Vaccination Rates Over Time                                                                                                                                                                                               HealthPrism™
 The visualization and table below display weekly and cumulative vaccination rates at the regional level. Week 33 (8/15 – 8/21) is the most recent complete week

                                                     5-Week Additional Percent of 18+ Population Vaccinated by Region

                                                                                                                                                                                                    Regional Vaccination Summary
                                                                                                                                                                                          18+                     12-17
   Additional Percent of 18+ Population Vaccinated

                                                                                                                                                                                                    18+ % Vax               12-17 % Vax
                                                                                                                                                                                       Cumulative               Cumulative
                                                                                                                                                                                                  Previous Week            Previous Week
                                                                                                                                                                                         % Vax                    % Vax
                                                                                                                                                                                            52.3%            0.7%               42.0%               1.9%

                                                                                                                                                                                            43.5%            0.5%               16.0%               0.9%

                                                                                                                                                                                            58.5%            0.6%              48.0%                1.8%

                                                                                                                                                                                            49.1%            0.6%               29.5%               1.6%

                                                                                                                                                                                            45.9%            1.0%               17.7%               2.1%

                                                                                                                                                                                            58.9%            0.7%               35.7%               2.0%

                                                                                                                                                                                            42.3%            0.7%              15.3%                1.2%

                                                                                                                                                                                            50.8%            0.6%               24.3%               1.3%

                                                                                                                                                                                            40.2%            0.7%               21.4%               1.8%
                                                                                                                                                                                    Bolded percentages indicate the highest and lowest cumulative % vaccinated

                                                                                       Calendar Week (MMWR)

                                                            Vaccine initiations fell in both the 18+ and 12-17 population for the 3rd straight week, but were close to the 10-week average of ~35k per week
                                                                                 12 counties vaccinated more than 1% of their 18+ population in Week 33, 7 of which are in Region E

Note: All weeks are calendar weeks, defined by SMV using MMWR week, where Week 33 is 8/15 – 8/21. Data on vaccinations include 1st round Moderna & Pfizer vaccinations and J&J vaccinations, are based on residence of the 18+ individual vaccinated,
and are from 8/26/2021. J&J vaccinations are coded as both dose 1 and dose 2. Methodology, data sources, and limitations are available in the Appendix.
Copyright © 2021 Deloitte Development LLC. All rights reserved.
Deloitte Consulting LLP Trade Secret and Confidential.                                                        For internal use only by State of Missouri. Output based on available data.               HealthPrismTM | Focusing Resources & Protecting Lives.   10
7-Day Vaccination Hotspots HealthPrism™
Vaccination uptake hotspots for 08/20 - 08/26 are displayed below in red. These vaccine uptake hotspots represent the communities that far exceeded the State
average for the dates indicated
Kansas City
St. Louis
Regions A, C & F contain the largest percentage (74%) of vaccine uptake hotspots throughout the State – mainly in the Census Tracts surrounding St. Louis, Kansas City and
Columbia/Jefferson City
Uptake hotspots continue to be linked to major transportation routes (I-44, I-70, I-35, I-55, US 54 and US 63)
Note: Data on vaccinated individuals is based on 1st round Moderna & Pfizer vaccinations and J&J vaccinations, includes all ages, and indicates the residence of the individual vaccinated, and is as of 8/26/2021. Methodology, data sources, and
limitations are available in the Appendix.
Copyright © 2021 Deloitte Development LLC. All rights reserved.
Deloitte Consulting LLP Trade Secret and Confidential. For internal use only by State of Missouri. Output based on available data. HealthPrismTM | Focusing Resources & Protecting Lives. 117-Day Vaccine Uptake Deserts HealthPrism™
Vaccination uptake deserts are displayed in shades of blue from 8/20 - 8/26, indicating Census Tracts where the weekly vaccine uptake is significantly lower than
State and/or regional averages – a more sensitive test of differences in community-level uptake in comparison to the hotspot analysis
Kansas City St. Louis
How to interpret these maps:
High Vaccine Uptake
Low Regional Uptake
Statistically significant clusters of high statewide
Statistical outlier – low initiation rates surrounded by high
initiation rates
High Regional Uptake Low Vaccine Uptake/Uptake Desert
Statistical outlier – high initiation rates surrounded by low Clusters of statistically low statewide initiation rates
Majority of vaccine uptake deserts (by area) exist in Regions B and H; majority of vaccine uptake deserts (by population) are in urban clusters (Kansas City, Springfield and St. Louis)
Suburban/exurban regions surrounding Kansas City, Columbia/Jefferson City, and St. Louis led the State in 1st dose vaccinations
Regional and State highs in vaccine initiations in St. Louis and Columbia/Jefferson City are often occurring in CTs at or near >70% vaccine uptake (1st dose)
Note: Data on vaccinated individuals is based on 1st round Moderna & Pfizer vaccinations and J&J vaccinations, includes all ages, and indicates the residence of the individual vaccinated, and is as of 8/26/2021. Methodology, data sources, and limitations
are available in the Appendix.
Copyright © 2021 Deloitte Development LLC. All rights reserved.
Deloitte Consulting LLP Trade Secret and Confidential. For internal use only by State of Missouri. Output based on available data. HealthPrismTM | Focusing Resources & Protecting Lives. 12Region A Deep-Dive
As presented on 8/27
Copyright © 2021 Deloitte Development LLC. All rights reserved.
Deloitte Consulting LLP Trade Secret and Confidential. For internal use only by State of Missouri. Output based on available data. HealthPrism™ | Focusing Resources & Protecting Lives. 13Executive Summary HealthPrism™
- Case rates have increased across Region A over the past 3 weeks
- Diffusion of elevated case rates indicate a spread along major transportation routes,
REGIONAL connecting regional hubs
& COUNTY - Hotspots outside of Kansas City emerge at central locations within counties or at
TRENDS transportation route junctions, such as Warrensburg & Sedalia
- Region A is the 3rd highest vaccinated, yet 127 of 340 (37%) Census Tracts in Region A have
under 40% of their populations vaccinated
- All 10 Census Tracts identified for Region A have a population that is less than 45% vaccinated
- Of the 10 Census Tracts identified, 9 are in the top 150 statewide of our COVID-19
TA R G E T
Vulnerability Index (CVI)
CENSUS
TRACTS - Within these Census Tracts, residents tend to be more racially diverse and religious, have
lower levels of income and educational attainment, and are less likely to have health
insurance than the average Missourian
Note: Data on vaccinations include 1st round Moderna & Pfizer vaccinations and J&J vaccinations, are based on residence of the 18+ individual vaccinated (unless otherwise stated), and are from 8/19/21. COVID-19 case rate data is a change analysis of
rates (cases per 100k) using data from 8/6/21 to 8/20/21. Methodology, data sources, and limitations are available in the Appendix. Full data set provided in corresponding Excel file.
Copyright © 2021 Deloitte Development LLC. All rights reserved.
Deloitte Consulting LLP Trade Secret and Confidential. For internal use only by State of Missouri. Output based on available data. HealthPrismTM | Focusing Resources & Protecting Lives. 14COVID-19 Case Rate Spread Over Time HealthPrism™
These visuals display the evolution of 14-day COVID-19 case rates over the past 4 full weeks (July 29th- Aug 19th) in Region A
• Over the past 3 weeks, case
rates have increased in Region A
o Case rates began at elevated
levels, decreased for the
period ending on 8/5, and
Legend: then rapidly increased
Case Rate o Case rates are elevated
Deciles across the Region as
compared to the time
ending 7/29
7/29 8/5 • Pattern of elevated case rates
indicate diffusion from regional
hubs (e.g. Marshall, Warrensburg,
Sedalia, Butler, Clinton)
I
o Spread along major
transportation routes
o Hubs of high case rates in
centers of activity and
interaction
• High levels of disease spread
across Region A and potentially
extending to neighboring
regions
8/12 8/19
Note: Data normalized by population (per 100,000 residents) per Census Tract. COVID-19 case rate data provided by the State of Missouri as of 08/20/21. See Appendix for methodology, data sources, and limitations. “Week” corresponds with MMWR.
Copyright © 2021 Deloitte Development LLC. All rights reserved.
Deloitte Consulting LLP Trade Secret and Confidential. For internal use only by State of Missouri. Output based on available data. HealthPrismTM | Focusing Resources & Protecting Lives. 15COVID-19 Case Rate Hotspots at the Census Tract Level HealthPrism™
The visual on the left depicts case rate hotspots – areas with statistically significant changes in case rates in comparison to surrounding areas – between August 6th
and August 20th
Kansas City
14-Day Case Rate Hotspots (8/6-8/20)
KEY OBSERVATIONS
• For the two-week period through August 20th, case rate
hotspots in Region A followed transportation routes
within and outside of Kansas City
• Hotspots outside of Kansas City emerge at central
locations within counties or at transportation route
junctions, such as Warrensburg
• Recent patterns of case spread in Missouri have reflected
a similar connection to transportation routes and
activity centers
Note: Data normalized by population (per 100,000 residents) per Census Tract. COVID-19 case rate data provided by the State of Missouri as of 08/20/21. See Appendix for methodology, data sources, and limitations.
Copyright © 2021 Deloitte Development LLC. All rights reserved.
Deloitte Consulting LLP Trade Secret and Confidential. For internal use only by State of Missouri. Output based on available data. HealthPrismTM | Focusing Resources & Protecting Lives. 16Cumulative Vaccination Status HealthPrism™
The visual and table below depict percent vaccinated and vaccination gap across Region A
Region A Percent Vaccinated (%)
Adult
Rank Census Tract County % Vaccinated
Population
Statewide Average 3,678 52.19%
Region A Average 3,475 52.33%
Key 1 29101980000 Johnson 1,205 14.85%
Vaccinated (%) | 340 CTs
2 29095989100 Bates 3,169 30.99%
0% – 29.9% | 89
30% - 39.9% | 38 3 29013070200 Johnson 3,917 31.45%
40.0% - 49.9% | 52
50.0% - 69.9% | 77 4 29095980101 Johnson 4,184 33.08%
70.0% - 99.9% | 84
5 29101960700 Johnson 4,523 33.12%
* Top 10 CTs by
Vaccination Gap (#) 6 29101960900 Jackson 2,362 34.17%
7 29101960200 Pettis 3,252 34.19%
8 29095009500 Henry 2,508 34.77%
9 29159480100 Jackson 3,459 35.13%
10 29083950100 Bates 2,407 35.31%
Four of the top 10 Census Tracts with the lowest percent vaccinated are in Johnson County
127 of 340 (37%) Census Tracts in Region A have under 40% of their populations vaccinated
Note: Data on vaccinated individuals are based on 1st round Moderna & Pfizer vaccinations and J&J vaccinations, based on the residence of the individual vaccinated, and as of 08/19/2021. Methodology, data sources, and limitations are available in the
Appendix.
Copyright © 2021 Deloitte Development LLC. All rights reserved.
Deloitte Consulting LLP Trade Secret and Confidential. For internal use only by State of Missouri. Output based on available data. HealthPrismTM | Focusing Resources & Protecting Lives. 17Vaccine Uptake Over Time HealthPrism™
Vaccine uptake deserts are shown in blue over a 4-week period, identifying Census Tracts where vaccine uptake for that time period was significantly lower than
State average
Region A Share of Vaccine Uptake Deserts
Missouri’s 18+ Initiations July 23rd - Aug 20th
25% Kansas City
Avg:
22.5%
16%
Jan Aug
2021 2021
How to
interpret these maps:
High Vaccine Uptake
Statistically significant clusters of high initiation
rates in comparison to State average
High Regional Vaccine Uptake
Statistical outlier – high initiation rates surrounded
by low
Low Regional Vaccine Uptake
Statistical outlier – low initiation rates surrounded
by high
Low Vaccine Uptake/Uptake Desert
Clusters of statistically low initiation rates in
comparison to State average
Region A is the 3rd highest vaccinated Region and typically represents between 20-25% of statewide 18+ weekly initiations
Vaccine uptake deserts cover most of the city proper (and most densely populated Census Tracts) within the Kansas City Metro
Northern and eastern suburbs/exurbs of Kansas City have shown the highest vaccine uptake in Region A, and regional highs have emerged in vulnerable urban communities
Note: Vaccine uptake desert analyses employ Local Moran’s I test for spatial autocorrelation. Data on vaccinations include 1 st round Moderna & Pfizer vaccinations and J&J vaccinations, are based on residence of the individual vaccinated (all ages),and
are from 8/19/2021. Methodology, data sources, and limitations are available in the Appendix. Full data set provided in corresponding Excel file.
Copyright © 2021 Deloitte Development LLC. All rights reserved.
Deloitte Consulting LLP Trade Secret and Confidential. For internal use only by State of Missouri. Output based on available data. HealthPrismTM | Focusing Resources & Protecting Lives. 18Target Census Tracts
Potential Areas to Focus Outreach Initiatives
Copyright © 2021 Deloitte Development LLC. All rights reserved.
Deloitte Consulting LLP Trade Secret and Confidential. For internal use only by State of Missouri. Output based on available data. HealthPrism™ | Focusing Resources & Protecting Lives. 19Potential Target Census Tracts in Region A HealthPrism™
The map below highlights Census Tracts that could be targeted for outreach within Region A
To identify target tracts in Region A, we analyzed
relationships between:
1 14-Day COVID-19 case rate burden/change
2 Percent of population unvaccinated
3 Ranking based on the COVID-19 Vulnerability Index (CVI)*
10
4
3 Using the above methodology, below are the top 10 Census
2
Tracts, which are discussed further in the following slides:
5
7 Rank Census Tract County
6
9 1 29095013203 Jackson
2 29095006000 Jackson
3 29095005602 Jackson All 10 Census
8 1 Tracts have an 18+
4 29095016500 Jackson
population that is
5 29095007900 Jackson
less than 45%
6 29095009000 Jackson vaccinated
7 29095008800 Jackson
8 29095013100 Jackson
9 29095009500 Jackson
10 29083950100 Henry
Note: Data on vaccinations include 1st round Moderna & Pfizer vaccinations and J&J vaccinations, are based on residence of the 18+ individual vaccinated (unless otherwise stated), and are from 8/19/21. COVID-19 case rate data is a change analysis of
rates (cases per 100k) using data from 8/6/21 to 8/20/21. Methodology, data sources, and limitations are available in the Appendix. Full data set provided in corresponding Excel file.
*CVI includes percent below 138% FPL, 1+ comorbidity, minority, cumulative case rate, and percent unvaccinated
Copyright © 2021 Deloitte Development LLC. All rights reserved.
Deloitte Consulting LLP Trade Secret and Confidential. For internal use only by State of Missouri. Output based on available data. HealthPrismTM | Focusing Resources & Protecting Lives. 20Three Steps To Take Action with this Data HealthPrism™
Demographic and behavioral characteristics of each area, coupled with local points of interest (POIs), can enable understanding of local nuances to conduct more
targeted outreach in a given community
1 2
What are the key Where are optimal
characteristics of this population? locations to conduct outreach?
✓ Review COVID-19 metrics ✓ Pinpoint areas of high and low density for both
vulnerable populations and sample Points of
✓ Develop a deeper understanding of the Census Interest
Tract’s demographic traits, values/preferences,
needs, and potential barriers to access ✓ Identify potential partners based on insights
from the key characteristics and the Points of
Interest list
Copyright © 2021 Deloitte Development LLC. All rights reserved.
Deloitte Consulting LLP Trade Secret and Confidential. For internal use only by State of Missouri. Output based on available data. HealthPrismTM | Focusing Resources & Protecting Lives. 21Three Steps To Take Action with this Data HealthPrism™
The following intend to leverage local knowledge in combination with the local characteristics and POIs to enable targeted interventions that boost vaccine uptake
3 What are general considerations for outreach?
P R E PA R AT I O N MESSAGING TA K I N G A C T I O N
Understand the population. Address concerns. Remove barriers.
Make space for open dialogue to grasp Work through fears and anxieties with Meet people where they are – mobile
local concerns. When possible, supplement empathy, providing factual information clinics at homes, schools, and places of
quantitative data about the community and being transparent on unknowns. work with weekend/evening hours.
with personal stories via listening sessions/ Listening and acknowledging concerns can Encourage local employers to offer paid
focus groups – ideally including local be especially effective when coming from time off and/or childcare to get the shot.
leaders. the right trusted messenger. Consider offering vaccination along with
other routine care or social services.
Co-create solutions. Keep it simple. Make specific plans.
Collaborate with target communities to Create materials that are easy to For people who intend to be vaccinated but
build action plans for their neighborhoods, understand/culturally inclusive yet haven’t, breaking down the goal can help.
highlighting the community’s involvement informative, especially for low literacy Support taking concrete steps like booking
– potentially resulting in higher buy-in and populations. Consider infographics with an appointment and ask for barriers they
more tailored solutions. images and icons to convey the most might encounter (e.g., transportation) and
important information. work through solutions.
Involve trusted messengers. Highlight personal stories.
Use local expertise and key population Leveraging the power of narrative over
characteristics to identify and involve statistics, share stories about people
community leaders, to build trust and get similar to the target community who have
involved in outreach. been vaccinated, highlighting how they
overcame their concerns/barriers and how
it has benefited them.
Copyright © 2021 Deloitte Development LLC. All rights reserved.
Deloitte Consulting LLP Trade Secret and Confidential. For internal use only by State of Missouri. Output based on available data. HealthPrismTM | Focusing Resources & Protecting Lives. 22Target Census Tract #1 | Key Characteristics HealthPrism™
95%+
Key Census Tract State Average
Note: Data on vaccinations include 1st round Moderna & Pfizer vaccinations and J&J vaccinations, are based on residence of the 18+ individual vaccinated (unless otherwise stated) and are from 8/19/2021. COVID-19 case rate data is a change analysis of rates (cases per 100k) using data from 8/6/21 to 8/20/21. Methodology, data sources,
and limitations are available in the Appendix. Full data set provided in corresponding Excel file. All census tract statistics have a margin-of-error associated with them.
Copyright © 2021 Deloitte Development LLC. All rights reserved.
Deloitte Consulting LLP Trade Secret and Confidential. For internal use only by State of Missouri. Output based on available data. HealthPrismTM | Focusing Resources & Protecting Lives. 23Target Census Tract #1 | Vulnerable Population and Points of Interest HealthPrism™
Census Tract: 29095013203
POINTS OF INTEREST
Sites for Outreach & Vaccination Events
Name Type Address
Ruskin Heights
Worship 11000 Ruskin Way
Presbyterian Church
Ruskin High School Schools 7000 E 111th Street
E. 112th Terrace &
Iser Park Community
Sycamore Ave
Ruskin Way Park Community E. 114th St. & Ruskin Way
Legend
Point of Interest (POI)
Vulnerable Population
(Low to high density)Target Census Tract #2 | Key Characteristics HealthPrism™ Key Census Tract State Average Note: Data on vaccinations include 1st round Moderna & Pfizer vaccinations and J&J vaccinations, are based on residence of the 18+ individual vaccinated (unless otherwise stated) and are from 8/19/2021. COVID-19 case rate data is a change analysis of rates (cases per 100k) using data from 8/6/21 to 8/20/21. Methodology, data sources, and limitations are available in the Appendix. Full data set provided in corresponding Excel file. All census tract statistics have a margin-of-error associated with them. Copyright © 2021 Deloitte Development LLC. All rights reserved. Deloitte Consulting LLP Trade Secret and Confidential. For internal use only by State of Missouri. Output based on available data. HealthPrismTM | Focusing Resources & Protecting Lives. 25
Target Census Tract #2 | Vulnerable Population and Points of Interest                                                                                                                 HealthPrism™

 Census Tract: 29095006000

                                                                                                                                                       POINTS OF INTEREST
                                                                                                                                                 Sites for Outreach & Vaccination Events
                                                                                                                                                Name                         Type                  Address

                                                                                                                                       Blue Valley Market                   Grocery         4300 Cleveland Ave

                                                                                                                                 Power of Faith AME Church                 Worship          4242 Cleveland Ave

                                                                                                                           St. Andrew United Methodist Church              Worship           4601 Benton Blvd

                                                                                                                            Greater Mount Zion Baptist Church              Worship          4600 Cleveland Ave

                                                                                                                            Community Mission Baptist Church               Worship            4309 Norton Ave

                                                                                                                                    M. L. King Elementary                   Schools       4848 Woodland Avenue

                                                                                                                                      Genesis School Inc.                   Schools            3800 E 44th St.

                                                                                                                                 Neighborhood Barber Shop                Barber/salon          4001 E 39th St
                                                                                                                                                                       Neighborhood/
                                                                                                                                Boys & Girls Clubs of America                                  3831 E 43rd St
                                                                                                                                                                        community

                                                                                                                                                                 Legend

                                                                                                                                                           Point of Interest (POI)

                                                                                                                                                           Vulnerable Population
                                                                                                                                                           (Low to high density)
Target Census Tract #3 | Key Characteristics HealthPrism™
95%+
Key Census Tract State Average
Note: Data on vaccinations include 1st round Moderna & Pfizer vaccinations and J&J vaccinations, are based on residence of the 18+ individual vaccinated (unless otherwise stated) and are from 8/19/2021. COVID-19 case rate data is a change analysis of rates (cases per 100k) using data from 8/6/21 to 8/20/21. Methodology, data sources,
and limitations are available in the Appendix. Full data set provided in corresponding Excel file. All census tract statistics have a margin-of-error associated with them.
Copyright © 2021 Deloitte Development LLC. All rights reserved.
Deloitte Consulting LLP Trade Secret and Confidential. For internal use only by State of Missouri. Output based on available data. HealthPrismTM | Focusing Resources & Protecting Lives. 27Target Census Tract #3 | Vulnerable Population and Points of Interest HealthPrism™
Census Tract: 29095005602
POINTS OF INTEREST
Sites for Outreach & Vaccination Events
Name Type Address
Indiana Market & Deli Grocery 3646 Indiana Ave
Cornerstone Missionary Baptist
Worship 2911 E 37th St
Church
Kajun Fried Chicken & Fish Restaurant 3631 Prospect Ave
Dayzy African Hair braiding Barber/salon 2908 E 39th St
Legend
Point of Interest (POI)
Vulnerable Population
(Low to high density)Target Census Tract #4 | Key Characteristics HealthPrism™ Key Census Tract State Average Note: Data on vaccinations include 1st round Moderna & Pfizer vaccinations and J&J vaccinations, are based on residence of the 18+ individual vaccinated (unless otherwise stated) and are from 8/19/2021. COVID-19 case rate data is a change analysis of rates (cases per 100k) using data from 8/6/21 to 8/20/21. Methodology, data sources, and limitations are available in the Appendix. Full data set provided in corresponding Excel file. All census tract statistics have a margin-of-error associated with them. Copyright © 2021 Deloitte Development LLC. All rights reserved. Deloitte Consulting LLP Trade Secret and Confidential. For internal use only by State of Missouri. Output based on available data. HealthPrismTM | Focusing Resources & Protecting Lives. 29
Target Census Tract #4 | Vulnerable Population and Points of Interest                                                                                                               HealthPrism™

 Census Tract: 29095016500
                                                                                                                                                       POINTS OF INTEREST
                                                                                                                                                 Sites for Outreach & Vaccination Events
                                                                                                                                                Name                          Type                 Address

                                                                                                                                Shiloh Missionary Baptist Church            Worship         3001 Cleveland Ave

                                                                                                                                      Church of God In Christ               Worship            2340 Bales Ave
                                                                                                                                         Gethsemane
                                                                                                                                                                            Worship             4123 E 27th St
                                                                                                                                   Non-Denominational Church
                                                                                                                                          New Hebron
                                                                                                                                                                            Worship        2702 Mersington Ave
                                                                                                                                    Missionary Baptist Church
                                                                                                                                    Progressive Baptist Church              Worship            2937 Bales Ave

                                                                                                                                  Cleveland Ave Baptist Church              Worship         2853 Cleveland Ave
                                                                                                                                           Holy Light
                                                                                                                                                                            Worship           2421 Indiana Ave
                                                                                                                                    Missionary Baptist Church
                                                                                                                                          Mount Carmel
                                                                                                                                                                            Worship         2747 Cleveland Ave
                                                                                                                                    Missionary Baptist Church
                                                                                                                                          Victory Outreach                  Worship           2720 Askew Ave

                                                                                                                                           Wright Temple                    Worship        2500 Mersington Ave

                                                                                                                                          Carol's Hair Salon             Barber/salon         2709 Norton Ave

                                                                                                                                                                  Legend

                                                                                                                                                             Point of Interest (POI)

                                                                                                                                                             Vulnerable Population
                                                                                                                                                             (Low to high density)
Target Census Tract #5 | Key Characteristics HealthPrism™ Key Census Tract State Average Note: Data on vaccinations include 1st round Moderna & Pfizer vaccinations and J&J vaccinations, are based on residence of the 18+ individual vaccinated (unless otherwise stated) and are from 8/19/2021. COVID-19 case rate data is a change analysis of rates (cases per 100k) using data from 8/6/21 to 8/20/21. Methodology, data sources, and limitations are available in the Appendix. Full data set provided in corresponding Excel file. All census tract statistics have a margin-of-error associated with them. Copyright © 2021 Deloitte Development LLC. All rights reserved. Deloitte Consulting LLP Trade Secret and Confidential. For internal use only by State of Missouri. Output based on available data. HealthPrismTM | Focusing Resources & Protecting Lives. 31
Target Census Tract #5 | Vulnerable Population and Points of Interest                                                                                                                  HealthPrism™

 Census Tract: 29095007900

                                                                                                                                                           POINTS OF INTEREST
                                                                                                                                                     Sites for Outreach & Vaccination Events

                                                                                                                                                    Name                         Type               Address

                                                                                                                                                St. Louis Church               Worship         5930 Swope Pkwy

                                                                                                                                     Faith Fellowship Baptist Church           Worship         5610 Jackson Ave

                                                                                                                                          Parkway Baptist Church               Worship           3810 E 56th St

                                                                                                                                     Swope Parkway United Christian
                                                                                                                                                                               Worship           3482 E 62nd St
                                                                                                                                                Church

                                                                                                                                     Greater Faith Missionary Baptist
                                                                                                                                                                               Worship         5743 Prospect Ave
                                                                                                                                                 Church

                                                                                                                                      Covenant Presbyterian Church             Worship         5931 Swope Pkwy

                                                                                                                                         Kansas City Public Library             Library        6242 Swope Pkwy

                                                                                                                                                                        Legend

                                                                                                                                                                   Point of Interest (POI)

                                                                                                                                                                   Vulnerable Population
                                                                                                                                                                   (Low to high density)
Target Census Tract #6 | Key Characteristics HealthPrism™ Key Census Tract State Average Note: Data on vaccinations include 1st round Moderna & Pfizer vaccinations and J&J vaccinations, are based on residence of the 18+ individual vaccinated (unless otherwise stated) and are from 8/19/2021. COVID-19 case rate data is a change analysis of rates (cases per 100k) using data from 8/6/21 to 8/20/21. Methodology, data sources, and limitations are available in the Appendix. Full data set provided in corresponding Excel file. All census tract statistics have a margin-of-error associated with them. Copyright © 2021 Deloitte Development LLC. All rights reserved. Deloitte Consulting LLP Trade Secret and Confidential. For internal use only by State of Missouri. Output based on available data. HealthPrismTM | Focusing Resources & Protecting Lives. 33
Target Census Tract #6 | Vulnerable Population and Points of Interest                                                                                                                 HealthPrism™

 Census Tract: 29095009000                                                                                                                              POINTS OF INTEREST
                                                                                                                                                  Sites for Outreach & Vaccination Events
                                                                                                                                                 Name                           Type                Address

                                                                                                                                            Thriftway Grocery                 Grocery         7320 Prospect Ave

                                                                                                                                                Muzammil                      Grocery          7501 Troost Ave

                                                                                                                                          Holy Martyrs Church                 Worship          7801 Paseo Blvd

                                                                                                                                       Fellowship Baptist Church              Worship         7106 Prospect Ave

                                                                                                                                         Love Unlimited Church                Worship         7410 Prospect Ave

                                                                                                                                          Grace Baptist Church                Worship          7203 Paseo Blvd
                                                                                                                                         Christian Tabernacle
                                                                                                                                                                              Worship          7405 Paseo Blvd
                                                                                                                                        Church of God In Christ
                                                                                                                                         Leenaj Barber Designs             Barber/salon       7520 Prospect Ave

                                                                                                                                         Curtis A's Barber Shop            Barber/salon        7237 Troost Ave

                                                                                                                                                Good Nail                  Barber/salon        7801 Troost Ave

                                                                                                                                          Blade's Barber Shop              Barber/salon        7237 Troost Ave
                                                                                                                                       Kansas City Missouri Fire
                                                                                                                                                                             Police/fire      7534 Prospect Ave
                                                                                                                                        Department Station 30
                                                                                                                                                                     Legend

                                                                                                                                                               Point of Interest (POI)

                                                                                                                                                               Vulnerable Population
                                                                                                                                                               (Low to high density)
Target Census Tract #7 | Key Characteristics HealthPrism™ Key Census Tract State Average Note: Data on vaccinations include 1st round Moderna & Pfizer vaccinations and J&J vaccinations, are based on residence of the 18+ individual vaccinated (unless otherwise stated) and are from 8/19/2021. COVID-19 case rate data is a change analysis of rates (cases per 100k) using data from 8/6/21 to 8/20/21. Methodology, data sources, and limitations are available in the Appendix. Full data set provided in corresponding Excel file. All census tract statistics have a margin-of-error associated with them. Copyright © 2021 Deloitte Development LLC. All rights reserved. Deloitte Consulting LLP Trade Secret and Confidential. For internal use only by State of Missouri. Output based on available data. HealthPrismTM | Focusing Resources & Protecting Lives. 35
Target Census Tract #7 | Vulnerable Population and Points of Interest                                                                                                                     HealthPrism™

 Census Tract: 29095008800
                                                                                                                                                          POINTS OF INTEREST
                                                                                                                                                    Sites for Outreach & Vaccination Events
                                                                                                                                                   Name                            Type                Address
                                                                                                                                     III B's Market & Party Shop                 Grocery        3800 E Gregory Blvd

                                                                                                                                                Food Express                     Grocery        3740 E Gregory Blvd

                                                                                                                               Hosanna Missionary Baptist Church                 Worship            4027 E 67th St

                                                                                                                                  Temple of Faith Baptist Church                 Worship        3000 E Gregory Blvd
                                                                                                                                          Swope Park United
                                                                                                                                                                                 Worship         6300 Swope Pkwy
                                                                                                                                          Methodist Church
                                                                                                                                        Al Haqq Islamic Center                   Worship         6941 Prospect Ave

                                                                                                                                                 Jim's Diner                   Restaurant        6901 Prospect Ave

                                                                                                                                                    KFC                        Restaurant        6607 Prospect Ave

                                                                                                                                       Krispy Krunchy Chicken                  Restaurant       3800 E Gregory Blvd

                                                                                                                                                 Taco Bell                     Restaurant        6607 Prospect Ave

                                                                                                                                           Church's Chicken                    Restaurant       2600 E Gregory Blvd

                                                                                                                                  Hogan Preparatory Acad Middle                  Schools             6409 Agnes

                                                                                                                                        Southeast High School                    Schools         3500 E Meyer Blvd

                                                                                                                                       B. Banneker Elementary                    Schools             7050 Askew

                                                                                                                                                                        Legend

                                                                                                                                                                  Point of Interest (POI)

                                                                                                                                                                  Vulnerable Population
                                                                                                                                                                  (Low to high density)
Target Census Tract #8 | Key Characteristics HealthPrism™ Key Census Tract State Average Note: Data on vaccinations include 1st round Moderna & Pfizer vaccinations and J&J vaccinations, are based on residence of the 18+ individual vaccinated (unless otherwise stated) and are from 8/19/2021. COVID-19 case rate data is a change analysis of rates (cases per 100k) using data from 8/6/21 to 8/20/21. Methodology, data sources, and limitations are available in the Appendix. Full data set provided in corresponding Excel file. All census tract statistics have a margin-of-error associated with them. Copyright © 2021 Deloitte Development LLC. All rights reserved. Deloitte Consulting LLP Trade Secret and Confidential. For internal use only by State of Missouri. Output based on available data. HealthPrismTM | Focusing Resources & Protecting Lives. 37
Target Census Tract #8 | Vulnerable Population and Points of Interest HealthPrism™
Census Tract: 29095013100
POINTS OF INTEREST
Sites for Outreach & Vaccination Events
Name Type Address
Fuel Trip Grocery 10416 Blue Ridge Blvd
Hickman Mills Community
Worship 5809 E Red Bridge Rd
Christian Church
United Believers
Worship 5600 E 112th Ter
Community Church
Memorial Missionary
Worship 11424 Hickman Mills Dr
Baptist Church
Southside Mafia Pizzeria Restaurant 10328 Blue Ridge Blvd
Church's Chicken Restaurant 11500 Blue Ridge Blvd
Paul's Drive In Restaurant 10424 Blue Ridge Blvd
McDonald's Restaurant 11001 Hickman Mills Dr
Fuji Japanese Steakhouse
Restaurant 5701 Longview Rd
& Sushi Bar
Taco Bell Restaurant 5704 E Red Bridge Rd
11115 Bennington
Burke Alternative Program Schools
Avenue
Barber Shop Barber / salon 5715 Longview Rd
Kansas City Missouri Fire
Police / fire 6006 E Red Bridge Rd
Department Station 42
Legend
Point of Interest (POI)
Vulnerable Population
(Low to high density)Target Census Tract #9 | Key Characteristics HealthPrism™ Key Census Tract State Average Note: Data on vaccinations include 1st round Moderna & Pfizer vaccinations and J&J vaccinations, are based on residence of the 18+ individual vaccinated (unless otherwise stated) and are from 8/19/2021. COVID-19 case rate data is a change analysis of rates (cases per 100k) using data from 8/6/21 to 8/20/21. Methodology, data sources, and limitations are available in the Appendix. Full data set provided in corresponding Excel file. All census tract statistics have a margin-of-error associated with them. Copyright © 2021 Deloitte Development LLC. All rights reserved. Deloitte Consulting LLP Trade Secret and Confidential. For internal use only by State of Missouri. Output based on available data. HealthPrismTM | Focusing Resources & Protecting Lives. 39
Target Census Tract #9 | Vulnerable Population and Points of Interest                                                                                                                 HealthPrism™

 Census Tract: 29095009500

                                                                                                                                                        POINTS OF INTEREST
                                                                                                                                                  Sites for Outreach & Vaccination Events

                                                                                                                                                   Name                      Type               Address

                                                                                                                                                Troost Market               Grocery        8001 Troost Ave

                                                                                                                                     New Zion Missionary Baptist
                                                                                                                                                                           Worship         8129 Paseo Blvd
                                                                                                                                              Church

                                                                                                                                                Center Elem.                Schools           8401 Euclid

                                                                                                                                           Center Alternative               Schools           8434 Paseo

                                                                                                                                                                            Barber/
                                                                                                                                         Cuttin'up Barber Shop                             8117 Troost Ave
                                                                                                                                                                             salon

                                                                                                                                                                     Legend

                                                                                                                                                                Point of Interest (POI)

                                                                                                                                                                Vulnerable Population
                                                                                                                                                                (Low to high density)
Target Census Tract #10 | Key Characteristics HealthPrism™ Key Census Tract State Average Note: Data on vaccinations include 1st round Moderna & Pfizer vaccinations and J&J vaccinations, are based on residence of the 18+ individual vaccinated (unless otherwise stated) and are from 8/19/2021. COVID-19 case rate data is a change analysis of rates (cases per 100k) using data from 8/6/21 to 8/20/21. Methodology, data sources, and limitations are available in the Appendix. Full data set provided in corresponding Excel file. All census tract statistics have a margin-of-error associated with them. Copyright © 2021 Deloitte Development LLC. All rights reserved. Deloitte Consulting LLP Trade Secret and Confidential. For internal use only by State of Missouri. Output based on available data. HealthPrismTM | Focusing Resources & Protecting Lives. 41
Target Census Tract #10 | Vulnerable Population and Points of Interest                                                                                                                  HealthPrism™

 Census Tract: 29083950100
                                                                                                                                                           POINTS OF INTEREST
                                                                                                                                                     Sites for Outreach & Vaccination Events
                                                                                                                                                    Name                        Type                Address
                                                                                                                                                Windsor Phillips              Grocery            200 S Main St
                                                                                                                                         Harold's Supermarket                 Grocery            502 S Main St
                                                                                                                                     First Baptist Church Windsor             Worship            308 S Tebo St
                                                                                                                                      Grace Community Church                  Worship         110 W Florence St

                                                                                                                                  First Christian Church of Windsor           Worship          211 W Benton St

                                                                                                                                         Calvary Baptist Church               Worship            508 N Main St
                                                                                                                                                 Windsor High                  Schools           210 North St.
                                                                                                                                                Windsor Elem.                  Schools           501 S Main St.
                                                                                                                                         Henry County Library                  Library         105 W Benton St,
                                                                                                                                            Hair and Beyond                   Barber /
                                                                                                                                                                                                 211 S Main St
                                                                                                                                           Salon and Tannery                   salon
                                                                                                                                       Merryfield Pharmacy Inc               Pharmacy          200 W Benton St
                                                                                                                                      Compass Health Pharmacy                Pharmacy           200 W Florence

                                                                                                                                  Golden Valley Medical - Windsor                RHC               100 S Tebo

                                                                                                                                                                        Legend

                                                                                                                                                                   Point of Interest (POI)

                                                                                                                                                                   Vulnerable Population
                                                                                                                                                                   (Low to high density)
Appendix Copyright © 2021 Deloitte Development LLC. All rights reserved. Deloitte Consulting LLP Trade Secret and Confidential. For internal use only by State of Missouri. Output based on available data. HealthPrism™ | Focusing Resources & Protecting Lives. 43
14-Day COVID-19 Case Rate Hotspots at the Census Tract Level                                                                                                                                                     HealthPrism™
 For the time period between 8/06/21 and 8/19/21, the change in COVID-19 case rate (per 100,000) is displayed on the left and case rate hotspots (areas with
 statistically significant changes in case rates in comparison to surrounding areas) are displayed on the right

                                           14-Day Case Rate Change                                                                                                14-Day Case Rate Hotspots

                                                  Regions A, E and F have experienced the highest increase of COVID-19 case rates for the past 2 weeks
                                          Case rate hotspots persisted in Kansas City (15 within I-435) and St Louis (2 inside I-270), slightly fewer than last week
                     Case rate hotspots persisted in several of the outdoor recreation gateways into the Lake of the Ozarks and Mark Twain National Forest regions
Note: Data normalized by population (per 100,000 residents) per Census Tract. COVID-19 case rate data provided by the State of Missouri as of 8/20/21. Previous 2-week change view provided in the Appendix, along with methodology, data sources,
and limitations.
Copyright © 2021 Deloitte Development LLC. All rights reserved.
Deloitte Consulting LLP Trade Secret and Confidential.                                      For internal use only by State of Missouri. Output based on available data.               HealthPrismTM | Focusing Resources & Protecting Lives. 44
Statewide Top 10 Census Tracts by the COVID-19 Vulnerability Index HealthPrism™
Below are the 10 Census Tracts with the highest COVID-19 Vulnerability Index scores – notably all in the St. Louis and Kansas City areas with low rates of vaccination,
significant minority populations, and high rates of low-income households
Variables Included in the CVI Additional Demographic Characteristics
Cumulative Households
Vulnerability 18+ Individuals with
Census Tract County COVID-19 Case 1+ Medical Minority Living Below without Crowded
Unvaccinated Education Level
Index Rank Population Burden Comorbidities Populations 138% FPL Internet Households
as of 8/27/21 (%) Below High School
as of 8/27/21 (%) (%) (%) Access (%)
(%)
(# per 100k) (%)
Statewide Census Tract Average 44.64% 10,229 29.86% 20.43% 21.64% 17.42% 5.17% 9.98%
1 29510106200 St. Louis City 980 57.35% 9,632 38.98% 97.96% 70.32% 42.92% 11.68% 16.46%
2 29095013203 Jackson County 2,837 60.91% 13,748 42.30% 92.14% 55.73% 18.69% 10.85% 12.74%
3 29189212002 St. Louis County 2,196 52.73% 21,357 39.71% 94.85% 54.19% 19.13% 9.19% 12.27%
4 29095005602 Jackson County 1,321 59.05% 11,096 49.36% 96.37% 47.05% 14.45% 3.64% 15.84%
5 29189212200 St. Louis County 5,797 59.29% 6,498 62.69% 96.89% 38.00% 34.81% 11.04% 14.46%
6 29189213900 St. Louis County 1,389 61.70% 9,076 34.05% 96.90% 58.13% 46.02% 6.55% 10.30%
7 29189213800 St. Louis County 4,763 60.47% 9,840 58.56% 96.66% 33.78% 26.39% 11.36% 14.63%
8 29189212102 St. Louis County 2,286 65.27% 6,765 42.26% 96.59% 47.16% 15.91% 14.01% 13.99%
9 29510107500 St. Louis City 2,287 63.27% 8,634 38.22% 96.98% 45.90% 41.42% 11.37% 21.04%
10 29095006000 Jackson County 1,277 58.73% 12,811 36.65% 97.02% 44.61% 33.17% 10.24% 17.50%
Note: Data on vaccinated individuals are based on 1st round Moderna & Pfizer vaccinations and J&J vaccinations, based on the residence of the individual (18+) vaccinated, and as of 08/27/21. COVID-19 case rate provided by the State of Missouri as of
8/27/21. Methodology, data sources, and limitations are available in the Appendix.
Copyright © 2021 Deloitte Development LLC. All rights reserved.
Deloitte Consulting LLP Trade Secret and Confidential. For internal use only by State of Missouri. Output based on available data. HealthPrismTM | Focusing Resources & Protecting Lives. 45Disclaimers about HealthPrism™ Content HealthPrism™
Content is meant to supplement knowledge and resources already available to you.
Content may be used to complement local efforts already taking place in your State and to assist with providing a level of
granularity and frequency of updates that are not available in public datasets.
Information presented is illustrative of a sample of analyses and capabilities that may be available to you to support COVID-19
response and recovery efforts in Missouri.
Insight(s) represent content generated as of a specific date – content and insights are subject to change given updated data.
Content is populated by proprietary and publicly available sources, both of which are non-static and continuously updating.
For privacy purposes, Personally Identifiable Information (PII) such as names, addresses, precise location of households are not
shared in this report.
Copyright © 2021 Deloitte Development LLC. All rights reserved.
Deloitte Consulting LLP Trade Secret and Confidential. For internal use only by State of Missouri. Output based on available data. HealthPrismTM | Focusing Resources & Protecting Lives. 46You can also read