WEATHER Project at a Glance - Main Messages and Achievements
←
→
Page content transcription
If your browser does not render page correctly, please read the page content below
W E AT H E R P ro j e c t a t a G l a n c e –
Main Messages and Achievements
W E A T H E R F i n a l C o n f e r e n c e , A t h e n s A p r i l 2 3 rd 2 0 1 2
Claus Doll, Stefan Klug, Fraunhofer-ISI, Karlsruhe, Germany
2011 map exists: Structure
                  dominated by Fukushima

Munich RE - TOPICS GEO:
“With economic losses amounting
to some US$ 380bn, 2011 has
been the most expensive natural
disaster year to date.”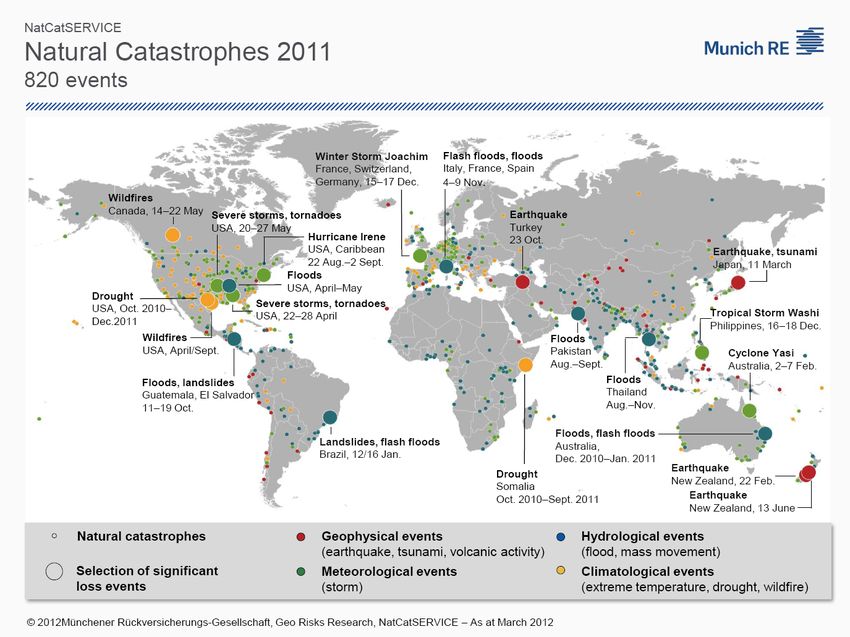
W E AT H E R c o re o b j e c t i v e

   Determine the physical impacts and the economic costs of extreme weather
   events on transport systems and identify the costs and benefits of suitable
   adaptation and emergency management strategies.
   Duration: November 2009 – April 2012
   Funding: 7th framework program of the European Commission, DG-RESEARCH

 Participant organisation name                                                                                    Country

 Fraunhofer Society, Institute for Systems and Innovation Research (ISI) and Institute for Transportation and
 Infrastructure Systems (IVI)
 Centre for Research and Technology Hellas, Helenic Institute for Transportation (CERTH-HIT)
 Société de Mathématiques Appliquées et de Sciences Humaines - International research Center on Environment and
 Development (SMASH-CIRED)
 Center for Disaster Management and Risk Reduction (CEDIM), Karlsruhe Institute of Technology
 Institute of Studies for the Integration of Systems (ISIS)
 Herry Consult GhmH
 Agenzia regionale per la Prevenzione e l'Ambiente dell'Emilia Romagna (ARPA-ER)
 NEA Transport research and training

© Fraunhofer ISI
Seite 3
P ro j e c t s t r u c t u re
Climate Trends & Economy- Transport Sector
Wide Impacts Vulnerability
Project Advisory Board &
Reports, Publications &
International Panel
Emergency Transport Sector
Workshops
Management Adaptation Strategies
Actors, Governance European Case
and Innovation Studies
Policy conclusions
and Dissemination
© Fraunhofer ISI
Seite 4
Vu l n e r a b i l i t y A s s e s s m e n t : D a t a S o u rc e s
and Dimensions

                   Transport sector     Infrastructure     Infrastructure
Analytical steps

                     observations       damage costs      operating costs           House
                                                                                  numbers
                    Insurance and       Vehicle damage    Fleet & service
                                                                                  of average
                   general statistics        costs        operating costs
                                                                                    annual
                    Media reports       User time costs   User health costs          costs

                   Transport modes:     Weather categories            Climate zones
                   •Road,               •Rain, hail,
                   •UPT                 •Floods,
     Dimensions:

                   •Rail,               •Landslides
                   •CT                  •Cold, snow, ice
                   •IWW,                •Heat, drought
                   •Maritime            •Wildfires
                   •Aviation            •Storms,

        © Fraunhofer ISI
        Seite 5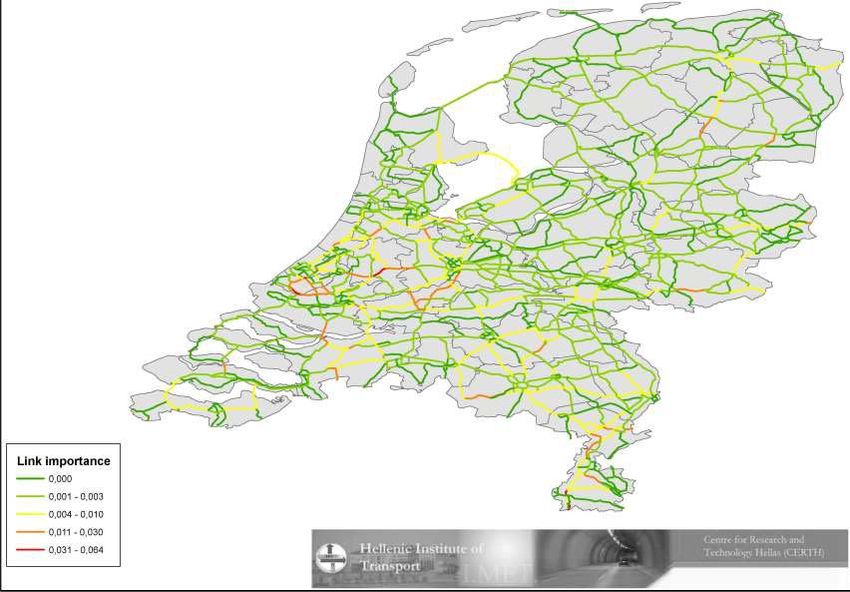
R o a d Tr a n s p o r t : R e s u l t s o f t h e I n c i d e n t
Database Assessment
Problems: bias by selected media + input data uncertainties
But: report assessment indicates order of magnitude of the problem by type of incident
Results:
• Germany highest costs Total costs 2000 - 2010 by media reports
UK
density of reports Winter
DE
CZ
• Italy only storms CH
AT
not plausible UK
IT
Floods most relevant DE
Storm
• CZ
many countries + CH
AT
damage of assets DE
He
at
UK
• Heat: no reports from DE
Flood
CZ
southern Europe CH
AT
further research 0 200.000 400.000 600.000 800.000 1.000.000 1.200.000
needed
Total Infra Assets (K€) Total infra Operations (K€) Total Vehicle Assets (K€)
Total fleet Operations (K€) Total User Time (K€) Total Health & Life (K€)
© Fraunhofer ISI
Seite 6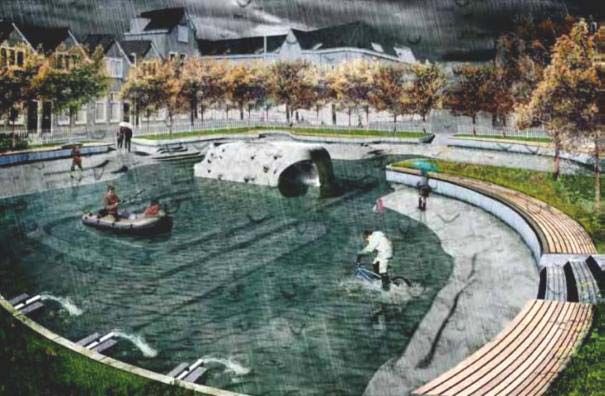
R o a d Vu l n e r a b i l i t y – t h e H y b r i d A p p ro a c h

•     Incident Database
      (IDB)
       • 950 media and
         transport operator
         reports +             Overview of the availability of cost

                                                                                  Floods / flash floods

                                                                                                                                                                  Hail and hail storms
                                                                                                                            Extratrop. cyclones
                                                                                                           Mass movements
                               estimates in road transport due to
       • Assessment by         extreme weather conditions:

                                                                                                                                                                                                                   Winter Storms
                                                                                                                                                   Storm surges

                                                                                                                                                                                          Frost periods

                                                                                                                                                                                                                                   Heat periods
         standard incident     EEM: Extremes elasticity model

                                                                                                                                                                                                                                                             Wild fires
                                                                                                                                                                                                                                                  Droughts
                                                                      Rainfalls

                                                                                                                                                                                                          Snow
                               IDG: Incident Database
         categories            Generalisation
                               Infrastructure assets
•     Extremes Elasticity
                               Infrastructure operations
      Model (EEM)
                               Vehicle assets
       • Cost elasticity       Transport service operations
         evidence from         Safety issues
         literature +          Congestion and delays

       • Meteorological
                               Data sources:
         indices of extremes                                          EEM                                 IDB                                     Both                                   No data                 Irrelevant

© Fraunhofer ISI
Seite 7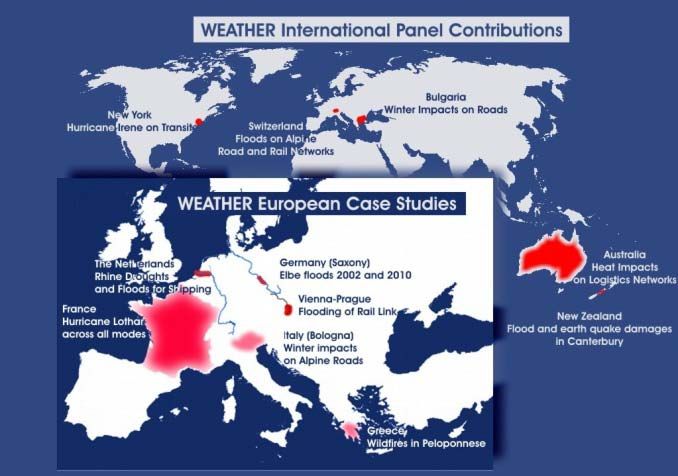
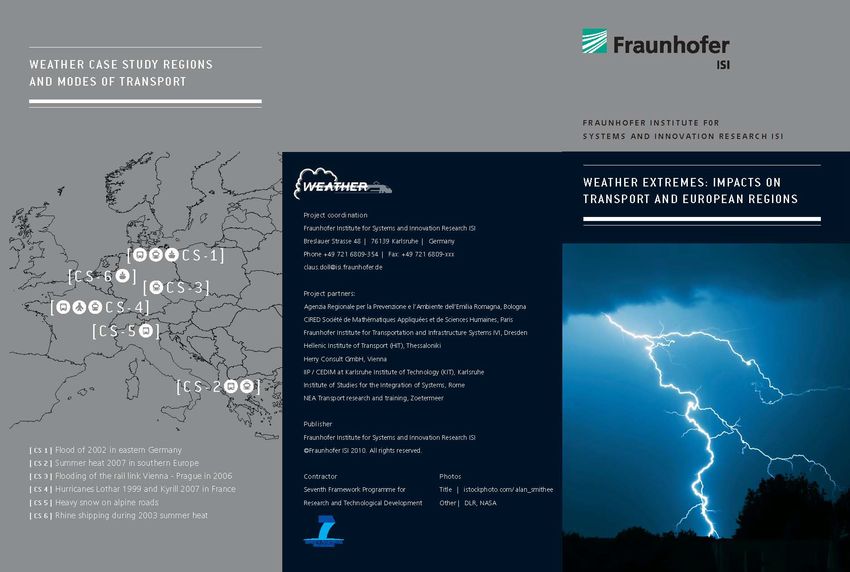
R a i l w a y s : S t a t i s t i c a l m e a s u re s o v e r a m u l t i -
national incident database

                                                Bandwith of costs per costs type and weather event type
 Basis: Assessment of incident                                        in mio EUR

 reports in a few countries                                 Heavy    Permanent
                                                           rainfalls  rainfalls
 with access to operator data.                               with       with
                                                                                    Thunder-
                                                                                     storms
                                                                                                  Winter-
                                                                                                  storms
                                                                                                                 Avalanches
                                                         consequent consequent
 Presentation for selected                                  events     events
                                                min             0,00         1,97         0,00            0,00         0,00
 categories of extremes by        capital       max             2,81        50,37         0,04            0,04         0,09

 max., min., average and           costs      average
                                              median
                                                                0,73
                                                                0,26
                                                                            18,13
                                                                             2,06
                                                                                          0,02
                                                                                          0,02
                                                                                                          0,01
                                                                                                          0,00
                                                                                                                       0,04
                                                                                                                       0,04
 median costs per incident.                     min             0,15         3,40         0,49            0,20         0,16
                                 oprational     max            18,82        40,29         0,63            5,94         7,36
 Results:                          costs      average           3,84        16,62         0,56            1,65         3,76
                                              median            1,56         6,17         0,56            0,58         3,76
 •     by far most relevant                     min
                                                max
                                                                0,10
                                                               11,96
                                                                             2,01
                                                                            23,79
                                                                                          0,29
                                                                                          0,29
                                                                                                          0,12
                                                                                                          2,48
                                                                                                                       0,08
                                                                                                                       3,47
                                   user
     permanent rain with           costs      average           2,44         9,84         0,29            0,86         1,78

     consequences (= major                    median
                                                min
                                                                1,01
                                                                0,26
                                                                             3,73
                                                                             7,37
                                                                                          0,29
                                                                                          0,82
                                                                                                          0,40
                                                                                                          0,35
                                                                                                                       1,78
                                                                                                                       0,23
     floods)                       Total
                                   costs
                                                max            31,97       114,46         0,93            8,42        10,92
                                              average           7,00        44,60         0,87            2,52         5,58

 • No evidence for relevant                   median            2,69        11,96         0,87            1,40         5,58

   heat-inflicted costs

© Fraunhofer ISI
Seite 8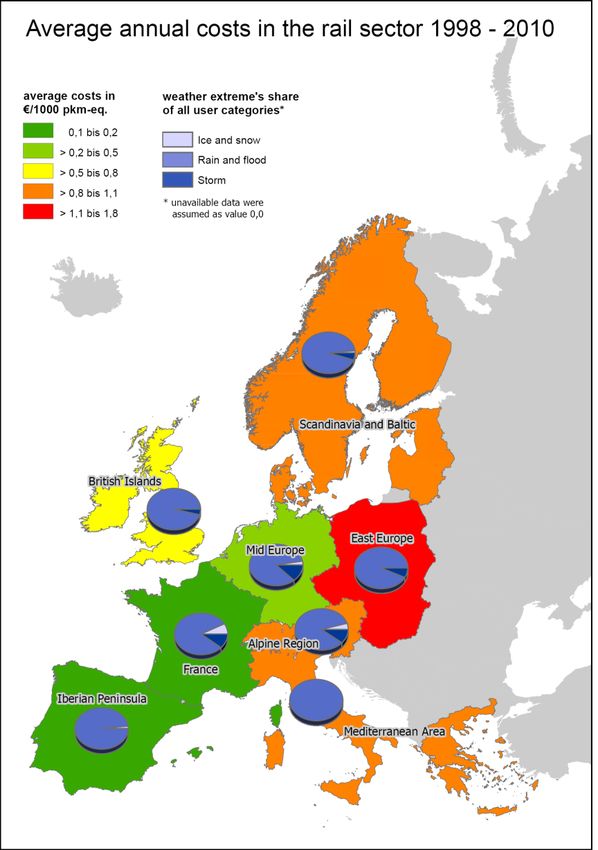
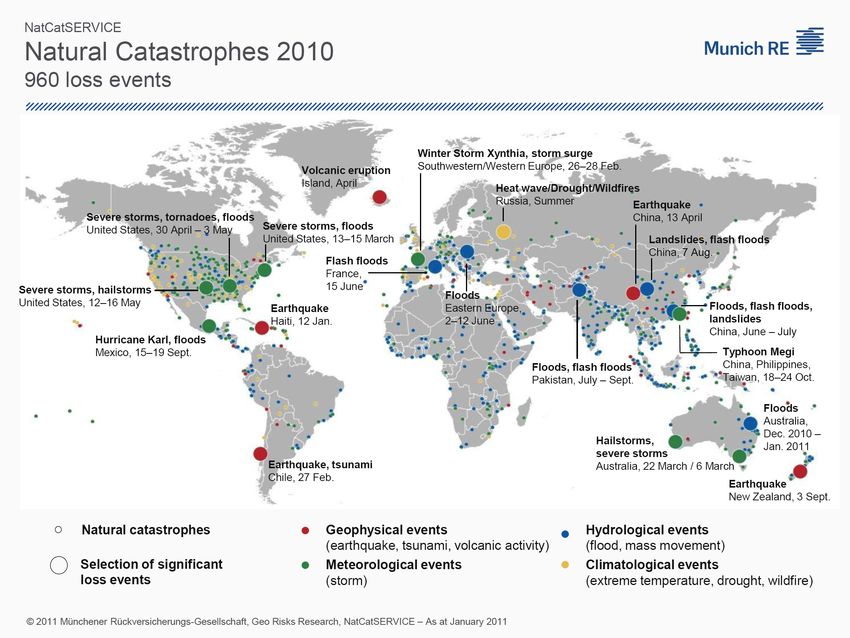
Av i a t i o n –
S e l e c t e d e v i d e n c e f ro m l i t e r a t u re
Causes of Fatal Aviation Accidents by Decade (percentage)
Delays from EUROCONTROL 100%
90%
database: peaks in extreme 80%
Other Cause
Sabotage
winters 2009 – 2011 clearly 70%
Mechanical Failure
60%
visible 50%
Weather
Other Human Error
40%
Pilot Error (mechanical related)
30% Pilot Error (weather related)
20% Pilot Error
Average delay per movement and share of delay groups in commercial air 10%
18%
transport 2007 - 2010 35
0%
16% 1950s 1960s 1970s 1980s 1990s 2000s All
30
ADM: Average departure delay per movement (min.)
14%
25
12%
Share of delay group at ADM
77: Ground handling
76: Airport snow removal
20
Aviation safety: Probably minor impact of
10% 75: De-icing of aircraft
73: En-route
8% 72: Destination station
weather in commercial aviation, but
15
71: Departure station
6% Av. departure delay
4%
10
considerable fatalities in general aviation.
2%
5
Detection of real causes difficult with
0%
J F MAM J J A S ON D J F MAM J J A S ON D J F MAM J J A S ON D J F MAM J J A S ON D
0 current data sets
Data source:
2007 2008 2009 2010 EUROCONTROL 2011
© Fraunhofer ISI
Seite 9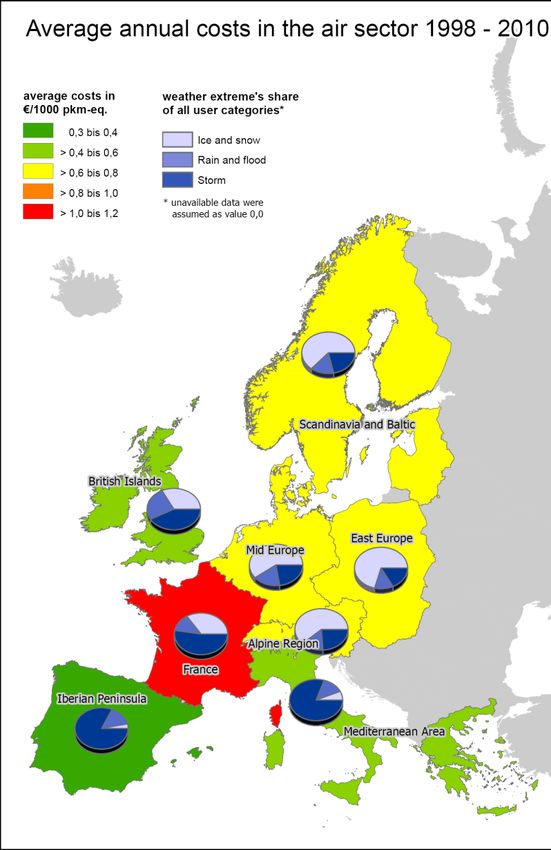
T h e re s u l t s : w h i c h i m p a c t s a re m o s t c o s t l y
and what is the biggest cost driver?

Focus of modal studies is extremely different:
•     EU-wide generalisation of costs from a sample
      of countries (road, CT and aviation)
•     Concentration of a set of relevant core
      countries (maritime and IWW)
•     detailed assessment of selected events and
      cases (rail)
•     reporting of some selected observations (urban
      and intermodal passenger transport)
Results:
• Total annual costs: €2.2 billion,
• Most costly extreme: rain and floods.
• Biggest stakeholders affected: Infra assets and
  users’ costs (delays and accidents)

© Fraunhofer ISI
Seite 10
H o t s p o t s i n c u r re n t d a m a g e l e v e l s : a v e r a g e c o s t s b y p a s s e n g e r- k i l o m e t e r © Fraunhofer ISI Seite 11
C l i m a t e s c e n a r i o s - Te m p e r a t u re
European Scenario based on Statistical Downscaling for Northern Italy
ENSAMBLES projections Probability density functions (PDF) for winter
The ENSEMBLES probabilistic projection of and summer season 2021-2050 & 2071-2100
10th (a) and 90th (b) percentile of summer
mean air temperature (JJA-10th and 90th Winter Tmin changes over N-Italy, scenario A1B (2021:2050-1961:1990)
Ensemble Mean (EM)
Summer Tmax changes over N-Italy, scenario A1B (2021:2050-
1961:1990) Ensemble mean (EM)
Tmean) over Europe under the A1B emission,
period 2080–2099 relative to the 1961– EM clima_1961-1990
EM climate 1961-1990
1990 Focus on IPCC and related
publications detailed scenarios in D1
-5 -4 -3 -2 -1 0 1 2 3 4 5 6
-5 -4 -3 -2 -1 0 1 2 3 4 5 6
Winter Tmin Changes (°C)
Summer Tmax Changes (°C)
Scenario A1B (2071:2099 -1961:1990) Scenario A1B (2071:2099-1961:1990)
Ensemble Mean (EM) Tmin , N-Italy Ensembles Mean -Tmax, N-Italy
EM climate 1961-1990
Probability Density Function
EM clima_1961-1990
-5 -4 -3 -2 -1 0 1 2 3 4 5 6 7 8 -5 -4 -3 -2 -1 0 1 2 3 4 5 6 7 8 9
Winter Tmin Changes (°C) Summer Tmax Changes (°C)
© Fraunhofer ISI
Seite 12F o re c a s t re s u l t s o f D a m a g e C o s t s p e r Pkm/Tkm 1998-2010 to 2040-2050 © Fraunhofer ISI Seite 13
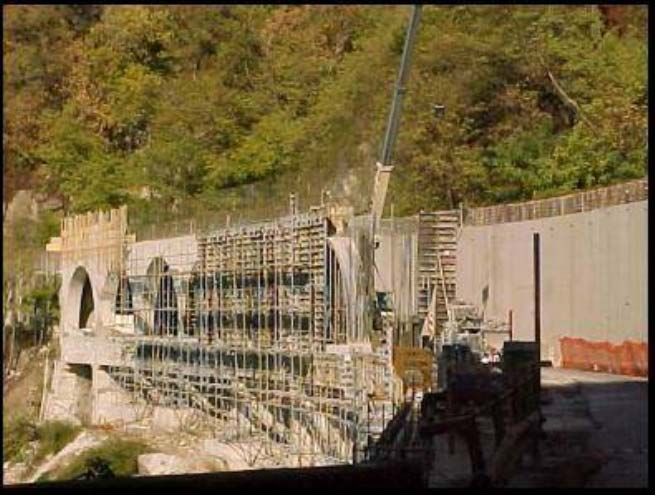
Adaptation Example Netherlands: Planning
f o r m u l t i - f u n c t i o n a l s p a c e i n u r b a n a re a s

• Netherlands: large parts under sea level.
• Planning focus changed from technology (building materials) to
  sustainable planning strategies.
• Multifunctional space provides reservoirs for flood waters to be
  temporarily stored

© Fraunhofer ISI
Seite 14
A d a p t a t i o n E x a m p l e A r a b i a : I n f r a s t r u c t u re Te c h n o l o g i e s i n P u b l i c Tr a n s p o r t • More heat waves requires advanced air conditioning for waiting passengers in stations • Investments needed to reduce out-of-service times in the London underground as in summer times trains push in hot air inside • Air conditioning of bus stations in Dubai and Bandar Kinrara sustainability? © Fraunhofer ISI Seite 15
A d a p t a t i o n E x a m p l e U K / M i d E u ro p e : Ve h i c l e
technology in public transport

• Innovative amphibious bus in Glasgow replacing ferries.
  Option for enhanced evacuation in emergency situations (left)
• Aerodynamics improvements of vehicles against side winds (right)

© Fraunhofer ISI
Seite 16
Figure 35: Supply Chain Risk Management Maturity Model - Moving up the maturity continuum of Supply Chain Risk Management can help com
A d a p t a t i o n E x a m p l e Av i a t i o n O p e r a t i o n s –
Integrated Management System (WIMS)
• Automatic linking of advanced weather information management
systems (WIMS) to operational processes
• Next Generation ATM better use of capacity and more robustness
against weather extremes.
© Fraunhofer ISI
Seite 17A d a p t a t i o n M e a s u re D a t a b a s e
Measure Short title / description
Preparatory tasks:
Characterisation
Sector class Detailed transport sector element of the measure
Hot spot analyses by sector and Mode class Details to the transport mode addressed by the measure
mode Hazard class Detailed weather extremes addressed by the measure
Area zone Detailed geographical characteristics for the measure
Damage costs / vulnerability forecast
Impact Network-km, assets, people potentially affected
until 2050 / qualitatively until 2011
Benefits 0-3 Comment: to what degree can the hazard be reduced?
Flexibility 0-3 Comment: can the measure, once implemented, be adapted
to changing developments of the hazard category ad-
Sector adaptation analyses
Assessment
dressed?
Feasibility 0- 3 Comment: how simple / feasible is the implementation of the
Database of measures by: measure in practice?
Infrastructure technology Wider impact -3 -
+3
Comment: what is the magnitude of positive or negative side
effects on environment and society?
Vehicle technology Costs €/unit Comment: What is the likely implementation costs (life cycle
costs p.a.) and what does it depend on?
System operations Detailed Detailed description of the measure; determinants of benefits and
description costs, practical experiences, ...
Transport planning
Details
Transferrability Indicate possible applications of the measure to different modes,
regions and types of hazards
Sources References, documents, links, ...
© Fraunhofer ISI
Seite 18Multi Criteria Assessment Results
5 criteria: Assessment results by adaptation categories
costs = Range of scores: 0 .. 3
affordability Incentives and information Costs
structures
feasibility
Infra-
Supervision and maintenance Risk reduciton
flexibility Investments Total score
wider impacts Detection and communication
Vehicle fleets
risk reduction Engineering
Scale 0...3
Maintenance
Raising preparedness
operations
4 main
Service
Co-operaation strategies
categories
System redesign
in 11 sub-
categories
All planning
General protection measures
Spatial
317 single Network redesign
measures
0.00 0.50 1.00 1.50 2.00 2.50 3.00 3.50
© Fraunhofer ISI
Seite 19C a s e s i n v e s t i g a t e d : W E AT H E R c a s e s t u d i e s a n d i n t e r n a t i o n a l p a n e l re p o r t s 6 WEATHER Case Studies Mixed picture of leaning effects from past events: 3 cases with positive learning effects (2 cases were this is unclear and 1 case were past events have not lead to increased preparedness. 5 International Panel Reports Our of these only two (New York and Switzerland) report efficient learning from past events. Vague risk profiles and tight public households seem to limit decisive action and preparation. © Fraunhofer ISI Seite 20
Some simple messages

  Vulnerability:
  •       Current annual mean costs: 2.3 billion euros
  •       Most costly hazards: floods, followed by winter events
  •       The regional sensitivity is highest in mountain areas
  •       Most vulnerable mode currently and by 2050 is rail transport
  Adaptation:
  •       First priority: staff training, information systems co-operations and contingency planning.
          Vehicle technology of second order.
  •       Expensive infrastructure investments are however needed in mountain and coastal areas;
  •       Public transport can serve as first mover preparing for climate change
  Case studies:
  •       Learning from past events seems essential for implementing effective crises preparation
          and adaptation policies
  •       In many cases day to day policy needs block learning processes

© Fraunhofer ISI
Seite 21
Stay informed All resources available at www.weather-project.eu Contact: info@weather-project.eu
© Fraunhofer ISI
Seite 24
C o re q u e s t i o n : W h a t i s “ e x t re m e “ ?
Meteorological definition: Events exceeding the 90th or 95th percentile of
severity or duration of long-term averages (e.g. the 10% longest dry spells,
10% multi-day-periods with lowest temperatures, etc. )
Related to annual indicators 10 year / 20 year event or return period
Impact-related definition: events entailing consequences which exceed the
managerial capacity or resources of the local area affected (i.e. requiring
support from supra-regional entities) or which are causing substantial
damages to assets or human health or lives.
Somehow arbitrary but easy to manage approach
Applied methodological mix in the WEATHER project:
• Current (1998 – 2010) damage quantification Impact-related definition
• Regional value transfer & forecast by 2040 – 2050: Meteorological approach
© Fraunhofer ISI
Seite 25N e t w o r k c r i t i c a l i t y a s s e s s m e n t : w e re d o e s t h e c u t o f ro a d n e t w o r k s h u r t m o s t ? Main features • Transport models VISUM and TRANS-TOOLS • Algorithm indentifying the importance of single links • Application to Greece, Germany and the Netherlands General findings • Most critical access roads to big agglomeration areas • Partly high relevance of inter- urban links in sparsely populated boarder areas. • Similar results for densely populated NL and for rural German and Greek areas. • Approach applicable to other modes, too © Fraunhofer ISI Seite 26
R o a d : v u l n e r a b i l i t y f ro m i n t e r n a t i o n a l
l i t e r a t u re - s e l e c t e d f i n d i n g s
 Crash rates by weather type                                                              Average winter maintenance costs by number of
 in the US 1995 – 2005                                                              12000       snow days, Germany, 1988 - 2007

                                        Average winter maintenance costs (€/road-
                                                                                    10000

                                                                                     8000

                                                                                     6000

                                                          km)
                                                                                     4000

                                                                                     2000

                                                                                       0
                                                                                            0             10           20            30           40            50

                                                                                                                Number of ice days (Tmax < 0°C)
                                                                                                Federal Motorways Euro/km            Federal Highways Euro/km

                                                                                                                 Winter maintenance costs in
     Similar statistics for different                                                                        relation to annual snow and ice
     European climate regions                                                                               days on German motorways and
                                                                                                                                federal roads

© Fraunhofer ISI
Seite 27
S p e c i f i c l o o k o n ro a d : m a i n p ro b l e m f l o o d
d a m a g e s t o i n f r a s t r u c t u re s
900 Annual mean costs by type of extreme
Results: 800
700
• Total costs: € 1.8 bill. p.a. User safety
million Euro p.a.
600
average across 1998 - 2010 500 User time losses
400 Fleet operations
• Highest costs for winter 300 Vehicle assets
conditions, followed by rain 200 Infra operations
and floods (including 100 Infra assets
0
landslides) Ice&snow Rain&flood Storm Heat&drought
• Most affected element:
infrastructure assets Annual mean costs by transport sector
1200
Results partly driven by data
1000
availability: poor consideration of
million Euro p.a.
800
southern countries and heat- Heat&drought
related impacts 600
Storm
400 Rain&flood
Ice&snow
200
0
Infra assets Infra Vehicle Fleet User time User safety
operations assets operations losses
© Fraunhofer ISI
Seite 28Railways –
S e l e c t e d e v i d e n c e f ro m l i t e r a t u re
Rail buckling in the UK:
Several thousand delay hours
– quality issues of rail
construction and
maintenance standards?
Inportant in mounntain areas: land
slides and flash floods. No
systematic database by European
rail infrastructure organisations.
© Fraunhofer ISI
Seite 29Rail –
G e n e r a l i s a t i o n o f re s u l t s
1. Allocation of the 4 incident categories to WEATHER standard categories
2. Number of extremes from EEA database for 2000 – 2010
3. Selection of unit cost factor (between min and max) by total damage of extreme
4. “Back of the envelope” estimate no regional differentiation
Average costs Total annual mean costs
(mill. € / event) mill. € p.a.
Infra- Oper- Infra- Oper-
Category Severity # structure ations Users structure ations Users TOTAL
Avalanches Major 9 0.04 3.76 1.78 0.04 3.38 1.60 5.02
Storms Very large 32 0.01 1.65 0.86 0.03 5.28 2.75 8.06
Major 41 0.01 1.65 0.86 0.04 6.77 3.53 10.33
major
Floods landslides 54 0.73 3.84 2.44 3.94 20.74 13.18 37.85
Major floods 55 18.13 16.52 9.84 99.72 90.86 54.12 244.70
TOTAL 103.77 127.03 75.18 305.97
© Fraunhofer ISI
Seite 30Av i a t i o n –
S o m e re s u l t s f o r E u ro p e
Annual costs by region and cost category
Total costs: € 362 mill. p.a. 90,0
80,0
Equally important: winter 70,0
Average annual costs (mill. €)
conditions and storms. 60,0 User safety
50,0 User time
Most affected user time losses and Fleet oper.
40,0
fleet operations 30,0
Veh. assets
Infra Operation
20,0
Annual costs by extreme and cost category 10,0
180,0
160,0 0,0
Average annual costs (mill. €)
AL BI EA FR IP MD ME SC
140,0
User safety
120,0
User time
100,0
Fleet oper. Regional context rather artificial for some
80,0
60,0
Veh. assets
cost categories (delays + operating costs)
Infra Operation
40,0 due to level of data accessibility.
20,0
0,0 Probably most affected Mid Europe (ME),
Ice&snow Rain Storm
France (FR) and the British Islands (BI) due
to their fluctuating climate conditions.
© Fraunhofer ISI
Seite 31Tr a n s p o r t S e c t o r F o re c a s t s t o 2 0 5 0
• Basis: European System 1.20
Dynamics Model ASTRA: GHG- Development of road demand (passenger + freight)
TransPoRD Base Scenario until 1.00
2050 0.80 AL
• Model Outputs: passenger-km BI
EA
0.60
and ton-km for road FR
IP
rail/navigation and aviation 0.40
MD
composite vulnerability measure ME
0.20 SC
= pkm + 0.3 * tkm according to
values of travel time savings. 0.00
2010 2015 2020 2025 2030 2035 2040 2045 2050
• Infrastructure assets: estimated -0.20
growth according to pkm / tkm
growth and network saturation
(road: medium, rail: low, air:
high)
© Fraunhofer ISI
Seite 32‚ T h e W E AT H E R A d a p t a t i o n A s s e s s m e n t
Framework
Criterion Weight Value Comment
Risk Is it possible to reduce the hazard using the adaptation measure?
A reduction
0...100 0…3 (0=no risk reduction, 3=very good risk reduction)
How simple/feasible is the implementation of the measure in
B Feasibility 0...100 0…3 practice?
(0= no feasibility / high resistance, 3= very good feasibility)
Can the measure, once implemented, be adapted to changing
C Flexibility 0...100 0…3 developments of the hazard category addressed? (0=no flexibility,
3=high flexibility)
What is the magnitude of positive or negative side effects on
Wider environment and society/Are there side effects using the measure?(-
D Impact
0...100 -3…+3
3=very negative impacts, +3=very positive impacts)
What are the likely costs for the affected infrastructure manager,
Range of transport operator, user or the state? (in share of respective life
E costs
0...100 0…5 cycle costs: 0=100%)
Weighted
100
sum
• Weights for all measures; values individually for each measure
• In additiona for each measure relevant hazard, region and transport mode
© Fraunhofer ISI
Seite 33Wo r k s h o p 3 : A d a p t a t i o n S t r a t e g i e s
May 20th Rotterdam, 22 external experts
from stakeholders and research
Key messages: Expert votes for MCA weighting criteria
• Now consideration of climate issues (n = 31, total vote = 100)
90
in planning 2100 due to long life of
infrastructures 80
70
• Some technical measures are 60
at low costs, problem of acceptance Max.
50
• Operators often still ignore the 40 Min.
relevance of Climate change on their 30 Average
business 20
• Costs and risk reduction potential 10
constitute the most relevant 0
assessment criteria Risk Feasi- Flexi- Wider Life cycle
reduction bility bility impacts costs
© Fraunhofer ISI
Seite 34Conclusions on adaptation strategies
Most promising strategies identified:
• Training, incentives and information strategies to be applied to company staff as
well as to management units. Easily feasible, very flexible, providing wider impact (team
building) at reasonable costs.
• Detection and communication solutions with ICT technologies: Damage
prevention through early warning, reasonable costs and commonly easily feasible. Most
technologies do exist already now.
• Co-operation strategies: Low cost and wider secondary impacts to prepare companies
and industries for very different kinds of threats (global demand and supply shortages,
different types of transport system failures, etc.).
Most technologies and organizational options do exist already now. Climate change and
increasing weather extremes are only one out of many driving forces to implement them.
Many infrastructure-related engineering measures can be implemented at low or no costs
through standard maintenance cycles.
© Fraunhofer ISI
Seite 35You can also read