EAST COAST ENERGY CONFERENCE FIRSTENERGY CAPITAL CORP./ SOCIÉTÉ GÉNÉRALE - March 12, 2014
←
→
Page content transcription
If your browser does not render page correctly, please read the page content below
EAST COAST ENERGY CONFERENCE
     FIRSTENERGY CAPITAL CORP./
             SOCIÉTÉ GÉNÉRALE

                    March 12, 2014

                              1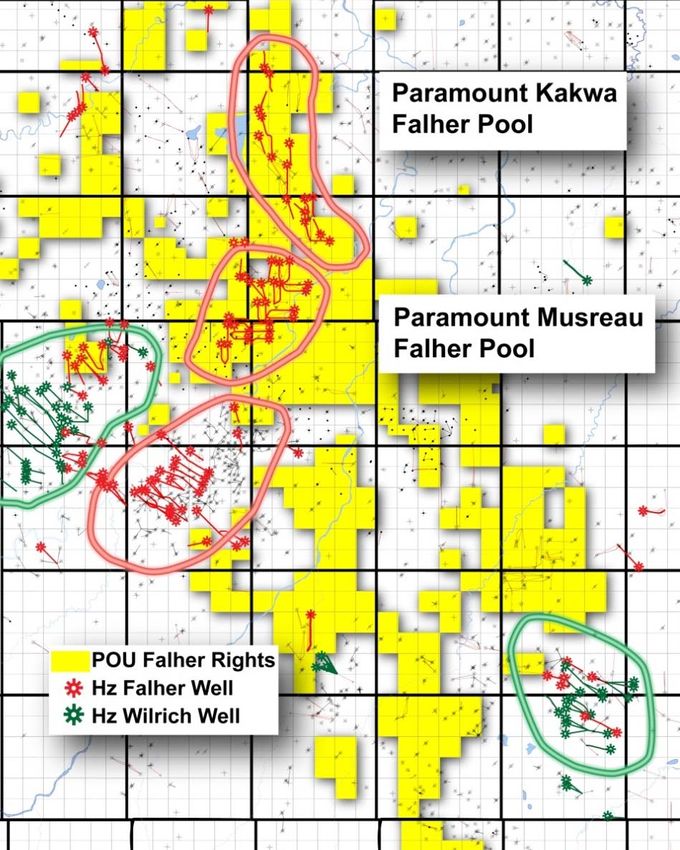
Future Oriented Information
                                                (See additional advisories at the end of this document)

• In the interest of providing information regarding Paramount Resources Ltd.
 ("Paramount" or the "Company"), including management's assessment of the
 Company's future plans and operations, this presentation contains certain
 forward-looking information and forward-looking statements.
• The projections, estimates and beliefs contained in such forward-looking
 information and statements necessarily involve a number of assumptions and are
 subject to known and unknown risks and uncertainties which may cause the
 Company's actual performance and financial results in future periods to differ
 materially from any estimates or projections of future performance or results
 expressed or implied by such forward-looking statements. The material
 assumptions, risks and uncertainties are referred to in the advisories contained
 in the Advisories Appendix.
• Accordingly, shareholders and potential investors are cautioned that events or
 circumstances could cause actual results to differ materially from those
 predicted.
• Any use of information contained within this presentation is expressly forbidden.

                                                                                                     2
Corporate Profile

• Average 2013 production: 20,914 Boe/d (~85% gas)

• 97.1 MM shares outstanding

• Market capitalization @ $45.50/share: $4.4 billion

• > 50% insider ownership

• 924,000 net acres undeveloped land (December 31, 2013)

• Net Debt: $1,119 MM (at December 31, 2013)

• 2013 Capital Expenditures: $743 MM

• 2014E Capital Expenditures: $650 MM

• 2014 projected production to attain > 50,000 Boe/d (1);

       • >70,000 in 2015 (1)

                                                                                                            3

(1) Production dependent on availability of downstream NGLs transportation and processing capacity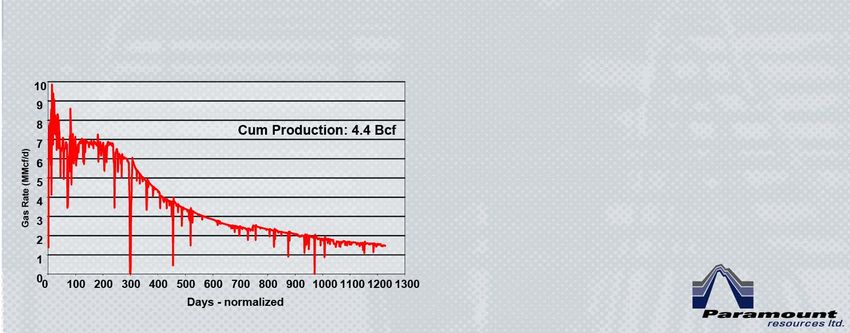
Core Areas

Average Production (Boe/d)              2013

Kaybob                              13,402
Grande Prairie                       4,459
Southern                             2,179
Northern                                874
Total Boe/d                         20,914

• 2014E capital expenditures: $650 MM
(including Strategic Investments)

                                                        4
Kaybob Resource
*Graphic courtesy of www.canadianoilstocks.ca
                                                                        Paramount Acreage:
                                                                        • 560 sections Cretaceous Rights
                                                                        • 394 Sections Montney Rights
                                                                        • 258 Sections Duvernay Rights

                                                                       • Deep Basin Liquids-rich gas
                                                                         resources in multiple stacked
                                                                         horizons
                                                                       • 40-160 Bcf/section
                                                                       • ~5+ Bcf EUR/Hz well (1)
                                                                       • >10 Tcf DGIIP net to PRL (1)

                                                                        • Liquids-rich Montney gas play
                                                                        • ~70+ Bcf /section DGIIP(1)
                                                                        • ~ 23 Tcf DGIIP + NGL (1)

                                                                      • Potential conventional Devonian
                                                                        exploration
                                                                      • Potential Duvernay Shale rock play

                                                (1) Internal estimates: EUR denotes Ultimate Estimated
                                                Recovery, DGIIP denotes Discovered Gas Initially In Place.
                                                Please refer to "Oil and Gas Measures and Definitions" in
                                                                                                             5
                                                the Advisories section of this presentation for further
                                                information.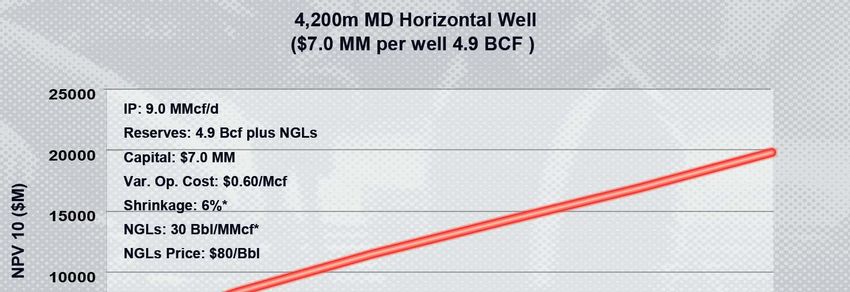
Dunvegan Hz Wells
                                      • Hz Dunvegan well at
                                        Resthaven
                                      • Tested 11.3 MMcf/d(1)
                                        at 6.2 MPa
                                      • IP: 8.3 MMcf/d
                                      • Producing ~1.5 MMcf/d
                                      • Cost: $8.3 MM d/c/t

                                                                                                                                        6

(1) Please refer to the heading "Test Results" in the Advisories section of this presentation for further information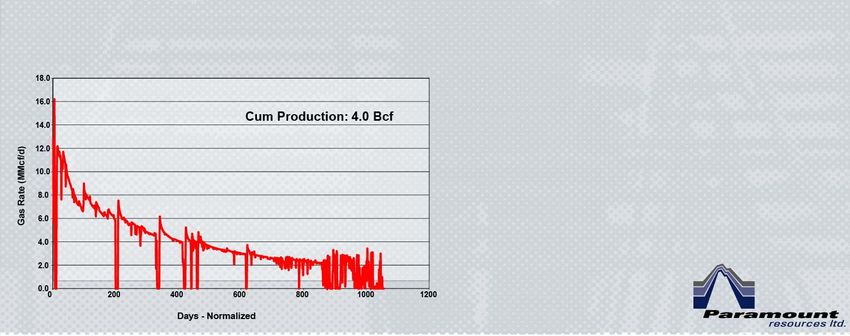
Falher Hz Wells

                                          • Hz Falher well at
                                            Musreau
                                          • Tested 16.4 MMcf/d(1)
                                            at 20.8 MPa
                                          • IP: 12 MMcf/d
                                          • Producing ~2 MMcf/d
                                          • Cost: $8.6 MM d/c/t

                                                                                                                                      7

(1) Please refer to the heading "Test Results" in the Advisories section of this presentation for further information
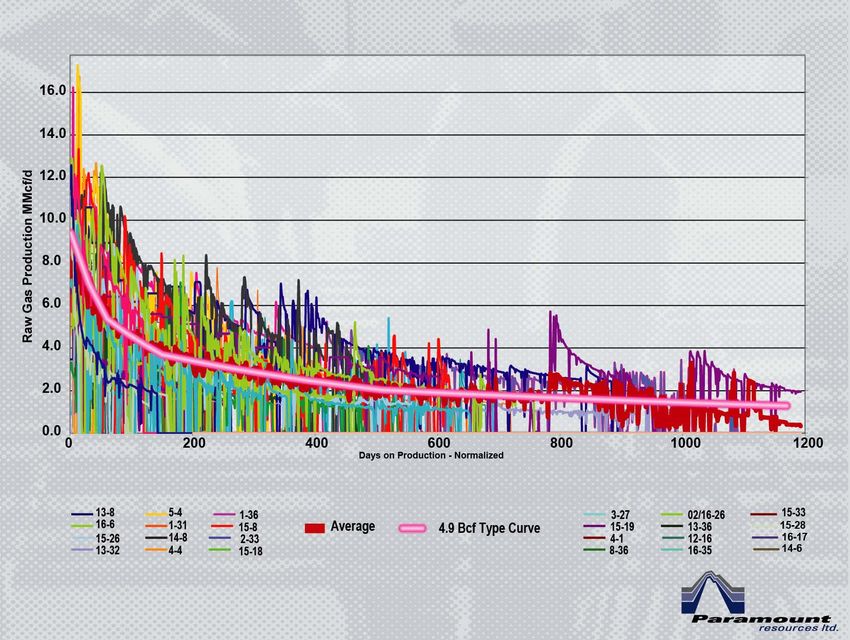
Falher Type Curve

                8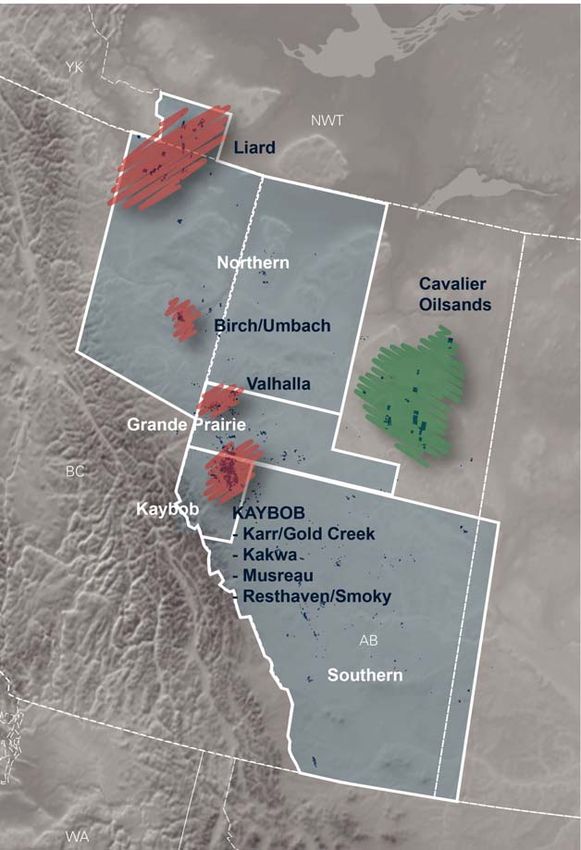
Economics of Kaybob 4.9 Bcf Horizontal Falher Well

                                                                                  9

* Based on processing through a refrigeration facility
Montney Gas Resource
 • Liquids-rich Montney gas play

 • Paramount holds ~325 net sections
   of Montney rights
 • 2011/2012 program included 12 Hz
   Montney wells: tested 5.5-15.4
   MMcf/d(1)
 • Montney 2013 program: Drilled 13
   wells; commenced drilling 25
   additional wells off 3 pads which
   are expected to rig release by mid
   2014
        • Four well Montney pad
           completed with combined test
           rates of 34 MMcf/d + NGLs(1)
 • Offset activity indicating exciting
   test rates of over 10 MMcf/d +
   NGLs

                                                                                                                        10

(1) Please refer to the heading "Test Results" in the Advisories section of this presentation for further information
Montney NGL Rates For Paramount well test results please refer to the heading "Test Results" in the Advisories section of this 11 presentation for further information. Test results from Competitor wells were obtained through publicly disclosed information.
3.7 Bcf Montney Type Curve

                                                                                 12

* Based on processing through a refrigeration facility
Montney Drilling/Completion Improvements
• Pad drilling/pad layout
• Bits/muds/motors
• Well design:
monobores/orientation/reservoir
placement
• Toe up/toe down: effects on production
• Natural gas fueled rigs
• Cemented liners/open-hole
packers (ECP’s)
• Plug and perf/sliding sleeves
• Frac sizing/spacing/clusters
• Frac fluid/fluid handling
• Pumping techniques
• Frac fluid recycling
• Proppants
• Flow back/production practices 13Fox Rig No 3
14Musreau
2014 Capital Plan
• Drill 25 (25 net)
horizontal Montney wells
• Start drilling 8 (8 net)
Montney pad wells
• Drill 3 (2.3 net)
horizontal Falher/Wilrich
wells
• Drill 4 (3.5 net) vertical
wells to hold lands
• Bring 70 (net) horizontal
wells on production
during 2014
15Karr
• Located 50 km SW of Grande
Prairie
• Multi-zone potential, including
Halfway, Montney sour and
Gething, Bluesky, Falher sweet
commingled gas
• Current lands ~93,500 net
acres (~146 sections)
• Average 78% working interest
• Expanded plant and gathering
systems to 40 MMcf/d
• Seven horizontal Middle
Montney wells now on
production
• 2014 Capital Plan:
•Drill 4 (3 net) horizontal
Cretaceous wells
•Drill 10 (9 net) horizontal
Montney wells
16
(1) Please refer to the heading "Test Results" in the Advisories section of this presentation for further informationKaybob Plant Capacity
Gross Net POU Est. Net
Raw Raw POU Sales
Capacity Capacity Capacity(1)
Current Capacity MMcf/d MMcf/d Boe/d
Musreau Refridge
45 45 8,500
Plant
Resthaven Plant 20 10 2,000
Smoky Plant 100 10 2,500
Kakwa Plant 40 4 700
Pembina Musreau
Processing Capacity 10 10 1,800
Subtotal 215 79 15,500
Capacity Under Construction
Musreau Phase II 200 200 50,000
Deep-Cut
Musreau Condensate
Stabilizer Expansion - - 15,000
Smoky/Resthaven
Deep-Cut 200 30 7,500
Subtotal 400 230 72,500
Projected Total 615 309 88,000
•Behind pipe well inventory at February 28, 2014; 66 (47.9 net) wells, 300 MMcf/d 17
(230 MMcf/d net) +NGL's
(1) Please refer to the heading “Estimated Net POU Sales Capacity” in the Advisories section for further information.Kaybob Processing Capacity (1) (2)
18Sales Turbines
1920
Process Flow Chart: Musreau Deep Cut Facility

                                                                            21
Note: Illustrative example
Based on indicative prices and differentials which are subject to change
Illustrative Deep-Cut
Mix of Cretaceous and Montney
Montney Wells Only Example
Wells Example
200 MMcf/d x 15% Shrinkage=170 200 MMcf/d x 23% Shrinkage=154
Price MMcf/d (28,333 Boe/d) Sales Gas MMcf/d (25,667 Boe/d) Sales Gas
100 Bbl/MMcf: 20,000 Bbl/d NGLs 150 Bbl/MMcf: ~30,000 Bbl/d NGLs
Deep-Cut Rich Gas $3.00/Mcf 170 MMcf/d $510,000 154 MMcf/d $462,000
Condensate $100.00/Bbl 8,000 Bbl/d $800,000 12,400 Bbl/d $1,240,000
Butane $65.00/Bbl 2,000 Bbl/d $130,000 2,500 Bbl/d $162,500
Propane $35.00/Bbl 4,000 Bbl/d $140,000 5,000 Bbl/d $175,000
Ethane $12.00/Bbl 6,000 Bbl/d $72,000 10,480 Bbl/d $125,760
Total: 48,333 Boe/d $1,652,000/day 56,047 Boe/d $2,165,260/day
Royalty 5% ($82,600/day) 5% ($108,260/day)
Operating Cost ($0.50/mcf) ($85,000/day) ($0.50/mcf) ($77,000/day)
$1,484,400/day $1,980,000/day
17.6 20.5
Total: $542 MM/year $723 MM/year
MMBoe/year MMBoe/year
$30.78/Boe $35.25/Boe
22Paramount Deep-Cut Montney - Illustrative Project Economics
• Paramount’s shallow rights will add substantially to the RLI
• Paramount has de-risked a substantial amount of its land base and
thus could have the potential to do this many times
• Simple Payout after start up is 1.5 - 2.3 years
Resource Needed:
200 MMcf/d x 365 ~ 73 Bcf/year x 10 year RLI = 730 Bcf
70 Bcf/section @ ~ 50% recovery = ~ 20 Sections
Cost
60 (5 MMcf/d wells) x $10 MM/well = $600 MM
Gas Plant = $200 MM
Total: $800 MM
Annual Deep - Cut Cash Flow $542 MM/year - $723 MM/year
Annual Capital = 20 (3.5 Bcf) wells x $10 MM/well $200 MM/year
Free Cash Flow $342 MM - $523 MM/year
23Pembina Peace Pipeline Expansion
LVP Capacity (Bbl/d) In-Service HVP Capacity (Bbl/d) In-Service
Current 155,000 80,000
Phase 1/2 Expansion 95,000 Q4 2013/2014 60,000 Q4 2013/2015
Phase 3 Expansion >225,000 2016/2017 >75,000 2016/2017
Total >475,000 >215,000
24Valhalla
• Montney/Doig/Boundary
Lake Play
• 16 wells tied in at
restricted rates
(midstream constraints)
• Currently tieing in to
additional midstream
capacity
• Gathering system
expansion and additional
compression completed
2012
• Focus on high-liquid
yield prospects at East
Valhalla
25
(1) Please refer to the heading "Test Results" in the Advisories section of this presentation for further information
(2) Based on results from Paramount's wells and publicly disclosed results of competitor wells.Birch
• Three Hz Montney wells on
production
• Production processed
through pilot facility limited
to 3 MMcf/d
• NGL yields average 60
Bbl/MMcf
• Four wells planned in
H2 2014
• Evaluating type curve/NGL
ratios to determine
economic viability
26PARAMOUNT INVESTMENTS
27Paramount Investments
19.1 MM shares of Trilogy @ $28.00/share ~$536 MM
54.1 MM MGM Energy Corp. shares @
~$9 MM
~$0.16/share
Fox Drilling Inc. ~$85 MM
3.7 MM shares of MEG Energy @ $34.00/share ~$126 MM
Other (Marquee, RMP, Strategic, Westbrick,
~$55 MM
etc)
Total ~$810 MM
Paramount shares outstanding 97.1 MM
Paramount investments/share ~$8.35/share
28CAVALIER ENERGY INC.
Cavalier Energy Inc.
• Created in December 2011

• Experienced team led by CEO Dr. Will Roach (ex UTS)

• Paramount has contributed its oilsands assets and seed
  capital to Cavalier Energy

• Funding at the Cavalier level will be via a combination of
  equity and debt

• Assets retained as 100% WI within Cavalier Energy

• Regulatory application for the development of the first
  10,000 Bbl/d SAGD project at Hoole filed November 2012 with
  approval anticipated Q2 2014

                                                                30
Cavalier Assets
• Approximately 320 sections
gross (316 net)
• Prospective primarily for
conventional oilsands,
bitumen in carbonates, and
cold-flow heavy oil
• Hoole Project: 100% WI
(1) Resource estimates are Best Estimates based on McDaniel
independent engineering reports dated as of October 31, 2011 for
Saleski, Granor and Orchid; April 30, 2010 for Eagles Nest; and 31
December 31, 2013 for Hoole. Please refer to "Oil Sands Measures and
Definitions" in the Advisories section of this presentation for oil
sands reserves, resources and related definitions (including NPV).Hoole Grand Rapids - 1st Project
Grand Rapids Reservoir
• Φ = 30 %, k = 1 to 4 D
• d = 250m, h ~ 20m, p = 1,500 kPa
• Viscosity = 200,000 to 2,000,000 cp
• McDaniel Best Estimate: DEBIP = 1.7 Billion
Bbl(1)
• 80 wells drilled to date; 42 cored
• 93 Million Bbl Probable Undeveloped
Reserves and 746 Million Bbl Best Estimate
Recoverable Contingent Resource(1)
• Probable Reserves NPV BT 10%:
$301 Million(1)
• Contingent Resource Best Estimate NPV
BT 10%: $1.5 Billion(1)
Kjoli_fou
250
Kgrand_rp
275
(1) Independent evaluation by McDaniel & Associates Consultants Ltd. effective December 31, 2013 32
Please refer to "Oil Sands Measures and Definitions" in the Advisories section of this presentation for oil sands reserves,
resources and related definitionsLIARD, NWT
33Liard Basin
• Drilled and completed b-40-I
• Clean-up test: ~5-14 MMcf/d(1)
• Completion of d-57-D/94-O-12
horizontal planned for later in 2014
• Liard Basin industry estimates(2):
• 170-500 Bcf / section OGIP
• ~20% expected recovery
• ~34-100 Bcf sales gas/section
• Paramount holds ~156 net sections
with production potential from the
Besa River shale gas formation
(1) Please refer to the heading "Test Results" in the Advisories section of this presentation for further information
(2) As recently publicly disclosed by a large U.S. public E&P company with significant landholdings in the Liard Basin. The
resource evaluation disclosed by such E&P company was not noted as having been prepared independently or by a qualified
reserves evaluator or auditor (as such terms are defined in NI 51-101) or in accordance with the COGE Handbook. This
34
information is relevant to Paramount’s landholdings in the Liard Basin as the information is in respect of landholdings in the
Liard Basin that are close to Paramount’s lands and are, accordingly, likely to have similar geology.Quarterly Operating Results
35Conventional Reserves
36
Columns may not add due to rounding. As these tables only cover conventional reserves they do not include any oil sands reserves
estimates. Nominal amounts of estimated reserves and future net revenues have been included for Paramount's initial shale gas well
at Patry, B.C.Summary
• Exposure to significant reserve opportunities
– Kaybob Deep Basin: Cretaceous, Montney
– Karr: Montney
– Valhalla: Montney, Doig
– Birch: Montney
• Significant asset value
– Trilogy
– MGM
– MEG Energy
– Cavalier Energy
– Horn River/Liard Shale Gas
• Paramount continues to provide long-term value creation for
shareholders
37ADVISORIES APPENDIX
38Advisories
Certain statements in this presentation constitute forward-looking information under applicable securities legislation. Forward-looking information typically contains
statements with words such as "anticipate", "believe", "estimate", "will", "expect", "plan", "intend", "propose", or similar words suggesting future outcomes or an outlook.
Forward looking information in this presentation includes, but is not limited to:
projected production volumes and growth and the timing thereof; forecast capital expenditures; exploration, development and associated operational plans and
strategies and sales, (including planned drilling programs, well tie ins and potential future facility expansions and additions, and the anticipated timing of and/or
sources of funding for); projected timelines for, and anticipated costs of, constructing, commissioning and/or starting-up new and expanded deep cut natural gas
processing and associated facilities, and the Kaybob COU’s processing capacity following the completion of the deep cut facilities; the projected liability of third
party processing, transportation, fractionation, de-ethanization and other facilities; reserves and resources estimates (including internal estimates of DGIIP and EUR
related to Paramount properties and estimated net present values of oil sands reserves and resources); illustrative deep-cut processing economics and process
flows (including the commodity price, royalty rate, capital and operating cost, production volume, NGLs yield, well reserves, reserve life index, cash flow and payout
assumptions used therein); Paramount’s potential ability to build and utilize additional deep cut processing facilities; projected type well production profiles and net
present value estimates (and the initial production rate, reserves, capital and operating cost, shrinkage, NGLs yield and NGLs pricing assumptions used to generate
such estimates); approvals for the initial phase of Cavalier Energy’s Hoole Grand Rapids oil sands development project; and general business strategies and
objectives.
Such forward-looking information is based on a number of assumptions which may prove to be incorrect. Assumptions have been made with respect to the following
matters, in addition to any other assumptions identified in this presentation or Paramount’s continuous disclosure documents:
future oil, bitumen, natural gas, NGLs and other commodity prices; royalty rates, taxes and capital, operating, general & administrative and other costs; foreign
currency exchange rates and interest rates; general economic and business conditions; the ability of Paramount to obtain the required capital to finance its
exploration, development and other operations; the ability of Paramount to obtain equipment, services, supplies and personnel in a timely manner and at an
acceptable cost to carry out its activities; the ability of Paramount to secure adequate product processing, transportation, fractionation, de-ethanization and storage
capacity on acceptable terms; the ability of Paramount to market its oil, bitumen, natural gas and NGLs successfully to current and new customers; the ability of
Paramount and its industry partners to obtain drilling success (including in respect of anticipated production volumes, reserves additions and NGLs yields) and
operational improvements, efficiencies and results consistent with expectations; the timely receipt of required governmental and regulatory approvals, and
anticipated timelines and budgets being met in respect of drilling programs and other operations (including well completions and tie-ins and the construction,
commissioning and start-up of new and expanded facilities).
Although Paramount believes that the expectations reflected in such forward looking information are reasonable, undue reliance should not be placed on them as
Paramount can give no assurance that such expectations will prove to be correct. Forward-looking information is based on current expectations, estimates and
projections that involve a number of risks and uncertainties which could cause actual results to differ materially from those anticipated by Paramount and described in
the forward-looking information. These risks and uncertainties include and/or relate (but are not limited) to:
fluctuations in oil, bitumen, natural gas, NGLs and other commodity prices; changes in foreign currency exchange rates and interest rates; the uncertainty of
estimates and projections relating to future revenue, future production, NGLs yields, royalty rates, taxes and costs and expenses; the ability to secure adequate
product processing, transportation, fractionation , de-ethanization and storage capacity on acceptable terms; operational risks in exploring for, developing and
producing crude oil, bitumen, natural gas and NGLs; the ability to obtain equipment, services, supplies and personnel in a timely manner and at an acceptable cost;
potential disruptions or unexpected technical or other difficulties in designing, developing, expanding or operating new, expanded or existing facilities (including third
party facilities); industry wide processing, pipeline, de-ethanization, and fractionation infrastructure outages, disruptions and constraints; risks and uncertainties
involving the geology of oil and gas deposits; the uncertainty of reserves and resources estimates (including internal estimates of DGIIP and EUR); the ability to
generate sufficient cash flow from operations and obtain financing at an acceptable cost to fund planned exploration, development and operational activities and
meet current and future obligations (including costs of anticipated new and expanded facilities and other projects and product processing, transportation,
fractionation, de-ethanization and similar commitments); changes in, or in the interpretation of, laws, regulations or policies (including environmental laws); the
ability to obtain required governmental or regulatory approvals in a timely manner and to enter into and maintain leases and licenses; general business, economic
and market conditions; the effects of weather; the timing and costs of future abandonment and reclamation obligations and potential liabilities for environmental
damage and contamination; uncertainties regarding aboriginal claims and in maintaining relationships with local populations and other stakeholders; the outcome of
existing and potential lawsuits, regulatory actions, audits and assessments; and other risks and uncertainties described elsewhere in this presentation and in
Paramount’s other filings with Canadian securities authorities, including its Annual Information Form.
39Advisories cont’d
The foregoing list of risks is not exhaustive. Additional information concerning these and other factors which could impact Paramount are included in Paramount’s
most recent Annual Information Form. The forward-looking information contained in this presentation is made as of the date hereof and, except as required by
applicable securities law, Paramount undertakes no obligation to update publicly or revise any forward-looking statements or information, whether as a result of new
information, future events or otherwise.
Oil and Gas Measures and Definitions
This presentation contains disclosure expressed as "Boe" and "Boe/d". All oil and natural gas equivalency volumes have been derived using the ratio of six
thousand cubic feet of natural gas to one barrel of oil. Equivalency measures may be misleading, particularly if used in isolation. A conversion ratio of six thousand
cubic feet of natural gas to one barrel of oil is based on an energy equivalency conversion method primarily applicable at the burner tip and does not represent a
value equivalency at the well head. During the third quarter of 2013, the value ratio between crude oil and natural gas was approximately 25:1. This value ratio is
significantly different from the energy equivalency ratio of 6:1. Using a 6:1 ratio would be misleading as an indication of value.
This presentation contains internal estimates of Discovered Gas Initially in Place ("DGIIP") and Estimated Ultimate Recovery ("EUR"). DGIIP means that quantity of
gas that is estimated, as of a given date, to be contained in known accumulations prior to production. The recoverable portion of DGIIP includes production,
reserves and contingent resources; the remainder is unrecoverable. EUR means those quantities of oil or gas which are estimated, on a given date, to be
potentially recoverable from an accumulation, plus those quantities of oil or gas already produced therefrom. DGIIP is the most specific category that could be
assigned to the applicable gas resource. There is no certainty that it will be commercially viable to produce any portion of this DGIIP
Conventional reserve estimates include nominal amounts of volumes and future net revenues related to Paramount’s completed shale gas well. The estimates of
reserves and future net revenue for individual properties may not reflect the same confidence level as estimates of reserves and future net revenue for all
properties, due to the effects of aggregation. In addition, estimates of future net revenue do not represent fair market value.
Non-GAAP Measures
In this presentation “Net Debt” and “Funds Flow” (collectively, the “Non-GAAP measures”) are used and do not have any standardized meanings as prescribed by
GAAP. Net Debt is a measure of a company's overall debt position after adjusting for certain working capital amounts and is used by management to assess a
company’s overall leverage position. Funds flow refers to cash from operating activities before net changes in operating non-cash working capital, geological and
geophysical expenses and asset retirement obligation settlements. Funds flow is commonly used in the oil and gas industry to assist management and investors in
measuring a company’s ability to fund capital programs and meet financial obligations. Non-GAAP measures should not be considered in isolation or construed as
alternatives to their most directly comparable measure calculated in accordance with GAAP, or other measures of financial performance calculated in accordance
with GAAP. The Non-GAAP measures are unlikely to be comparable to similar measures presented by other issuers.
40Advisories cont’d
Test Results
Kaybob test rates represent the Kaybob test rates disclosed in this document represent the average rate of gas-flow during the post clean-up production testing at the
largest choke setting. The flow tests typically range from 12 to 72 hours in duration.
Karr-Gold Creek and Valhalla test rates represent the average rate of gas-flow during the last 12 hours of post-clean up production testing up 2 7/8” tubing.
The Liard Basin Besa River b-40-I well flowed on clean-up during the first week of March 2013 and was then shut-in pending completion . Over the first 69 hours of
metered gas flow natural gas rates ranged between 5 MMcf/d and 14 MMcf/d and completion fluid recoveries averaged approximately 4,000 Bbl/d at flowing tube
pressures of 11,000 to 35,000 kPa up 114.3 mm tubing. During the final 24 hours of this period natural gas rates averaged 7 MMcf/d and completion fluid recovery
was approximately 2,800 Bbl/d at an average flowing tubing pressure of approximately 11,500 kPa.
Pressure transient analyses and well-test interpretations have not been carried out for any of these wells and, as such, all data should be considered preliminary until
such analyses or interpretations have been done. Liquids yields have not been included in the Kaybob, Karr-Gold Creek and Valhalla test results as the bulk of the
tested wells were fracture stimulated using frac oil with the result that substantially all liquids recovered during the test period were load fluid. Test results are not
necessarily indicative of long-term performance or of ultimate recovery.
Estimated Net POU Sales Capacity
The term “Estimated Net POU Sales Capacity”, as used on slide 16 of this presentation, means the estimated volumes of saleable natural gas and NGLs (expressed
on a combined basis in Boe/d) that would result from the processing of the associated quantities of raw gas set out in the "Net POU Raw Capacity" column in the
table on slide 16. These volumes will include working interest partner volumes that are commingled with Paramount's. These estimates are subject to certain
assumptions and should not be construed as projections of Paramount's Kaybob area production volumes at or by any particular date or dates as these volumes will
depend on, and be subject to, a number of factors and contingencies as set out elsewhere in these Advisories.
Oil Sands Measures and Definitions
This presentation contains disclosure of certain results of (i) an updated independent evaluation by McDaniel of Cavalier Energy Inc.’s (“Cavalier’s”) bitumen reserves
and resources in the Grand Rapids formation in Cavalier’s Hoole oil sands property as of December 31, 2013; (ii) an independent evaluation by McDaniel of
Cavalier’s bitumen resources in its Saleski and other carbonate bitumen properties (House, Orchid and Granor) as of October 31, 2011; and (iii) an independent
evaluation by McDaniel of Cavalier's bitumen resources in its Eagle Nest oil sands property as of April 30, 2010 (collectively, the “McDaniel Evaluations”).
Specifically, this presentation includes McDaniel’s assessment as of December 31, 2013 of Cavalier’s probable reserves, best estimate economic contingent
resources and discovered exploitable bitumen in place in the Grand Rapids formation at Hoole (and the estimated net present value of these probable reserves and
economic contingent resources); McDaniel’s best estimate as of October 31, 2011 of Cavalier’s contingent resources (technology under development) in its Saleski
carbonate bitumen property and of the discovered and undiscovered exploitable bitumen in place at Saleski and Cavalier’s other carbonate bitumen properties; and
McDaniel's best estimate as of April 30, 2010 of Cavalier's discovered and undiscovered bitumen in place in its Eagle's Nest property. These terms, as used in the
McDaniel Evaluations, have the following meanings:
“Probable reserves” are reserves that are less certain to be recoverable than proved reserves. Specifically, whereas proved reserves are reserves that can be
estimated with a high degree of certainty to be recoverable (i.e. it is likely that the actual remaining quantities recovered will exceed the estimated proved reserves),
in the case of probable reserves it is equally likely that the actual quantities recovered will be greater or less than the estimated probable reserves (or where there are
both proved and probable reserves the sum of the estimated proved plus probable reserves).
"Contingent resources" are those quantities of bitumen resources estimated, as of a given date, to be potentially recoverable from known accumulations using
established technology or technology under development, but which are classified as resources rather than reserves due to one or more contingencies, such as the
absence of regulatory applications, detailed design estimates or near term development plans. "Economic contingent resources" are a sub-category of contingent
bitumen resources that are considered to be currently economically recoverable based on the reserves evaluator’s then current forecasts of commodity prices and
costs.
41Advisories cont’d
At Hoole, a portion of Cavalier’s economic contingent resources were re-classified by McDaniel as probable reserves in McDaniel's evaluation effective as of
December 31, 2012 by virtue of Cavalier having finalized its plans for a pilot project and submitted a regulatory application for this pilot project. Cavalier will need to
finalize plans for the commercial development of the balance of the Hoole oil sands properties and submit regulatory applications for their development before the
balance of Cavalier's contingent resources at Hoole can be re-classified as probable reserves. These same contingencies will also have to be overcome in the case
of the Saleski carbonate bitumen property in order for Cavalier’s contingent resources in this property to be re-classified as probable reserves. In addition, as
sustained commercial production has not yet been obtained from any carbonate bitumen reservoirs, it will also be necessary in the case of the Saleski property to
demonstrate the successful application of SAGD or other production technology to the Saleski reservoir (or a reasonable analog thereof). It is for this reason that
Cavalier’s bitumen resources at Saleski are referred to as “contingent resources (technology under development)”. There is no certainty that it will be commercially
viable to produce any portion of Cavalier’s contingent resources at either Hoole or Saleski.
"Discovered bitumen in place" or "DBIP" (equivalent to discovered resources) is the aggregate quantity of bitumen that is estimated, as of a given date, to be
contained in a known accumulation prior to production. To qualify as “discovered exploitable bitumen in place" or "DEBIP" these volumes must be contained in a
reservoir that meets or exceeds certain characteristics, such as minimum continuous net pay, porosity and mass bitumen content. DBIP or DEBIP volumes that are
considered to be recoverable as of a given date are classified as reserves or contingent resources (with the remaining DBIP or DEBIP volumes being those that are
considered to be unrecoverable as of that date).
"Undiscovered bitumen in place" or "UDBIP" (equivalent to undiscovered resources) is the aggregate quantity of bitumen that is estimated, as of a given date, to be
contained in accumulations that have yet to be discovered. To qualify as “undiscovered exploitable bitumen in place” or "UDEBIP" these volumes must have been
mapped using known data points penetrating the applicable subsurface stratigraphic intervals and possess definitive geophysical log data along with seismic data
and regional mapping.
At Hoole, DEBIP volumes have been ascribed by McDaniel to those portions of the Grand Rapids formation where they felt minimum continuous net pay, porosity,
mass bitumen content and other reservoir characteristics allowed for the commercial application of known recovery technologies.
For Saleski and the other carbonate bitumen properties, DEBIP volumes have been restricted to those portions of the reservoirs that have a minimum thickness of
10 meters of substantially clean, continuous predominantly bitumen-saturated carbonate with log porosity of at least 10 percent and bitumen saturation greater than
50 percent, and with competent top and lateral reservoir containment. In addition, DEBIP volumes have generally been limited to areas within one mile of known
data points that penetrate the applicable stratigraphic intervals and possess definitive geophysical log data. However, in certain circumstances DEBIP volumes have
been assigned to areas outside these one mile limits were it was felt that reservoir continuity existed between offsetting data points.
There is no certainty that it will ever be commercially viable to produce any portion of: (i) the DEBIP at Hoole or at Saleski or any of the other carbonate bitumen
properties; or (ii) the DBIP at Eagles Nest. There is also no certainty that any of the UDEBIP at Saleski and the other carbonate bitumen properties, or the UDBIP at
Eagles Nest, will ever be discovered, or if it is discovered that it will ever be commercially viable to produce any portion of it.
"Best estimate" is considered to be the best estimate of the quantity of contingent resources that will actually be recovered. It is equally likely that the actual
remaining quantities recovered will be greater or less than the best estimate (or stated another way, there is a 50 percent confidence level that the actual quantities
recovered will equal or exceed the best estimate amount).
“Net present value” or “NPV” of Cavalier’s probable undeveloped reserves and economic contingent reserves at Hoole represents McDaniel’s estimates of
Cavalier’s share of future net revenues, before the deduction of income taxes, from these reserves and resources discounted at 10%. In calculating these NPVs
McDaniel considered items such as revenues, royalties, operating costs, abandonment costs and capital expenditures (but excluded financing and general and
administrative costs). Their calculations assume natural gas is used as a fuel for steam generation, and are based on their forecast commodity prices as of January
1, 2014 and forecast costs as of December 31, 2013. Royalties were calculated based on Alberta’s Royalty Framework applicable to oil sands projects. McDaniel’s
estimated NPVs do not represent fair market value.
424700 Bankers Hall West
888 Third Street S.W.
Calgary, Alberta
Canada T2P 5C5
Telephone: (403) 290-3600
Facsimile: (403) 262-7994
www.paramountres.com
43You can also read