Emotional regulation neural circuitry abnormalities in adult bipolar disorder: dissociating effects of long-term depression history from ...
←
→
Page content transcription
If your browser does not render page correctly, please read the page content below
Bertocci et al. Translational Psychiatry (2020)10:374
                                    https://doi.org/10.1038/s41398-020-01048-1                                                                                                     Translational Psychiatry

                                     ARTICLE                                                                                                                                                    Open Access

                                    Emotional regulation neural circuitry abnormalities
                                    in adult bipolar disorder: dissociating effects of
                                    long-term depression history from relationships
                                    with present symptoms
                                    Michele A. Bertocci 1, Jeffrey Bergman1, Joao Paulo Lima Santos1, Satish Iyengar2, Lisa Bonar1, Mary Kay Gill1,
                                    Halimah Abdul-waalee1, Genna Bebko1, Richelle Stiffler1, Jeanette Lockovich1, Haris Aslam1, Cecile Ladouceur 1,
                                    John Merranko1, Rasim Diler1, Boris Birmaher1, Amelia Versace1 and Mary L. Phillips 1

                                      Abstract
                                      Bipolar disorder (BD) is common and debilitating and confounding effects of depression history on neural activity in
                                      BD are unknown. We aimed to dissociate neural activity reflecting past depression-load vs. present symptom severity
                                      using the Course and Outcome of Bipolar Youth (COBY), a prospective longitudinal cohort study of pediatric-onset BD.
                                      In n = 54 COBY (18–32 years), we modeled depression scores over time (up to 17.5 years) using a standardized
                                      autoregressive moving average (ARMA) model, followed by k-means cluster analysis. N = 36 healthy participants (HC,
                                      20–36 years) were included. Using two factorial analyses, we parsed the impact of ARMA-defined past depression-load
                  1234567890():,;
1234567890():,;
                  1234567890():,;
1234567890():,;

                                      on neural activity from the impact of current symptoms on neural activity (p < 0.001, k > 30) and examined
                                      relationships with past and present symptoms (ps FDR-corrected). ARMA identified three COBY groups based on past
                                      depression-load. ARMA-defined COBY participants with the greatest past depression-load vs. other groups showed
                                      greater activity in right temporoparietal junction, thalamus, insula, premotor cortex, left fusiform gyrus, bilateral
                                      precuneus and cerebellum. In contrast, BD-COBY participants vs. HC showed greater activity in left hippocampus,
                                      dorsolateral prefrontal cortex, and right somatosensory cortex, plus the above thalamus, premotor cortex and
                                      cerebellum; activity positively correlated with present symptom severity in most regions. Past depression-load was
                                      related to social cognition and salience perception network activity, potentially reflecting heightened attention to
                                      socially relevant distracters, while present symptoms were associated with emotion processing and reappraisal
                                      network activity, potentially reflecting abnormal emotional experience and regulation. Differentiating aberrant neural
                                      activity related to long-term depression vs. present affective symptoms can help target interventions to networks
                                      associated with pathophysiological processes, rather than long-term illness effects.

                                    Introduction                                                                                        time, depressive episodes in BD often become more
                                      Bipolar disorder (BD) is a complex psychiatric illness                                            frequent, and of longer duration1, probably because
                                    characterized by affective lability and emotional dysre-                                            prescribed medications are often more effective for
                                    gulation, associated with depression and mania. Over                                                hypo/manic than depressive episodes2,3. Indeed,
                                                                                                                                        depressive episodes in BD are usually 50% longer than
                                                                                                                                        manic episodes4. This increase in the magnitude and
                                    Correspondence: Michele A. Bertocci (bertoccima@upmc.edu)
                                    1                                                                                                   severity of depression over time is associated with pre-
                                     Department of Psychiatry, Western Psychiatric Hospital, University of
                                    Pittsburgh School of Medicine, University of Pittsburgh, Pittsburgh, PA, USA                        mature death, functional impairment, medical and
                                    2
                                     Department of Statistics, University of Pittsburgh, Pittsburgh, PA, USA

                                    © The Author(s) 2020
                                                        Open Access This article is licensed under a Creative Commons Attribution 4.0 International License, which permits use, sharing, adaptation, distribution and reproduction
                                                        in any medium or format, as long as you give appropriate credit to the original author(s) and the source, provide a link to the Creative Commons license, and indicate if
                                    changes were made. The images or other third party material in this article are included in the article’s Creative Commons license, unless indicated otherwise in a credit line to the material. If
                                    material is not included in the article’s Creative Commons license and your intended use is not permitted by statutory regulation or exceeds the permitted use, you will need to obtain
                                    permission directly from the copyright holder. To view a copy of this license, visit http://creativecommons.org/licenses/by/4.0/.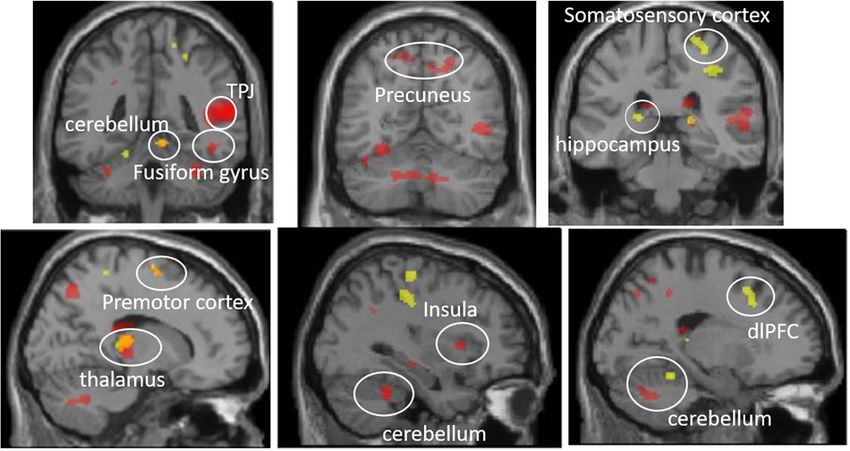
Bertocci et al. Translational Psychiatry (2020)10:374                                                           Page 2 of 9

psychiatric comorbidities, reduced quality of life5 and an     groups characterized by the degree of long-term past
estimated annual cost of $202 billion6.                        depression-load, we hypothesized that relative to BD-
  A growing number of studies has aimed to identify            COBY participants with lower past depression-load, BD-
neural circuity abnormalities in BD in order to elucidate      COBY participants with greater past depression-load
underlying pathophysiological processes to facilitate          would show a greater magnitude of abnormal activity in
identification of neural targets to guide the development       neural circuitries relevant to BD, including emotional
of new interventions for BD (e.g., neuromodulation, and        regulation circuitry10; and patterns of past depression-
novel cognitive behavior therapies (CBT) and medica-           load-related abnormal neural activity would be distinct
tions). Findings from these studies indicate patterns of       from patterns of abnormal neural activity associated with
significantly greater and lower activity in BD vs. healthy      present BD symptom severity in COBY participants.
adults in several neural regions implicated in emotion
regulation, including prefrontal cortex7–12, amygdala7,9,10,   Methods
insula, thalamus, and hippocampus11,12 in individuals          Participants
with BD. Yet, the potentially confounding effect of long-        Pediatric-onset BD COBY participants (n = 54) were
term depression, and other factors, such as long-term          clinically followed for up to 17.5 years prior to neuroi-
medication, on neural circuitry supporting key processes       maging assessment; weeks prior to scan: range =
relevant to understanding the pathophysiology of BD,           104–908 weeks mean (standard deviation (SD)) = 696.9
including emotional regulation, are not clearly under-         (164.5), age: range = 18.9–32.7, mean (SD) = 25.60 (4.0),
stood and have not, to our knowledge, been examined.           42 females. Thirty-six statistically matched Healthy adult
Dissociating past depression-load from present symptom-        participants (HC) were used as the comparison group (12
related patterns of abnormal emotional regulation neural       newly recruited participants and 24 from the Dimensions
activity in BD is thus an important goal in neuroimaging       of Affect, Mood, and Neural Activity Associated with
research in BD. Meeting this goal will first provide a          Distress study, R01MH100041) mean age = 25.92 (4.96),
broader understanding of the pathophysiological pro-           19 females (Table 1). Institutional Review Boards
cesses related to different past depression trajectories in    approved both studies and all participants gave the con-
BD. Meeting this goal will also facilitate appropriate tar-    sent to participate.
geting of neuromodulation interventions to neural regions
implicated specifically in pathophysiological processes of      Clinical assessments
BD, vs. targeting these interventions to neural regions in       At each follow-up, COBY participants were assessed for
which abnormal activity reflects long-term illness effects.     longitudinal changes in DSM-IV symptoms and func-
To date, these goals have been difficult to achieve because     tioning using the A‐LIFE Psychiatric Rating Scale (PSR)14.
of limited information regarding long-term past psychia-       For this analysis we focused on depression, mania,
tric history in most neuroimaging studies of BD.               hypomania, and generalized anxiety symptoms with PSR
  The Course and Outcome of Bipolar Youth (COBY)               scores ranging from 1 to 6; 1–2 = no/minimal symptoms,
study is a prospective naturalistic examination of             to 3–4 = varying levels of subthreshold symptoms and
pediatric-onset (
Bertocci et al. Translational Psychiatry (2020)10:374                                                                             Page 3 of 9

Table 1 Clinical and demographic information.                                    (range: 1–6) in the A-LIFE. Historically, data collection
                            BD             HC
                                                                                 was scheduled semiannually until the most recent funding
                            n = 54         n = 36         Test statistic   p     cycle, which scheduled data collection every 18 months
                                                                                 (mean time between assessments = 12.5 months (range:
Age                         25.60 (4)      25.9 (5)       t(87) = 0.334 0.839
                                                                                 2.07–41.95 months)). Given that data were timeseries
Sex (female)                27             19             chi2 = 0.029  0.865
                                                                                 with serial dependence, and the large volume of
IQ                          102.4 (11.1)   104.3 (13.3)   t(39) = −0.49 0.626
Diagnosis at scan
                                                                                 individual-level data (up to 908 datapoints), we utilized
   Bipolar disorder I       49             0              n/a                    autoregressive moving average (ARMA) to summarize
   Bipolar disorder II      5                                                    individual weekly depression scores, we utilized the aug-
   Anxiety disorder         24             0              n/a                    mented Dickey−Fuller test for stationarity. ARMA mod-
   ADHD                     17             0              n/a                    els are a validated approach for analyzing stationary
   Substance use            16             0              n/a                    timeseries data (consistent mean and variance over time)
   disorder
                                                                                 (see Supplementary information). We used the “arima() in
   Years in study           13.4 (3.16)
                                                                                 R stats package” to generate the ARMA models19. Given
Present-scan-day            11             0              n/a
   medication                                                                    the individual nature of ARMA models and the interest in
   Antidepressant/ mood     7              0              n/a                    group-level information, we used k-means clustering to
   stabilizer                                                                    group the autoregressive (AR) coefficients that reflects the
   Antipsychotic            6              0              n/a
                                                                                 “memory” of the model and can inform our under-
   Stimulant                3              0              n/a
                                                                                 standing of depression history. Clustering/grouping of the
High/persistent past
   medication use                                                                AR coefficients was performed by comparing the results
   Antidepressant           20             0              n/a                    of 2, 3, 4, and 5 k-means clusters. To validate this
   Lithium                  15             0              n/a                    approach, we then compared the number of DSM-IV-
   Non-lithium mood         13             0              n/a                    criteria-defined depressive episodes for individuals in each
   stabilizer
                                                                                 ARMA-defined-COBY group.
   Antipsychotic            18             0              n/a
   Stimulant                15             0              n/a
                                                                                   Mania, hypomania, and generalized anxiety history
Study intake information                   0              n/a                    loads were explored using percent of recorded time with a
   Age of bipolar onset     8.41 (3.7)     0              n/a                    threshold PSR score. Past manic load (PSR score ≥ 5;
   Duration of illness      4.02 (2.5)     0              n/a                    range = 0−0.14 of total weeks; mean (SD) = 0.01 (0.023)
   at intake                                                                     of total weeks), past hypomanic load (PSR score ≥ 5;
   Lifetime diagnosis                                                            range = 0−0.935 of total weeks; mean (SD) = 0.04 (0.14)
   Generalized anxiety      14/51          0              n/a
   disorder                                                                      of total weeks), and past anxiety load (PSR score ≥ 5;
   ADHD                     33/51          0              n/a                    range = 0–1 of total weeks; mean (SD) = 0.16 (0.25) of
   Conduct disorder         4/51           0              n/a                    total weeks).
   Oppositional defiant      25/51          0              n/a                      Past depression and mania severity trajectories were
   disorder                                                                      calculated using Mplus20 (number of follow-up assess-
   Substance Use            3/51           0              n/a
   disorder                                                                      ments range: 5–24 assessments).
   CGAS range 41–85         60.02 (10.5)   0              n/a                      Variables not meeting model assumptions were trans-
                                                                                 formed, or nonparametric tests were used.
See Supplementary information for comparisons between clusters of significant
activity with BD subtype: BD type I (BDI) and BD type II (BDII) (Supplementary
Tables 1 and 2); and present-scan-day and historical medication (Supplementary
results). Data are mean (standard deviation) or count as appropriate.
CGAS Children’s Global Assessment Scale, ADHD attention deficit hyperactivity     Aim 2
disorder.                                                                          To identify wholebrain activity related to depression-
                                                                                 load groups, a full factorial model (number of ARMA-
Present-scan-day symptoms                                                        defined COBY groups and HC by 3, 2-back emotional face
  To measure present-scan-day depression, manic, and                             distracter conditions: 2-back fear, 2-back happy, 2-back
anxiety symptom severity, all participants completed on                          neutral) was performed in SPM12 (F > 8.0, p < 0.001, k >
scan-day, respectively, the Hamilton Depression Rating                           30). Parameter estimates were extracted from clusters
Scale 16, Young Mania Rating Scale 17, and the Spielberger                       showing a significant main effect of group, and/or group-
State Trait Anxiety Inventory (Adult Version)18.                                 by-condition interaction, in the full factorial model.
                                                                                 ANCOVA, covaried for age and gender, and pairwise
Data analysis                                                                    comparisons evaluated the direction of between-group
Aim 1                                                                            differences in activity in these clusters to each condition.
  Weekly depressive symptoms were collected for up to                            FDR-corrected threshold21 accounted for the number of
17.5 years prior to fMRI scanning, using the PSR scale                           parallel between-group tests.
Bertocci et al. Translational Psychiatry (2020)10:374 Page 4 of 9
Aim 3 compared the ARMA-defined groups with a classical
To identify significant differences in wholebrain activity definition of depression severity (numbers of past clini-
between BD-COBY participants (as a whole) and HC, we cally depressive episodes) to confirm the use of our
compared the BD-COBY sample (n = 54) and HC (n = approach and to aid the understanding of findings.
36) (2 groups by 3, 2-back emotional face distracter ARMA-defined COBY Group 1 showed the lowest past
conditions: 2-back fear, 2-back happy, 2-back neutral), depression-load (n = 27): a range of 0–7 depressive epi-
using SPM12 (p < 0.001, k > 30). Parameter estimates were sodes (mean = 1.70 (1.81) episodes). ARMA-defined
extracted from clusters showing a significant main effect COBY Group 2 (n = 12) had a range of 0–8 episodes
of group, and/or group-by-condition interaction, in the (mean = 2.25 (2.26) episodes). ARMA-defined COBY
full factorial model. ANCOVA, covarying for age and Group 3 showed the greatest past depression-load (n =
gender, evaluated the direction of between-group/inter- 15): range of 1–11 episodes (mean = 4.13 (3.09) episodes).
action effects. We then examined, across all participants, ARMA-defined COBY Group 3 reported significantly
relationships between present-scan day depression, more past depressive episodes than ARMA-defined
mania, and anxiety severity and extracted parameter COBY Group 1 and Group 2 (F(2,51) = 5.36, p = 0.008).
estimates from the clusters of activity that differed ARMA-defined COBY Groups 1 and 2 did not differ
between groups or showed an interaction, using correla- significantly in the number of past depressive episodes.
tion analyses, and FDR-corrected threshold21 for the
number of parallel cluster-symptom relationships, Aim 2
accounting for the number of BD-COBY vs. HC between- There was a main effect of group (three ARMA-defined
group tests in these clusters. COBY groups and HC) on activity during all 2-back with
face distracter conditions (2-back fear, 2-back happy, 2-
Specificity analyses back neutral): right temporoparietal junction (F(3,258) =
Visual inspection of the overlap and differences in 16.24); right thalamus (F(3,258) = 10.35); right premotor
neural maps generated from each group-level analysis cortex (F(3,258) = 8.94); left fusiform gyrus (F(3,258) =
was performed using xjview (https://www.alivelearn.net/ 9.67); right insula (F(3,258) = 4.03); and bilateral pre-
xjview). cuneus (BA7; left:F(3,258) = 8.59, right: F(3,258) = 12.40),
To assess the specificity of our findings, correlation or t cerebellum (left: F(3,258) = 9.24, right: F(3,258) = 10.48
test analyses examined: (1) relationships between main and right: F(3,258) = 10.45); all Fs > 8.0, p values < 0.001,
effect of group or interaction activity in the ARMA- k > 30. There was no significant activity for the group-by-
defined-COBY group vs. HC model and present-scan-day condition interaction.
depression, mania and anxiety severity, with FDR- ANCOVA and t tests on extracted parameter estimates
corrected threshold21; and (2) main effect of group or covarying for age and gender (FDR-corrected p value =
interaction activity in the BD-COBY participant vs. HC 0.01068421; 10 clusters-by-6 between-ARMA-defined-
model and membership derived from the ARMA-defined- group tests = 60 tests) revealed significantly greater activ-
COBY analysis, with FDR-corrected threshold21. ity predominantly for ARMA-defined Group 3 vs. other
groups in the majority of clusters (Fig. 1 and Table 2).
Exploratory analyses
t tests and correlational analyses examined the effects of Aim 3
medication (present-scan-day/past medication use), mood BD-COBY relative to HC had greater activity in left
disorder age-of-onset, lifetime comorbid history (i.e., dorsolateral prefrontal cortex (dlPFC F(1,264 = 13.05),
generalized anxiety disorder (GAD), attention deficit left hippocampus (F(1,264) = 15.86), right thalamus (F
hyperactivity disorder (ADHD), conduct disorder (CD), (1,264) = 22.29), right somatosensory cortex (F(1,264) =
oppositional defiant disorder (ODD)), illness history loads 14.76) and right premotor cortex (F(1,264) = 17.82), and
(mania, hypomania, and generalized anxiety), and bilateral cerebellum (left: F(1,264) = 16.91; right: F(1,264)
depression and hypo/mania severity trajectories on = 15.83) during all 2-back with face distracter conditions
extracted parameter estimates from activity differing (2-back fear, 2-back happy, 2-back neutral): all ps < 0.001,
between groups in both of the above analyses. k > 30. There was no significant activity for the group-by-
condition interaction.
Results ANCOVA and t tests on extracted parameter estimates
Aim 1 confirmed the above direction of the between-group
We standardized the ARMA parameters for each par- findings, covarying for age and gender. In all BD-COBY
ticipant (AR = 4, MA = 2). The four AR “memory” coef- participants, present-scan-day depression severity was
ficients optimally produced three groups from k-means positively associated with left hippocampal (rho = 0.41,
clustering; all clusters p < 0.001. We additionally p ≤ 0.001), right thalamus (rho = 0.29, p = 0.006), leftBertocci et al. Translational Psychiatry (2020)10:374 Page 5 of 9
scan-day mania severity and right thalamus (rho = 0.32, p =
0.002) and right cerebellum (rho = 0.29, p = 0.006) activity.
Anxiety severity was not associated with activity in these
clusters (Supplementary Table 3).
Specificity analyses of between-group differences among
ARMA-defined COBY group membership in the seven
clusters of activity showing a main effect of BD-COBY
participants vs. HC in the 2-by-3 ANOVA (FDR-corrected
p value = 0.0103521: 7 clusters-by-6 ARMA-defined
between-group comparisons = 42 tests, 7 clusters-by-3
symptoms = 21 symptom-cluster tests above, and 7 COBY
Fig. 1 Neural regions from aims 2 and 3. Red represents ARMA- vs. HC between-group tests = 70 tests) revealed no sig-
based groups and Healthy comparisons; unique regions were right nificant between-group membership differences (all ps >
temporoparietal junction (TPJ), right insula, left fusiform gyrus, bilateral 0.046; Supplementary Table 4).
precuneus, and subregions of the cerebellum. Yellow represents COBY
and Healthy participants comparisons; unique regions were left
hippocampus, dorsolateral prefrontal cortex (dlPFC), and right Exploratory analyses
somatosensory cortex. Orange represents the overlapping regions Past and present-scan-day medication use were asso-
between the two analyses; overlapping regions were right thalamus, ciated with either lower activity or showed no association
premotor cortex, and cerebellum. in regions showing a main effect of group in both models
(Supplementary information, Supplementary Tables 5 and
6, liberal p value threshold 0.05).
cerebellum (rho = 0.36, p ≤ 0.001), left dlPFC (rho = 0.28, For ARMA-defined COBY vs. HC model main effect of
p = 0.007), and right somatosensory cortical (rho = 0.33, group neural activity, there was a positive relationship
p = 0.002) activity. Right thalamus (rho = 0.27, p = 0.008) between left fusiform activity and hypomania history load
and left hippocampus (rho = 0.27, p = 0.010) activity were (r = 0.30, p < 0.028). There were no relationships with
positively associated with present-scan-day mania severity illness history loads of mania or GAD, illness severity
(Fig. 2). Right cerebellum activity (r = 0.300, p = 0.004) trajectories, age of mood disorder onset, or lifetime
was positively associated with present-scan-day anxiety comorbid diagnosis of ADHD, GAD, CD or ODD.
severity. An FDR corrected p value = 0.0127321 was used For main BD-COBY vs. HC model effect of group
(7 clusters-by-3 symptom relationship + 7 BD-COBY vs. neural region, there was a positive relationship between
HC between-group tests = 28 tests; Fig. 1 and Table 3). right cerebellum activity and hypomania history load
(r = 0.29, p = 0.035). COBY participants with a lifetime
Specificity analyses history of comorbid ADHD showed higher left cerebellum
Comparisons between the maps generated from the two activity relative to those without lifetime comorbid diag-
analyses showed overlap in activity in several regions, nosis of ADHD (t(49) = −2.53, p = 0.015). There was a
including right thalamus, right premotor cortex, and right negative relationship between left dlPFC activity and age
cerebellum. Activity associated uniquely with ARMA- of onset of mood disorders (r = −0.30, p = 0.031) and
defined-COBY-past depression-load was in right tempor- COBY participants with lifetime comorbid CD diagnosis
oparietal junction, right insula, left fusiform gyrus, bilateral showed lower left dlPFC activity relative to those without
precuneus and subregions of the cerebellum. Activity lifetime comorbid CD (t(49) = 2.46, p = 0.018). There
associated uniquely with BD-COBY diagnosis was in left were no relationships with illness history loads of mania
hippocampus and dlPFC, and right somatosensory cortex or GAD, illness severity trajectories, or lifetime comorbid
(Fig. 1). diagnosis of GAD or ODD.
Specificity analyses of relationships among present-scan-
day symptom severity and the ten clusters of activity Discussion
showing a main effect of ARMA-defined COBY group in the We aimed to dissociate patterns of abnormal neural
4-by-3 ANOVA in all participants (FDR-corrected p value = activity associated with present-scan-day symptom severity
0.009639 21: 10 clusters-by-3 symptoms = 30 tests, 10 COBY from those patterns of abnormal neural activity that are
vs. HC between-group tests, and 60 between-ARMA-defined effects of long-term depression in the context of BD. This
group tests above = 100 tests) revealed significant associa- is a critical step to ultimately enable appropriate targeting
tions among present-scan-day depression severity and right of interventions such as neuromodulation to neural regions
thalamus (rho = 0.33, p = 0.002), left precuneus (rho = 0.33, that are implicated in pathophysiological processes asso-
p = 0.002), and bilateral cerebellum (left: rho = 0.34, p = ciated with the development of BD, rather than targeting
0.001, right: rho = 0.29, p = 0.006) activity; and present- such interventions to neural regions in which abnormalBertocci et al. Translational Psychiatry (2020)10:374 Page 6 of 9
G2 > G1, HC
activity represents effects of long-term illness. COBY pro-
Table 2 ANCOVA comparisons with pairwise tests of extracted parameter estimates from significant clusters comparing ARMA-defined groups and Healthy
G1 > HC
G2 > HC
G1 > HC
vided a unique sample of BD adults in whom to separate
effects of well-characterized depression history from
Post hoc test present-scan-day symptom severity-related patterns of
abnormal neural activity during emotional regulation. We
G3 > G1, HC
G3 > G1, HC
G3 > G1, HC
G3 > G1, HC
G3 > G1, HC
G3 > HC
G3 > HC
identified patterns of abnormally elevated emotional
regulation-related activity across all face distracter condi-
tions in networks supporting visual social cognition and
salience perception, and reappraisal and experience of
0.574
0.146
0.084
0.663
0.693
0.386
0.874
0.131
0.084
0.968
p=
emotion, that were associated, respectively, with past
depression-load and present-scan-day affective symptom
severity. Abnormally elevated activity in a cerebello-
F(1,84)=
Gender
thalamic-premotor cortical network was associated with
0.32
2.16
3.05
0.19
0.16
0.76
0.03
2.33
3.05
0.00
both past depression-load and present-scan-day symptoms.
To identify groups of COBY participants differing in
0.724
0.149
0.188
0.909
0.539
0.226
0.544
0.293
0.319
0.380
depression-load, we used ARMA, a well-validated
p=
approach to understand and forecast timeseries, fol-
lowed by k-means clustering. ARMA-defined COBY
F(1,84)=
participants with the greatest past depression-load relative
G3 ARMA-defined Group 3, G2 ARMA-defined Group 2, G1 ARMA-defined Group 1, HC Healthy participants, R right, L left, BA Brodmann area.
Age
0.13
2.13
1.76
0.01
0.38
1.49
0.37
1.12
1.01
0.78
to the two other ARMA-defined COBY groups and HC
showed significantly greater activity during emotional
regulation task performance in a visual social cognition
and salience perception22–26 network comprising right
Coordinates in MNI space; k = number of voxels in region; Bold indicates significant test. FDR significance threshold < 0.010684.
ARMA-defined and healthy group
temporoparietal junction, right insula, left fusiform gyrus,Bertocci et al. Translational Psychiatry (2020)10:374 Page 7 of 9
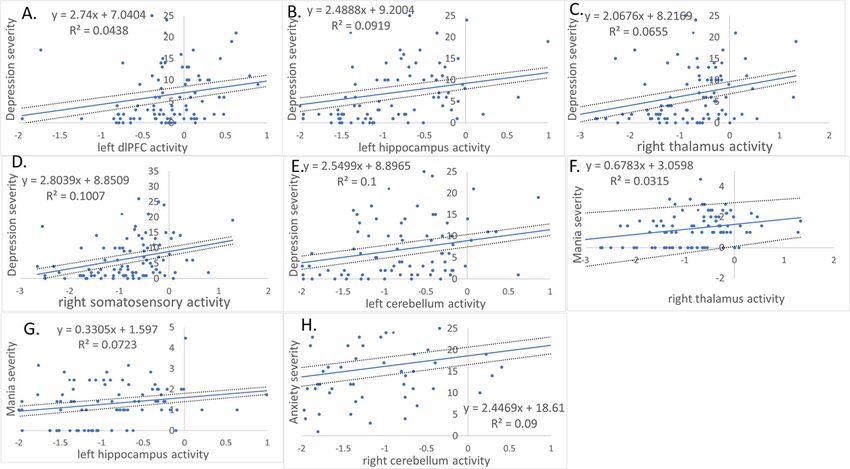
Fig. 2 Linear relationships between present affective symptom severity and neural activity distinguishing COBY participants from HC.
A Relationship between left dlPFC activity and depression severity; B Relationship between left hippocampus activity and depression severity;
C relationship between right thalamus activity and depression severity; D relationship between right sensorimotor cortex activity and depression
severity; E relationship between left cerebellum activity and depression severity; F relationship between right thalamus activity and mania severity
and G relationship between left hippocampus activity and mania severity; H relationship between right cerebellum and anxiety severity. Blue lines
represent the trend lines and the dotted lines represent the 95% confidence intervals. These relationships were for Spearman’s correlations for
depression and mania due to nonparametric distributions of these affective symptom scores.
Table 3 ANCOVA comparisons with pairwise test of extracted parameter estimates controlling for age and gender
comparing COBY (n = 54) vs. Healthy participants (HC) (n = 36).
ANCOVA results
SPM coordinates and cluster size Diagnostic group Age Gender
Neural region x y z k F(1,86)= p= F(1,86)= p= F(1,86)= p= Post hoc test
Somatosensory cortex R BA 1 38 −28 44 453 18.35 HC
Thalamus R 12 −26 10 134 16.72 HC
dlPFC L BA 9 −24 30 38 130 16.55 HC
Premotor cortex R BA 6 18 2 64 68 13.16 HC
Cerebellum L −18 −46 −18 38 19.92 HC
Cerebellum R 8 −44 −10 36 15.11 HC
Hippocampus L −22 −34 10 40 12.82 0.001 1.60 0.209 0.10 0.759 COBY > HC
Coordinates in MNI space; k = number of voxels in region; bold indicates significant test. FDR significance threshold < 0.01273.
dlPFC dorsolateral prefrontal cortex, R right, L left, BA Brodmann area.
not with anxiety, symptom severity. These regions are reappraisal strategies, hippocampus supporting implicit
implicated in emotional processing and regulation, with context-related reappraisal processes31, and right somato-
dlPFC implicated in more effortful appraisal and sensory cortex implicated in emotion processing andBertocci et al. Translational Psychiatry (2020)10:374 Page 8 of 9
experience of emotions32,33. Our findings also parallel assessment, we were not able to examine neural changes
reports of greater left dlPFC34–36 and hippocampal36 accompanying symptom trajectories. Additionally, treat-
activity during emotional regulation in adults and youth ment across the sample was heterogeneous, and there were
with BD-type-I vs. adults with BD-type-II and healthy unbalanced numbers of participants with BDI and BDII.
adults, and vs. healthy youth, respectively; and abnormally While future studies can aim to replicate our present
elevated resting state functional connectivity in the soma- findings, the COBY sample is, however, a unique cohort of
tosensory cortex in adults with BD-types-I and II37. well-characterized adults with pediatric-onset BD, who
Abnormally elevated activity in these regions might thus have been clinically followed for up to 17.5 years.
reflect either a compensatory recruitment of these regions We show distinct patterns of aberrant neural activity
to facilitate emotional regulation, or aberrant appraisal related to long-term effects of depression vs. those related
(and reappraisal) of face stimuli and heightened emotional to present BD symptoms in a unique sample of adults with
experience during task performance, predisposing to the BD with well-characterized long-term past depression-
development of depressive and manic symptoms in BD. load. Our findings can help guide targeting of future neu-
While it is not possible to distinguish between these two romodulation interventions to networks associated speci-
possible explanations, it is striking that activity in these fically with underlying pathophysiological processes of BD,
regions was not associated with past history of depression, rather than to those networks in which abnormal activity
indicating that this pattern of abnormal dlPFC, hippo- reflects long-term illness effects.
campal and somatosensory cortical activity is more likely to
be related to present pathophysiological processes rather Acknowledgements
COBY is supported by the National Institute of Mental Health (R01MH059929;
than effects of previous depression in BD. The left-sided PIs: B.B., M.L.P., A.V., R01MH100041; PI: M.L.P., and the Pittsburgh Foundation
focus of dlPFC and hippocampal activity might reflect the (M.L.P.)). This funding agency was not involved in the design or conduct of the
less efficient attentional processing capacity of left vs. right study, the collection, management, analysis, or interpretation of the data, or
the preparation, review, or approval of the manuscript. We acknowledge the
hemispheres38, resulting in more inefficient emotional participants for their contributions to this study.
regulation-related redirection of attention during the task.
Abnormal activity common to both main analyses was Conflict of interest
observed in regions involved in emotion processing and H.A.-W., H.A., G.B., J.B., M.A.B., L.B., M.K.G., R.D., S.I., C.L., J.P.L.S., J.L., J.M., M.L.P., R.S.,
and A.V. report no competing interests. B.B. has or will receive royalties from for
communication preparation, including right thalamus39,
publications from Random House, Inc (New hope for children and teens with
premotor cortex39, and bilateral cerebellum40. There were bipolar disorder) and Lippincott Williams & Wilkins (Treating child and
also positive relationships among present-scan-day affec- adolescent depression). He is employed by the University of Pittsburgh and
the University of Pittsburgh Medical Center and receives research funding
tive symptoms and activity in right thalamus and bilateral
from NIMH.
cerebellum that distinguished ARMA-defined COBY
groups and HC. Thus, abnormal activity in these regions Publisher’s note
Springer Nature remains neutral with regard to jurisdictional claims in
might reflect aberrant processes involved in emotion pro- published maps and institutional affiliations.
cessing and communication preparation that are associated
with the cumulative burden of both long-term depression Supplementary Information accompanies this paper at (https://doi.org/
and present affective and anxiety symptom severity in BD. 10.1038/s41398-020-01048-1).
COBY participants taking psychotropic medication
Received: 9 June 2020 Revised: 28 September 2020 Accepted: 9 October
showed lower, rather than higher, activity in regions 2020
showing main effects of group in the main analyses. Thus, it
is unlikely that our findings were confounded by effects of
medication. Similarly, there were no significant relation-
ships between activity in the vast majority of regions References
showing main effects of group in each of the main analyses 1. Mitchell, P. B. & Malhi, G. S. Bipolar depression: phenomenological overview
and clinical characteristics. Bipolar Disord. 6, 530–539 (2004).
and age of illness onset, previous comorbid disorders, past 2. Post, R. M. Treatment of bipolar depression: evolving recommendations.
mania, hypomania or anxiety severity, or past hypomania, Psychiatr. Clin. 39, 11–33 (2016).
mania and anxiety history loads. The absence of associa- 3. Tondo, L., Vázquez, G. H. & Baldessarini, R. J. Depression and mania in bipolar
disorder. Curr. Neuropharmacol. 15, 353–358 (2017).
tions between amygdala activity and past depression-load or 4. McIntyre, R. S. & Calabrese, J. R. Bipolar depression: the clinical characteristics
present-scan-day BD symptoms was an unexpected finding, and unmet needs of a complex disorder. Curr. Med. Res. Opin. 35, 1993–2005
but might reflect the emotional regulation nature of the (2019).
5. Blanco, C. et al. Epidemiology of DSM-5 bipolar I disorder: results from the
paradigm, with between-group differences in activity National Epidemiologic Survey on Alcohol and Related Conditions—III. J.
reflecting aberrant recruitment of neural circuitries related Psychiatr. Res. 84, 310–317 (2017).
to this process, rather than amygdala-centered circuitry 6. Cloutier, M. et al. The economic burden of bipolar I disorder in the United
States in 2015. J. Affect. Disord. 226, 45–51 (2018).
supporting emotional processing per se. The COBY sample 7. Townsend, J. & Altshuler, L. L. Emotion processing and regulation in bipolar
is relatively modest, and, with only one neuroimaging disorder: a review. Bipolar Disord. 14, 326–339 (2012).Bertocci et al. Translational Psychiatry (2020)10:374 Page 9 of 9
8. Alonso-Lana, S. et al. Longitudinal brain functional changes between mania 25. Van Overwalle, F. & Vandekerckhove, M. Implicit and explicit social mentalizing:
and euthymia in bipolar disorder. Bipolar Disord. 21, 449–457 (2019). dual processes driven by a shared neural network. Front. Hum. Neurosci. 7, 560
9. Phillips, M. L. & Swartz, H. A. A critical appraisal of neuroimaging studies of (2013). https://doi.org/10.3389/fnhum.2013.00560.
bipolar disorder: toward a new conceptualization of underlying neural cir- 26. Chen, M. C., Chang, C., Glover, G. H. & Gotlib, I. H. Increased insula coactivation
cuitry and a road map for future research. Am. J. Psychiatry 171, 829–843 with salience networks in insomnia. Biol. Psychol. 97, 1–8 (2014).
(2014). 27. Malhi, G. S. et al. Reduced activation to implicit affect induction in euthymic
10. Corbalán, F., Beaulieu, S. & Armony, J. L. Emotion regulation in bipolar disorder bipolar patients: an fMRI study. J. Affect. Disord. 97, 109–122 (2007).
type I: an fMRI study. Psychol. Med. 45, 2521–2531 (2015). 28. Shamay-Tsoory, S., Harari, H., Szepsenwol, O. & Levkovitz, Y. Neuropsycholo-
11. Wiggins, J. L. et al. Neural markers in pediatric bipolar disorder and familial gical evidence of impaired cognitive empathy in euthymic bipolar disorder. J.
risk for bipolar disorder. J. Am. Acad. Child Adolesc. Psychiatry 56, 67–78 Neuropsychiatry Clin. Neurosci. 21, 59–67 (2009).
(2017). 29. Bora, E. et al. Evidence for theory of mind deficits in euthymic patients with
12. Sepede, G. et al. Neural correlates of negative emotion processing in bipolar bipolar disorder. Acta Psychiatr. Scand. 112, 110–116 (2005).
disorder. Prog. Neuro-Psychopharmacol. Biol. Psychiatry 60, 1–10 (2015). 30. Samamé, C., Martino, D. J. & Strejilevich, S. A. Social cognition in euthymic
13. Birmaher, B. et al. Clinical course of children and adolescents with bipolar bipolar disorder: systematic review and meta-analytic approach. Acta Psychiatr.
spectrum disorders. Arch. Gen. Psychiatry 63, 175–183 (2006). Scand. 125, 266–280 (2012).
14. Keller, M. B. et al. The longitudinal interval follow-up evaluation: a compre- 31. Phillips, M. L., Ladouceur, C. D. & Drevets, W. C. A neural model of voluntary
hensive method for assessing outcome in prospective longitudinal studies. and automatic emotion regulation: implications for understanding the
Arch. Gen. Psychiatry 44, 540–548 (1987). pathophysiology and neurodevelopment of bipolar disorder. Mol. Psychiatry
15. Kaufman, J. et al. Schedule for affective disorders and schizophrenia for 13, 833–857 (2008).
school-age children-present and lifetime version (K-SADS-PL): initial 32. Kragel, P. A. & LaBar, K. S. Somatosensory representations link the perception of
reliability and validity data. J. Am. Acad. Child Adolesc. Psychiatry 36, 980–988 emotional expressions and sensory experience. eneuro 3, ENEURO.0090-0015.
(1997). 2016 (2016).
16. Hamilton, M. A rating scale for depression. J. Neurol., Neurosurg., Psychiatry 23, 33. Bolognini, N., Rossetti, A., Convento, S. & Vallar, G. Understanding others’
56 (1960). feelings: the role of the right primary somatosensory cortex in encoding the
17. Young, R. C., Biggs, J. T., Ziegler, V. E. & Meyer, D. A. A rating scale for mania: affective valence of others’ touch. J. Neurosci. 33, 4201–4205 (2013).
reliability, validity and sensitivity. Br. J. Psychiatry 133, 429–435 (1978). 34. Caseras, X. et al. Emotion regulation deficits in euthymic bipolar I versus
18. Spielberger, C. D., Gorsuch, R. L., Lushene, R., Vagg, P. R. & Jacobs, G. A. Manual bipolar II disorder: a functional and diffusion‐tensor imaging study. Bipolar
for the State-Trait Anxiety Inventory. Palo Alto, CA: Consulting Psychologists Disord. 17, 461–470 (2015).
Press (1983). 35. Ladouceur, C. D. et al. Differential patterns of abnormal activity and
19. Woodward, W. A., Gray, H. L. & Elliott, A. C. Applied Time Series Analysis with R connectivity in the amygdala–prefrontal circuitry in bipolar-I and
(CRC Press, 2017). bipolar-NOS youth. J. Am. Acad. Child Adolesc. Psychiatry 50, 1275–1289.e1272
20. Muthén, L. & Muthén, B. Mplus. The Comprehensive Modelling Program for (2011).
Applied Researchers: User’s Guide Vol. 5 (Muthen & Muthen; 2016). 36. Chen, C.-H. et al. A quantitative meta-analysis of fMRI studies in bipolar dis-
21. Narum, S. R. Beyond Bonferroni: less conservative analyses for conservation order. Bipolar Disord. 13, 1–15 (2011).
genetics. Conserv. Genet. 7, 783–787 (2006). 37. Minuzzi, L. et al. Structural and functional changes in the somatosensory
22. Malhi, G. S. et al. A functional MRI study of Theory of Mind in euthymic bipolar cortex in euthymic females with bipolar disorder. Aust. N.Z. J. Psychiatry 52,
disorder patients. Bipolar Disord. 10, 943–956 (2008). 1075–1083 (2018).
23. Malhi, G. S. et al. Cognitive generation of affect in bipolar depression: an fMRI 38. Weintraub, S. & Mesulam, M.-M. Right cerebral dominance in spatial attention:
study. Eur. J. Neurosci. 19, 741–754 (2004). further evidence based on ipsilateral neglect. Arch. Neurol. 44, 621–625 (1987).
24. Schilbach, L. et al. Introspective minds: using ALE meta-analyses to study 39. Caria, A. et al. Species-specific response to human infant faces in the premotor
commonalities in the neural correlates of emotional processing, social & cortex. NeuroImage 60, 884–893 (2012).
unconstrained cognition. PLoS ONE 7, e30920 (2012). https://doi.org/10.1371/ 40. Baumann, O. & Mattingley, J. B. Functional topography of primary emotion
journal.pone.0030920. processing in the human cerebellum. NeuroImage 61, 805–811 (2012).You can also read