European Advertising Consumer Research Report 2021
←
→
Page content transcription
If your browser does not render page correctly, please read the page content below
RESEARCH REPORT

          European Advertising Consumer
                  Research Report 2021
                                                      Consumer Awareness & Impact of the European
                                                                Self-Regulatory Programme for OBA

Independent research conducted by Ipsos MORI on behalf of the EDAA   European Interactive Digital Advertising Alliance
                                                                                                   +32 (0) 2 213 4180
                                                                                                        www.edaa.eu
Introductory Remarks

                                        Conor Murray, Director of Regulatory and Public Affairs, egta
                                                     Chair of the EDAA Steering Group

          We, at the EDAA, are delighted to see that the efforts carried out by the industry to raise awareness around the EDAA’s Self-
          Regulatory Programme and the options for learning and customisation that the YourOnlineChoices platform provides are paying
          off. In the four years since the previous similar study, awareness of the AdChoices Icon has increased substantially, whether
          accompanied by the AdMarker (and local translations) or not.

The positive impact that the Icon (and what it entails for end-users in terms of enhanced transparency) has on the acceptance of Online
Behavioural Advertising (OBA) practices and respondents favourability towards the brand being advertised is significant. In fact, tailored
advertising is not the only area that sees higher approval ratings by respondents in the context of the EDAA Programme. Websites, brands,
and the digital advertising ecosystem as a whole are more likely to be trusted by respondents, when displaying the AdChoices Icon and
linking through to the YourOnlineChoices.eu website. Engagement too is witnessing record levels since 2014, when the first research to gauge
respondents’ attitudes was carried out. In six of the ten countries surveyed in 2020, around a half or more respondents who have previously
seen the Icon have clicked on it.

Of course, despite these positive results, work still needs to be done to improve the understanding of the Programme and the tools made
available to consumers, to take better informed control of their online advertising experience. It is welcoming to see that in 2020 EDAA
partnered with MediaSmart in the UK to help address this - after all, consumer empowerment starts with trust.

All of the above call for continued efforts to support and promote this unique Self-Regulatory Programme administered by EDAA whose
ultimate goal is to ensure a safe, responsible, open and trusted digital advertising ecosystem, with benefits for all stakeholders involved.

I would like to thank you for taking the time to read this fascinating research report and recognising these valuable tools and this
one-of-a-kind self-regulatory Programme as a cornerstone in a journey where we all work and act together, in placing the consumer
first.

            www.edaa.eu                                                      European Advertising Consumer Research Report 2021        2
            info@edaa.eu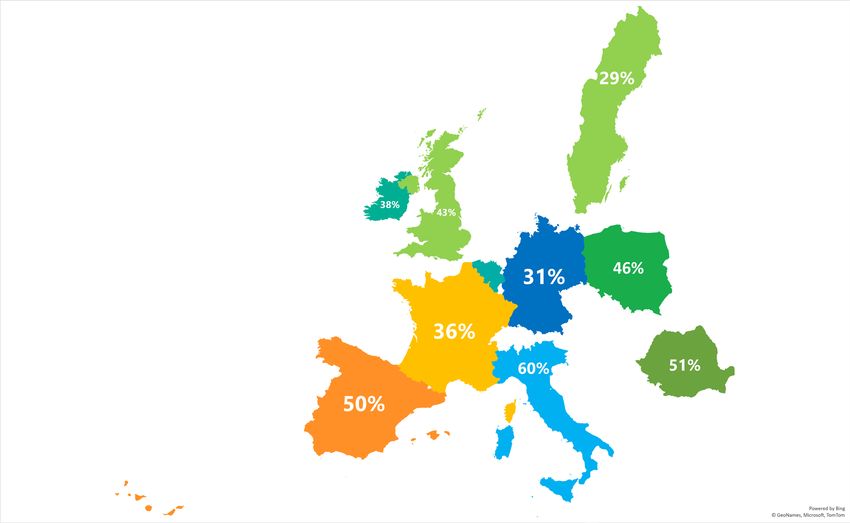
Table of Contents

1. EXECUTIVE SUMMARY OF RESEARCH FINDINGS                           .............................................4
2. SURVEY METHODOLOGY                                               .............................................5
3. EDAA SELF-REGULATORY PROGRAMME BACKGROUND                        .............................................6
4. DETAILED FINDINGS                                                .............................................7
       4.1 Awareness of the AdChoices Icon                          .............................................7
       4.2 Engagement with the AdChoices Icon                       .............................................8
       4.3 Understanding of the AdChoices Icon                      .............................................9
       4.4 Impact of the European Self-Regulatory Programme         ...........................................10
       4.5 OBA Favourability                                        ...........................................13
       4.6 User Behaviour                                           ...........................................17
       4.7 Enhancing youronlinechoices.eu                           ...........................................18

5. CONCLUSIONS                                                       ...........................................19
Appendix for previous methodologies                                  ...........................................20

       www.edaa.eu                Consumer Awareness & Impact of the European Self-Regulatory Programme for OBA      3
       info@edaa.eu
1. Executive Summary of Research Findings

The 2020 European Advertising Consumer Research Report captures a panoramic view of respondents’ attitudes and awareness of the
European Self-Regulatory Programme for Online Behavioural Advertising (OBA) in 10 different countries across Europe.

The study was conducted by Ipsos MORI on behalf of EDAA. Fieldwork ran from 30/11/2020 to 14/12/2020 with over 10,000 adults across
10 different European countries interviewed online.

Selected countries – Great Britain, Germany, France, Italy, Spain, Sweden, Poland, Belgium, Romania and Ireland – were chosen for their
diversity both in geography and the implementation status of the European Self-Regulatory Programme. Tracking data is available for these
markets for most questions, as they were also included in comparable research conducted in previous years. The online ecosystem relies
on advertising and it is critical that more consumers understand the important role ads play in supporting the delivery of online content and
services often at little to no cost to them. Concurrently, it is also important to inform consumers about mechanisms in place to manage their
preferences for online behavioural advertising, such as the EDAA’s Self-Regulatory Programme.

Results show that awareness of the AdChoices Icon continues to rise in 10 markets across Europe and nearly 50% who have previously
seen the Icon are choosing to find out more. About half or more of the respondents who were aware of the Icon clicked on it in six of the ten
countries surveyed: Poland, Sweden, Belgium, Romania, Germany, and Spain. The Programme can have a positive effect on attitudes too, with
favourability towards Online Behavioural Advertising (OBA) rising in all countries surveyed when the Icon is displayed.

A summary of key findings is presented below:

•   Approval: Based on their own experience of OBA, nearly half of respondents from Romania (48%), Spain (47%), and Poland (46%) are
    either “Strongly in favour of” or “Somewhat in favour of” OBA. At the opposite spectrum, respondents in Germany, France, and Ireland are
    more circumspect, with 27%, 27%, and 26% of respondents, respectively, either “Strongly in favour of” or “Somewhat in favour of” OBA.

However, nearly in all surveyed markets, respondents demonstrated potential for increase in favourability about the concept of OBA through
the Self-Regulatory Programme, particularly in markets where respondents may otherwise be less inclined to favour OBA. In Great Britain and
Ireland, for example, where 29% and 26% of respondents respectively show a favourable attitude towards OBA, having the AdChoices Icon on
a particular ad significantly boosts favourability of OBA by a further 18 and 22 percentage points, respectively.

•   Brand, website, and transparency trust: The research shows the presence of the AdChoices Icon can positively impact on the levels of
    trust in the brands advertised, the websites that feature the ad and the overall transparency in the digital advertising industry. In eight in
    ten of the markets, there has been a double digit percentage point increase in the proportion claiming to trust the brand being advertised
    more when the AdChoices Icon is present in comparison with the 2016 survey. The proportion of those claiming to trust the brand
    advertised more is highest in Italy (56%), Romania (48%), and Spain (46%).

•   Awareness: Respondents’ awareness of the AdChoices Icon with the AdMarker is highest in Ireland (51%) and Great Britain (50%). This
    marks a striking uptick from the 2016 values, when 39% and 34% of respondents, respectively, recognised the AdChoices Icon. Across
    nearly all countries surveyed awareness of the AdChoices Icon is greater when accompanied by the AdMarker “AdChoices” (and local
    translations), yet a clear upward trend in awareness is shown both with and without the accompanying text.

•   Understanding: Understanding what the Icon means must be a focus in the near future, as “Click to manage your privacy preferences”
    was the most frequently selected option in 6 out of the 10 markets. The gap between the erroneous and the correct option in these
    countries, however, is minute and consistent. This data signals what consumers may expect before interacting with the AdChoices Icon,
    a helpful indicator to inform subsequent development work on further enhancing transparency and creating an increasingly positive user
    experience.

•   Engagement: Another area which has seen vastly improved results is engagement. In six of the ten countries surveyed, around half or
    more of the respondents who were aware of the Icon have clicked on it. This is a marked positive evolution from the 2016 responses.
    The countries with the highest engagement rates are Sweden (56%), Belgium (53%), and Romania (52%).

•   Ad-blockers: The use of ad-blockers remains relatively popular, ranging from around one quarter using them “frequently” or “sometimes”
    in four countries (France, Romania, Sweden, and Ireland) to the highest reported level of 35% in Poland in this respect.

•   Complaints: As far as the likelihood of respondents to file a complaint about any company’s OBA practices, the most determined markets
    to make a complaint are Italy (55%) and Spain (45%). However, a noticeable proportion of respondents (e.g. 26% in Sweden, 24% in
    Great Britain, and 23% in Ireland) do not personally know where to make a complaint about their OBA choices not being respected. This
    particular aspect calls for further awareness-raising.

            www.edaa.eu                                                       European Advertising Consumer Research Report 2021             4
            info@edaa.eu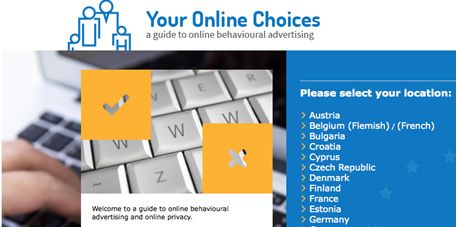
2. Survey Methodology

The below methodology covers field work carried out in 2020. Methodology for previous years referenced in this report are contained in the
Appendix.

Sampling

On behalf of European Interactive Digital Advertising Alliance (EDAA), interviews were carried out on Ipsos MORI’s online i:Omnibus service
from 30/11/2020 to 14/12/2020. using a quota sample of adults who are members of Ipsos’ European Online Panel. For each country, quotas
were set according to age, gender and region. The number and ages of adults interviewed for each country were as follows:

                                Country                          Age range               2020 Unweighted sample size
                              Great Britain                     Adults 16-75                           1024
                               Germany                          Adults 16-70                           1004
                                France                          Adults 16-75                           1034
                                  Italy                         Adults 16-70                           1017
                                 Spain                          Adults 16-65                           1022
                                Sweden                          Adults 16-65                           1021
                                Poland                          Adults 16-60                           1066
                                Belgium                         Adults 16-70                           1025
                               Romania                          Adults 16-60                           1035
                                Ireland                         Adults 16-65                           1002
                                 Total                                                                10250

Weighting

Within each country data was weighted by age within gender, region and working status to the known offline population profile for that
country. For some countries, additional weighting criteria were included.

As well as providing the results individually for each of the ten countries included in the survey, we have produced an overall total based on
“country averages”. This is where the results from each country have the same weight rather than the true population proportions across the
ten countries.

Data Quality

To ensure a quality sample, rules are in place to limit the number of surveys provided to each participant, which helps reduce the bias of
multiple surveys. Procedures are also in place to remove panellists who are inactive or whose behaviour history is suspicious. During the
survey data quality is ensured by flagging and removing participants’ answers that are suspicious by validating geo-IPs and identifying any
speeders or straight liners.

The work was carried out in accordance with the requirements of the international quality standard for market research, ISO 20252:2006,
as well as ISO 9001:2008, the international general company standard with a focus on continual improvement through quality management
systems and ISO 27001:2008, the international standard for information security. Further, Ipsos MORI is required to comply with the (EU)
2016/679 General Data Protection Regulation (GDPR) & the UK Data Protection Act 2018 (DPA), which covers the processing of personal data
and the protection of privacy.

Questionnaires available on demand. Methodology has been kept consistent with previous years and can be consulted in the Appendix.

               www.edaa.eu                     Consumer Awareness & Impact of the European Self-Regulatory Programme for OBA             5
               info@edaa.eu
3. EDAA Self-Regulatory Programme Background

Internet users want control over their privacy online. However, they also acknowledge the important role that digital advertising has to play in
making content and services available, often at little to no cost. The European Industry Self-Regulatory Framework for Data-Driven Advertising
seeks to strike that balance by empowering consumers with greater contextual transparency, choice and control.

At the heart of the EDAA Programme is an interactive pan-European Icon to serve as a transparency vehicle for ads that are delivered to
internet users via data-driven practices, and specifically through Online Behavioural Advertising (OBA).

This Icon is a consumer-facing, interactive symbol that links consumers to mechanisms for users to control preferences, including an online
portal, www.youronlinechoices.eu, where they can find easy-to-understand information on the practice of OBA (or data-driven advertising) as
well as a mechanism for exercising informed choice – if they so wish, consumers may turn off OBA for some or all participating companies.

The European Interactive Digital Advertising Alliance (EDAA) is the organisation responsible for administering the European Self-Regulatory
Programme for OBA across Europe and licensing the use of the AdChoices Icon and preference management platform.

Third Party participants that demonstrate full compliance with the Programme are granted the EDAA Trust Seal from one of a number of
approved independent certification providers.

The Programme is enforced by the relevant advertising Self-Regulatory Organisation (SRO) in each country (e.g. the ASA in the UK, DDOW in
Germany, Autocontrol in Spain, etc.). If businesses are not compliant then the enforcement sanctions could involve remedial action; a formal
investigation, leading to the adjudication being published or bringing a company’s continued non-compliance to the attention of a third party’s
potential clients and partners. Further sanctions include removal of the Trust Seal and withdrawal of the AdChoices Icon. For non-cooperative,
serious, persistent and/or deliberate offenders, the SRO may also refer the company to the competent national Data Protection Authority (e.g.
the Information Commissioner’s Office (ICO) in the UK).

Media Smart Project

In 2020, EDAA in collaboration with Media Smart UK developed a brand-new resource designed to help young people understand the world of
online advertising, and how they can get the best experience from it.

The new resource, ‘How to manage your online advert experience’, features a three-minute animated film which can be viewed here, as well
as classroom resources, to support student discussions around what is OBA, why it exists and how young people can best manage it. It
also explains how this type of advertising funds many of the platforms that young people use every day, from apps and websites, to search
engines. The new resource aims to help young people understand how to manage the advertising they see through introducing them to the
‘AdChoices Icon’, and how they can click on the logo to learn more – and to manage the adverts that are served – through tools including the
EDAA’s www.youronlinechoices.eu website.

The resource also includes a number of classroom activities, games and quizzes to raise awareness of these issues and support the
wider PSHE curriculum (Personal, Social, Health and Economic education) with media literacy and digital resilience. It builds on the PSHE
programme of study on how data can be used to influence decisions, including tailored advertising and other forms of personalisation online.

Reception and Analytics

The educational resource was launched in the UK in October 2020, followed by a month-long dedicated social media campaign both by EDAA
and MediaSmart. Since then it has garnered impressive, national level attention from schools. The resource was also the focus of a webinar,
hosted on 4 November 2020 by Media Smart Chair and CEO of Omnicom Media Group UK, Dan Clays. Speakers included Angela Mills Wade,
Chair of EDAA, and Will Gardner OBE, CEO of Childnet.

The resource pack has already been downloaded 250 times (as of January 2021) and the website has seen an ever-increasing number of
registrations, topping the 300 mark in the months of December and January alone, with most of them being teachers. The uptake of the
resource has been so encouraging that EDAA is now laying the groundwork to roll out the resource in several other European markets.

             www.edaa.eu                                                      European Advertising Consumer Research Report 2021           6
             info@edaa.eu
4. Detailed Findings

The European Advertising Consumer Research Report 2021 was commissioned by EDAA in order to assess the ongoing progress of the
European Self-Regulatory Programme for OBA against clear benchmark results from previous studies.

Questions were developed with the intent of measuring participants’ attitudes and perceptions of the European Self-Regulatory Programme,
now in its fourth iteration (previous surveys took place in 2014, 2015 & 2016). Additionally, the research sought to determine the current levels
of awareness and understanding of the AdChoices Icon. The time window between reports has been used to develop new assets, projects
and initiatives and leverage them to address the findings of the previous reports. As shown in the charts, graphs and subsequent sections
below, this has been a resounding success in most respects. Furthermore, the survey has been expanded and augmented for 2020 to include
additional questions to address new regulatory and market developments, as well as new areas of interest.

4.1 Awareness of the AdChoices Icon

Survey respondents were asked whether they had seen either the AdChoices Icon (with or without the AdMarker text) at any time before the
survey. The UK version of the Icon and text are shown below, although the standard localised versions were shown in the language of the
ten different European markets where the research was conducted. Respondents were shown one image at a time and the order of the two
options was rotated within the questionnaire to limit the impact of the order effect. The data used is for all respondents whether they have
seen each image in first or second position.

                                                                                              1              AdChoices
                                                                                              2

Awareness with AdMarker

The chart below shows the percentage of participants who are aware of the AdChoices Icon when displayed alongside the AdMarker. The
results show large gains in awareness since the previous survey iteration in 2016, with all but two markets showing double-digit percentage
point growth. Ireland (51%) and GB (50%) displayed the highest awareness of all markets, and boast solid growth compared to 2016, up 12
and 16 percentage points respectively. While awareness of the AdChoices Icon with the AdMarker is lowest in Italy (22%) and France (23%),
these markets still show improvement. The highest percentage points increase was recorded in Romania (up 23 percentage points), and
Germany and Sweden (both up 22 percentage points).
                                                                         Awareness of the AdChoices Icon with Admarker - 2016 v. 2020
      60%
                                                                                                     % seen the AdChoices Icon with AdMarker
                          +12
                                                 +16
                    51%
                                          50%                                                                                       1
      50%

                                                                     +23

                                                               42%
                                                                                                                                                                                                                 Percentage points (pp) increase from 2016 to 2020
            39%
      40%

                                                                                                     +22
                                34%
                                                                                                                                   +22
                                                                                               32%
                                                                                                                                                                 +17                           +17
                                                                                                                             30%
      30%                                                                                                                                                  28%                           28%
                                                                                                                                                                                                                               +5
                                                                                                                                                                                                                                                 +7
                                                                                                                                                                                                                                                                            +12
                                                                                                                                                                                                                         24%
                                                                                                                                                                                                                                           23%
                                                                                                                                                                                                                                                                      22%

                                                       19%                                                                                                                                                 19%
      20%
                                                                                                                                                                                                                                    16%

                                                                                                                                                11%                          11%
                                                                                   10%                                                                                                                                                                  10%
      10%                                                                                                         8%

       0%
              Ireland            Great Britain           Romania                      Germany                          Sweden                       Poland                       Belgium                         Spain                France                  Italy

                                                                                                                                2016     2020

                                                             Q1_1. Before today, have you seen the following icons or symbols online?
                                                                   Base: Adults (16 – 60/75) c.1000 respondents per market. Online interviews. Fieldwork dates and base sizes in EDAA Research methodology section.

             www.edaa.eu                                                      Consumer Awareness & Impact of the European Self-Regulatory Programme for OBA                                                                                                                       7
             info@edaa.eu
This trend of continued improvement in terms of awareness, evident in the 2015 version of the study and then in all subsequent iterations,
shows that there is still room for growth. Furthermore, these results were recorded --for the first time-- without an awareness campaign being
rolled out ahead of the survey, but with consistent and sustained work on the development of the EDAA Programme. Combined with additional
research conducted in 2019 on consumer attitudes and awareness of GDPR (see here), this shows that efforts should be multi-pronged and
address a variety of groups and demographics through a diverse range of means. A noteworthy recent example is EDAA’s education project
with Media Smart UK, presented in Section 3.
Great Britain is the only country for which longer-term comparison data exists: here awareness of the Icon with the AdMarker continues to
rise: 13% in 2012, 22% in 2013, 26% in 2014, 28% in 2015, 34% in 2016 to reach 50% in 2020.
Awareness without AdMarker
The chart below shows the percentage of respondents who were aware of the AdChoices Icon when displayed in the absence of the AdMarker.
As previously indicated, for nearly all respondents the awareness of the AdChoices Icon is greater when accompanied by the AdMarker text
(e.g. “AdChoices” in English). The constant, however, is the remarkable evolution since the previous iteration of this study. As was the case
for awareness of the AdChoices Icon with the AdMarker, even in the absence of the AdMarker text, awareness has increased by double digits
percentage points in all but two markets. The most noteworthy hikes were recorded in Germany (up 22 percentage points), and Poland,
Belgium, and Sweden (each up by 19 percentage points).
Awareness of the AdChoices Icon without AdMarker - 2016 v. 2020
40% +18
% seen the AdChoices Icon without AdMarker
37% Percentage points (pp) increase from 2016 to 2020
+8
34%
+5 2
35%
33%
+22 +19
+19
30% 29% 29% +19 +12 +17
28% 28%
27% 27% 27%
26%
25%
+10
21%
20% 19%
15%
15%
11%
10% 10%
10% 9%
8%
7%
5%
0%
Romania Great Britain Ireland Germany Poland Belgium Sweden Spain Italy France
2016 2020
Q1_2. Before today, have you seen the following icons or symbols online?
Base: Adults (16 – 60/75) c.1000 respondents per market. Online interviews. Fieldwork dates and base sizes in EDAA Research methodology section.
4.2 Engagement with the AdChoices Icon
Respondents aware of the AdChoices Icon were then asked if they had ever clicked on it. Growth was recorded in all surveyed markets, with
no exception, with numbers ranging from +25 percentage points in Germany (51% in 2020 vs. 26% in 2016) to +6 percentage points recorded
in France (42% in 2020 vs. 36% in 2016). In six of the ten countries surveyed (Poland, Sweden, Belgium, Romania, Germany, and Spain) about
half or more of the respondents who were aware of the Icon have clicked on it.
The 2015 vs. 2016 comparison in terms of engagement showed that getting users to interact with the AdChoices Icon was a challenge. In
fact, for most countries surveyed at the time, the difference between the two iterations, while on a positive overall trend, was much smaller
than the latest jump. Germany actually experienced a decrease in the level of engagement in 2016 compared to 2015. What is evident in
the 2020 results is that not only has this impasse been resolved, but in most cases the results are spectacular. Germany has nearly doubled
engagement rates. Engagement in Great Britain has spiked to 40%, after previous iterations of this survey showed this metric at 26% and 27%
in 2015 and 2016 respectively.
www.edaa.eu European Advertising Consumer Research Report 2021 8
info@edaa.euEngagement with the AdChoices Icon - 2015 v. 2016 v. 2020
60%
% clicked on the AdChoices having recognised it
56%
53%
52%
51% 51%
49%
50%
44%
43%
42%
41% 41%
40% 40%
39% 39%
40%
37% 37%
36% 36%
35%
33%
30% 28% 28%
27% 27%
26% 26%
25%
20%
10%
0%
Sweden Belgium Romania Germany Spain Poland Italy France Great Britain Ireland
2015 2016 2020
Q3. Have you ever clicked on the AdChoices Icon?
2020 Base: All respondents who are aware of AdChoices icon c. 200 to 500 respondents per market. Online interviews. Fieldwork dates and base sizes for in EDAA Research
methodology section. Methodology for previous years available in Appendix
4.3 Understanding of the AdChoices Icon
Respondents who had previously seen the AdChoices Icon were shown a sample advert and asked which, if any, of the following responses,
from 1 to 6, they thought best described what the Icon means. Respondents also had the option to opt for an “other” response.
1. The logo of the brand being advertised
2. Click to see a video
3. Click to manage your privacy preferences
4. This is a safe advert
5. Click to visit the brand’s website
6. Click to exit the ad
7. Other
8. Don’t know
In the majority of surveyed markets (six out of the ten) “Click to manage your privacy preferences” was the most frequently selected top
pick.
www.edaa.eu Consumer Awareness & Impact of the European Self-Regulatory Programme for OBA 9
info@edaa.euUnderstanding of the AdChoices Icon
25% % of respondents who selected Click to manage your privacy preferences as the best
description of the AdChoices logo
1 1 1
1 Where Click to manage your
# privacy preferences ranked
in list of responses
20% 1 3
1
15% 3 4
5
10%
5%
0%
Spain Poland Ireland France Great Britain Italy Sweden Belgium Romania Germany
Respondents choosing correct option
Q2. What do you think BEST describes what the AdChoices Icon means?
Base: All respondents who are aware of AdChoices icon c. 200 to 500 respondents per market. Online interviews. Fieldwork dates and base sizes for in EDAA Research
methodology section. Methodology for previous years available in Appendix
Steps have been made to improve the understanding of the AdChoices Icon. The results of the survey showcase a clear improvement with
an increase in the proportion of respondents picking the correct response (i.e. “Click to manage your privacy preferences”). In 2016, in only
a third of the surveyed markets was “click to manage your privacy preferences” the most frequently selected option, whereas in 2020 this
was the case in 60% of the markets. In Poland and Ireland, where the correct answer was ranked second in 2016, results have improved and
the “manage your privacy preferences” option is now the most frequently chosen answer. Nevertheless there is a clear need for improving
understanding in several markets, notably Romania and Germany.
4.4 Impact of the European Self-Regulatory Programme
EDAA, on behalf of the online advertising industry and with the support of its cross-industry governing associations, has made significant
efforts in recent years to address the concerns of all stakeholders in the online advertising ecosystem, to increase transparency and
improve online business practices to bring responsibility, openness and increased trust to the value exchange between companies and
consumers.
To close the circle for consumers, companies involved in the collection and use of data for OBA purposes are invited to integrate onto the
“Consumer Choice Platform” at www.youronlinechoices.eu (YOC). End-users are thus provided with the option to turn off (or turn back on)
tailored advertising by some or all participating companies. This consumer preference platform is a core component of the European Self-
Regulatory Programme.
To gauge the impact of the European Self-Regulatory Programme, survey respondents were presented with an image of the YOC website
homepage alongside an explanation that this is where they can find information about Online Behavioural Advertising (OBA), manage their
online privacy preferences, and make a complaint about a company’s use of OBA to their national Self-Regulatory Organisation.
www.edaa.eu European Advertising Consumer Research Report 2021 10
info@edaa.euImpact on brands, websites, and ecosystem transparency
The practice of OBA itself is not the only area that benefits from an increase of favourability as a result of having YOC information available
to internet users and having the option of managing online privacy preferences. Survey respondents were also asked about whether the Icon
changes their level of trust in the brand advertised, websites that feature the ad, as well as in the overall transparency in the digital advertising
industry.
AdChoices Icon impact on brand trust
60%
% clicked Trust much more / Trust a little more in the brand advertised
56%
50% 48%
46%
44%
43%
41%
40%
39%
40%
36% 36%
35%
33%
32%
31%
30%
26% 26%
21% 21% 21%
20%
20%
10%
0%
Italy Romania Spain Poland Great Britain Ireland Belgium Germany France Sweden
2016 2020
Q5_2. Does the AdChoices Icon make you trust the brand advertised more, less
or does it make no difference?
2020 Base: Adults (16 – 60/75) c.1000 respondents per market. Online interviews. Fieldwork dates and base sizes in EDAA Research methodology section.
Trust in the brand advertised saw a clear boost with the presence of the AdChoices Icon. This ranges from an uplift to 31% in favourable
attitude in Sweden, to a considerable uplift to 56% in trust reported in Italy.
Respondents’ perceptions regarding trust in the brand being advertised are up significantly from 2016 values, except for Ireland. In Italy,
Romania, and Spain -- the top three markets in terms of positive impact of the AdChoices Icon on brand trust -- values from 2016 rose by
17, 12, and 3 percentage points, respectively. Poland, Great Britain and Belgium also saw favourability increase by 18, 14 and 14 percentage
points respectively to brands bearing the Icon compared to 2016. Germany (33% in 2020 vs. 20% in 2016), France (32% in 2020 vs. 21% in
2016), and Sweden (31% in 2020 vs. 21% in 2016) follow this highly positive trend as well.
Trust in the brand advertised sees a
clear boost with the presence of the
AdChoices Icon.
www.edaa.eu Consumer Awareness & Impact of the European Self-Regulatory Programme for OBA 11
info@edaa.euThe rise in trust towards websites that feature the ad and the overall transparency in the digital advertising industry, which the presence of
the AdChoices Icon catalyses, is also noteworthy. More than half of respondents in Italy show an increased trust in websites that feature ads
bearing the Icon. A similar proportion was recorded in Spain. Four or more in ten respondents in Romania, Poland, and Great Britain also trust
the websites that feature the ad more which display the AdChoices Icon more.
AdChoices Icon impact on websites
% clicked “Much more trustworthy” and “Somewhat more trustworthy” the websites
that feature the ad
34%
Q5_1. Does the AdChoices Icon make you trust the website that features the ad
more, less or does it make no difference?
Base: Adults (16 – 60/75) c.1000 respondents per market. Online interviews. Fieldwork dates and base sizes in EDAA Research methodology section.
Overall, transparency in the digital advertising industry comes through as a clear benefit from the Icon and the Programme as a whole. The
most significant impact on trust generated by the Icon was recorded in Italy (60% “much more trustworthy” or “somewhat more trustworthy”),
followed by Romania (51%), and Spain (50%).
AdChoices Icon impact on overall transparency in the digital
advertising industry
% clicked “Much more trustworthy” and “Somewhat more trustworthy” the overall
transparency in the digital advertising industry
36%
Q5_3. Does the AdChoices Icon make you trust the overall transparency in the
digital advertising industry more, less or does it make no difference?
Base: Adults (16 – 60/75) c.1000 respondents per market. Online interviews. Fieldwork dates and base sizes in EDAA Research methodology section.
www.edaa.eu European Advertising Consumer Research Report 2021 12
info@edaa.euThe rise in trust towards websites
that feature the ad and the overall
transparency in the digital advertising
industry, which the presence of
the AdChoices Icon catalyses, is
noteworthy.
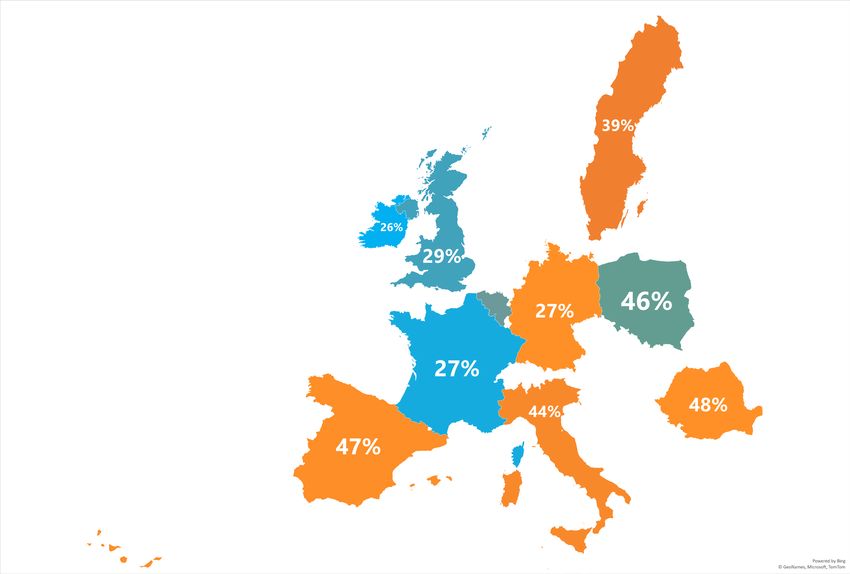
4.5 OBA Favourability
Participants were provided with an outline of what Online Behavioural Advertising (OBA) is and were then asked the extent to which they were
in favour of - or opposed to - advertisers and websites delivering OBA. The proportions in favour of OBA vary across the surveyed markets,
with a higher proportion in favour of this practice in Romania (48%), Spain (47%), and Poland (46%), to the more reserved countries in this
respect such as Germany (27%), France (27%), and Ireland (26%).
OBA Favourability
% clicked “Strongly in favour of” and “Somewhat in favour of” OBA practices
36%
QA. To what extent are you in favour of - or opposed to - advertisers and
websites employing OBA, or do you have no views either way?
Base: Adults (16 – 60/75) c.1000 respondents per market. Online interviews. Fieldwork dates and base sizes in EDAA Research methodology section.
The previous section highlighted the positive impact that the AdChoices Icon has on the trust of end-users towards websites, brands,
and overall transparency in digital advertising. However, perhaps one of the most positive findings of this survey is the impact that the
AdChoices Icon and the information available to them has on general favourability towards OBA. Particularly in markets where OBA
favourability ratings are on the lower end of the scale, the presence of the Icon and the information available that enables users to manage
their privacy preferences boost favourability considerably. 48% of respondents in Ireland, 47% in Great Britain, and half or more of those in
Italy, Spain, and Poland have expressed being more favourable towards the concept of OBA. Respondents in Germany and France have also
declared increased favourability towards OBA with 35% recorded in each country.
www.edaa.eu Consumer Awareness & Impact of the European Self-Regulatory Programme for OBA 13
info@edaa.euImpact of having information on YOC website on OBA favourability
60%
57% % clicked “A lot more favourable” and “A little more favourable” about OBA
53%
50%
50% 48%
47%
40%
40%
36%
35% 35%
34%
30%
20%
10%
0%
Italy Spain Poland Ireland Great Britain Romania Belgium Germany France Sweden
Percentage of respondents who are either "A lot more favourable" or "A little more favourable" to the concept of OBA
Q4. To what extent does having information available to you, and the option of
managing your privacy preferences on the YOC website, make you more or less
favourable about the concept of OBA?
Base: Adults (16 – 60/75) c.1000 respondents per market. Online interviews. Fieldwork dates and base sizes in EDAA Research methodology section.
Comparing the 2020 results to those of 2016, the positive trend is clear. In all but two markets, a higher proportion of respondents are more
favourable about the concept of OBA thanks to having the YOC information available to them, and the option of managing their privacy
preferences.
Impact of having information on YOC website on OBA favourability - 2016 v. 2020
60%
57% % clicked “A lot more favourable” and “A little more favourable” about OBA
54%
53%
50%
50% 48%
47%
45%
43%
40% 40%
39% 39%
40%
36%
35% 35%
34%
31%
30%
30% 28% 28%
20%
10%
0%
Italy Spain Poland Ireland Great Britain Romania Belgium Germany France Sweden
2016 2020
Q4. To what extent does having information available to you, and the option of
managing your privacy preferences on the YOC website, make you more or less
favourable about the concept of OBA?
Base: Adults (16 – 60/75) c.1000 respondents per market. Online interviews. Fieldwork dates and base sizes in EDAA Research methodology section.
www.edaa.eu European Advertising Consumer Research Report 2021 14
info@edaa.euParticularly in markets where OBA
favourability ratings are on the lower
end of the scale, the presence of the
Icon boosts favourability considerably.
The study asked respondents to think about Online Behavioural Advertising and to consider the extent to which they are likely or not to do
each of the following:
• Make a complaint about their Online Behavioural Advertising (OBA) choices not being respected
• Switch off personalised ads (but continue to have non-personalised ads)
• Get more information about Online Behavioural Advertising
The chart below outlines the proportion of respondents who claimed they are “very likely” or “fairly likely” vs. “not very likely” or “not at all
likely” to do each of these three activities:
OBA User Choices
53%
Make a complaint about OBA choices not being respected
36%
42%
Switch off personalised ads
46%
39%
Get more information about OBA
50%
0% 10% 20% 30% 40% 50% 60%
Not very / Not at all likely Very / Fairly Likely
Q7. Thinking about OBA, for each of these how likely or not would you
personally be to …
Base: Adults (16 – 60/75) c.1000 respondents per market. Online interviews. Fieldwork dates and base sizes in EDAA Research methodology section. Average of country
scores. High likelihood = very + fairly likely. Low likelihood = not very + not at all likely
The likelihood of respondents making a complaint about their OBA preferences not being respected is quite low. Only 36% of respondents
across all ten markets surveyed indicated they are likely to make such a complaint. Italian respondents are most likely to make a complaint
(55%) alongside those from Ireland (50%). Least likely respondents to file OBA complaints with their SROs are those from Romania (65%
responded that it is “not at all likely” that they would take this step). Encouragingly, one in two respondents has a high likelihood to seek more
information about OBA.
www.edaa.eu Consumer Awareness & Impact of the European Self-Regulatory Programme for OBA 15
info@edaa.euThe chart below highlights the responses of those likely to make a complaint when asked with whom such a complaint should be filed.
User OBA complaint awareness
www.YourOnlineChoices.eu
14%
Don’t know
21%
Would contact another Company delivering the online
organisation advert
4% 20%
National DPA
27% SRO
14%
Q7b. Where do you think you can go to if you wish to make a complaint about
this advertising technique?
Base: All respondents very or quite likely to make a complaint c.200 to 500 respondents per market. Online interviews. Fieldwork dates and base sizes in EDAA Research
methodology section. Average of country scores.
21% of responders do not know where to make a complaint about OBA, though they would be likely to do it should their choices not be
respected - which indicates an important opportunity for educating and raising awareness.
Previous sections detailed the positive impact that the AdChoices Icon / AdMarker and the Programme as a whole have on respondents’
perception of the brand, websites, and overall transparency of digital advertising, but it is imperative at this stage to highlight just how
important the Programme is in terms of user behaviour.
The likelihood of respondents
making a complaint about their OBA
preferences not being respected is
quite low.
www.edaa.eu European Advertising Consumer Research Report 2021 16
info@edaa.eu4.6 User behaviour
The 2020 edition of the study introduced a series of new questions that aim to provide an overview of user behaviour while browsing. The
questions range from the use of ad blockers, to whether or not respondents accept default settings on websites.
The question focused on the frequency (always, frequently, sometimes, rarely, never) with which respondents do each of the following while
using the internet:
• Accept all the default ad settings on websites in order to have free access to web content/services
• Set their antivirus software to block tracking /cookies
• Use an ad blocker (e.g. web browser extensions like uBlock, AdBlock, etc.)
• Block cookies on websites
• Use a specific web browser that limits ad tracking by default
• Use private browsing mode (which will not remember the pages visited nor leave cookies)
• Use the interface asking for their consent to different specified uses of data and different specified companies when they visit a website,
part of an industry initiative called the Transparency & Consent Framework (“TCF”)
Frequency of Usage by End-users
Accept all default settings 40% 31% 22% 7%
Antivirus software 30% 26% 38% 7%
Ad Blocker 30% 23% 42% 6%
Block cookies 26% 28% 42% 5%
Web browser limiting ad tracking 27% 25% 40% 9%
Private browsing 25% 31% 38% 6%
Transparency & Consent Framework
28% 32% 28% 12%
(TCF)
0% 10% 20% 30% 40% 50% 60% 70% 80% 90% 100%
Always or frequently Sometimes Rarely or never Don't know
Q6. How often, if at all, do you do each of the following while using Internet?
Base: Adults (16 – 60/75) c.1000 respondents per market. Online interviews. Fieldwork dates and base sizes in EDAA Research methodology section.
Average of country scores.
The survey results underline that:
• In terms of accepting all the default website ad settings, 40% of all respondents “always” or “frequently” do this, whilst only 22% “rarely”
or “never” do. Respondents from Spain are most inclined to accept default settings, with 48% of them doing it “always” or “frequently”.
Respondents in France are far less inclined to accept default settings, with 27% percent “rarely” or “never” doing this.
• Antivirus solutions that block block tracking /cookies are employed by 30% of respondents “always” or “frequently”. The highest rates of
blocking tracking/cookies through antivirus were registered in Italy (36%) and Germany (32%).
• Italian respondents are most likely to “always” or “frequently” det their antivirus software to block tracking /cookies (36%), while
Romanians are least likely to do this (47%). Amongst all respondents, 30% “always” or “frequently” use their antivirus software for this
purpose, while 38% will “rarely” or “never” do so.
• Ad blocker usage remains high, with 30% of respondents declaring they “always” or “frequently” use an ad blocker. The highest rate of ad
blocker usage from the surveyed markets was recorded in Poland (35%), while the lowest was in Romania, where 48% of respondents
stated that they rarely or never use such tools. Poland is trailed by Germany (31% of respondents frequently using ad-blockers), while
46% of respondents in Ireland rarely or never use them.
• Cookies are blocked “always” or “frequently” by 30% of respondents in Germany, and “rarely” or “never” by respondents from Poland, 51%
of them seldomly resorting to this. Overall, 26% of respondents block cookies “always” or “frequently” when browsing, while 42% do this
“rarely” or “never”.
• Private browsing is “always” or “frequently” used by 25% of all respondents, with the peak rates once again reported in Poland (47%) and
the lowest in Romania (45%).
• Use of IAB Europe’s Transparency and Consent Framework by respondents is split in terms of frequency. 28% of respondents declare that
they “always” or “frequently” knowingly make use of it, while an equal percentage very “rarely” or “never” does and many are
unsure.
www.edaa.eu Consumer Awareness & Impact of the European Self-Regulatory Programme for OBA 17
info@edaa.euIn terms of accepting all the default
website ad settings, 40% of all
respondents “always” or “frequently”
do this, yet Ad blocker usage remains
high, with 30% of respondents
declaring they “always” or “frequently”
use an ad blocker.
4.7 Enhancing youronlinechoices.eu
The closing question was designed to identify further avenues for improvement of the www.youronlinechoices.eu portal and assess which, if
any, activities respondents would like to see on the www.youronlinechoices.eu website.
What respondents want most is understanding how they can control advertising companies having access to their data (38%) and clearer
explanations about how their data is being used by organisations (38%), with respondents flagging these as their main choices. There are
followed by having more information on the organisations that use their data (36%), the ability to customise the data they share (36%), and
being able to easily manage their ad choices across multiple websites (35%). Only one in fourteen (7%) of respondents said that they would
not like to be able to do any of these six activities.
Activities on YourOnlineChoices
Understand how I can control advertising companies having access to my data 38%
Have clearer explanations about how my data is being used by the organisations that use my data 38%
Have more information on the organisations that use my data 36%
Customise what data I share 36%
Be able to easily manage my ad choices across multiple websites 35%
Access more information about managing my online ad experience 27%
Would not like to be able to do any of these activities 7%
Q10. Which, if any, of the following activities would you like to be able to do on
youronlinechoices.eu?
Base: Adults (16 – 60/75) c.1000 respondents per market. Online interviews. Fieldwork dates and base sizes in EDAA Research methodology section.
Average of country scores.
www.youronlinechoices.eu
www.edaa.eu European Advertising Consumer Research Report 2021 18
info@edaa.eu5. Conclusions
1. Awareness of the AdChoices Icon is growing in all markets, often strongly
Awareness of the AdChoices Icon has shown a marked improvement since the previous versions of the survey. In all ten surveyed markets
respondents have shown an increased awareness of the Icon. In fact, there has been a double-digit percentage point rise in AdChoices Icon
awareness since the 2016 iteration of the study in 8 out of 10 markets. What is both exciting and encouraging is that this trend applies to both
the Icon accompanied by the explanatory AdMarker text and also the Icon as a standalone symbol without it, with three countries reporting
hikes in awareness as high as 20 percentage points above the findings of the last survey iteration in 2016.
2. Engagement with the AdChoices Icon reaches higher levels
Marked improvement across all ten markets was also recorded in terms of engagement with the AdChoices Icon. About half or more of
respondents in each of Sweden, Belgium, Romania, Germany, Spain, and Poland declare that they have clicked on the Icon. Compared to the
2015 vs. 2016 growth rate, the increase that the 2020 survey shows in terms of engagement is striking. Germany is just one example of a
market that nearly doubled the engagement rate since 2016. In previous survey iterations, engagement levels in Great Britain were around a
quarter. In 2020, this increased to 39%.
3. The AdChoices Icon has a clear positive impact on end-user trust in brands, websites, and transparency in the overall digital
advertising ecosystem, and on the concept of OBA as a whole
More than three in ten respondents from all markets have stated that they have a higher level of trust in the brand advertised when the Ad-
Choices Icon is present, and the proportion claiming to trust the brand being advertised increased in 9 out of 10 markets. Italy is a notable
example of the positive influence the AdChoices Icon can have on brand trust: more than half of respondents from this market demonstrated
increased trust in brands that bear the AdChoices Icon on their ads.
Based on this evidence that the AdChoices Icon improves brand trust,
we encourage brands to ensure that they work with partners in their supply chain
that can demonstrate full compliance with the
industry’s self-regulatory approach administered by EDAA.
The trend holds true beyond increased trust of the brand being advertised. The AdChoices Icon is a boon for OBA practices in general. Par-
ticularly in markets where OBA favourability ratings are on the lower end of the scale, the presence of the AdChoices Icon and the ability
for users to manage their online privacy preferences increases OBA favourability. Having the Icon present increases OBA favourability by 22
percentage points in Ireland and 18 percentage points in Great Britain, for example. Over half of respondents in Spain and Poland are more
favourable towards the concept of OBA.
Presence of the AdChoices Icon also increases the proportion of respondents who trust websites that feature ads and overall transparency
in the digital advertising industry. More than half of respondents in Italy declare increased trust in websites that feature ads bearing the Icon.
A similar approach was recorded in Spain. Over 4 in 10 respondents from Romania, Poland, and Great Britain also put more trust in websites
which display the AdChoices Icon.
Based on these findings, publishers should be encouraged
to adopt the AdChoices Icon from the EDAA on their
websites, as a complementary and well recognised transparency vehicle
towards their viewers, to inform that third party advertising
may be happening across their platforms.
The increased awareness and favourability of the Icon serves as a strong incentive for greater uptake at site level (this can be applied in the
footer of web pages and link through to the site’s advertising policies, for instance).
4. There is a need to further improve understanding of the AdChoices Icon
Understanding what the Icon means represents both a challenge and an opportunity. Improvement from previous iterations of the survey can
be observed, particularly in terms of how high on the list of options for respondents the correct option ranks.
www.edaa.eu Consumer Awareness & Impact of the European Self-Regulatory Programme for OBA 19
info@edaa.euIt is clear, however, that the EDAA Programme, and the wider digital advertising ecosystem, need to continue placing an emphasis on further
educating consumers and raising awareness about the options available to them that allow for a healthy digital advertising experience.
5. User behaviour shows promising trends but also highlights areas for future focus
Insofar as making a complaint about their Online Behavioural Advertising (OBA) choices not being respected, more than 1 in 3 respondents
have expressed a willingness to take this step. For those wishing to do so, EDAA makes available prominent information on the www.
youronlinechoices.eu website, which is visited tens of millions of times annually. The self-regulatory programme is also integrated with well-
established complaint handling bodies (SROs) at national level, under the umbrella of the European Advertising Standards Alliance (EASA).
These ensure that consumers can make queries or complaints and receive responses in their own language. It is important to make these
options as prominent as possible: of those wanting to make a complaint about Online Behavioural Advertising (OBA), 21% don’t know with
whom such a complaint can be filed. It is positive to observe that 28% of respondents are aware that they can make complaints, if they wish
to do so, through the YourOnlineChoices.eu website and to their national advertising Self-Regulatory Organisation (SRO), more than any other
route. This indicates potential key advantages of the EDAA Programme in terms of consumers’ ability to raise queries and complaints and
learn more about the types of advertising they receive online.
6. Consumers care about how companies are using their information, and have views on what controls they would use, if
available
As EDAA is engaged in a process to review and better understand consumer expectations of YourOnlineChoices, it is noteworthy that very
few respondents seemed disinterested in having greater control over their online experience. Many respondents expressed a strong desire
for clearer explanations about how their data is being used by the organisations that use their data and understand how they can control
advertising companies having access to their data.
One in two respondents is likely to seek more information about OBA.
The Programme and the latest EDAA efforts in the field of consumer education
(most notably the recent project with Media Smart and the youronlinechoices.eu website)
contribute significantly to this very need. In fact, this propensity of respondents
to improve their understanding of online advertising practices
and the ecosystem as a whole is a valuable driver
and insight for the future development of the EDAA’s cross-industry,
pan-European self-regulatory programme.
EDAA is open and inclusive to consumer views in its approach and the learnings from this report will support our efforts as we lead an
industry-wide dialogue to address consumer needs and improve the advertising experience first-and-foremost from a consumer-centric
viewpoint.
Appendix for previous methodologies
Methodology and findings of the European Advertising Consumer Research Report 2016 are available here
Methodology and findings of the European Advertising Consumer Research Report 2015 are available here
Methodology and findings of the European Advertising Consumer Research Report 2014 are available here
www.edaa.eu European Advertising Consumer Research Report 2021 20
info@edaa.euCONTACT
info@edaa.eu
edaa.eu
@EDAATweets
26, Rue des Deux Églises
1000, BrusselsYou can also read


