Data and Business Intelligence Systems for Competitive Advantage: prospects, challenges, and real-world applications
←
→
Page content transcription
If your browser does not render page correctly, please read the page content below
Mercados y Negocios
                                                             ISSN: 1665-7039
                                                             ISSN: 2594-0163
                                                             revistamercadosynegocios@cucea.udg.mx
                                                             Universidad de Guadalajara
                                                             México

Data and Business Intelligence Systems
for Competitive Advantage: prospects,
challenges, and real-world applications
Djerdjouri, Mohamed
Data and Business Intelligence Systems for Competitive Advantage: prospects, challenges, and real-world
applications
Mercados y Negocios, no. 41, 2020
Universidad de Guadalajara, México
Available in: https://www.redalyc.org/articulo.oa?id=571861494009

This work is licensed under Creative Commons Attribution-NonCommercial 4.0 International.

                                        PDF generated from XML JATS4R by Redalyc
                            Project academic non-profit, developed under the open access initiative
Mohamed Djerdjouri. Data and Business Intelligence Systems for Competitive Advantage: prospects, c...
Artículos de investigación
Data and Business Intelligence Systems for Competitive Advantage: prospects,
challenges, and real-world applications
Sistemas de datos e inteligencia empresarial para una ventaja competitiva: perspectivas, desafíos y aplicaciones del
mundo real
Mohamed Djerdjouri Redalyc: https://www.redalyc.org/articulo.oa?
State University of New York, Estados Unidos id=571861494009
djerdjm@plattsburgh.edu
Received: 12 October 2019
Accepted: 09 December 2019
Abstract:
is paper is intended as a short introduction to Business Intelligence (BI) and Analytics systems. e main aim of the paper is to
raise awareness of organizations in the developing world, about the benefits of these technologies and the crucial role they play in
the survival and competitiveness of the firm in the complex and turbulent global market. For many years, many small and medium-
sized businesses (SMBs) have not followed large organizations in the implementation of BI technologies. e main reason stated
by SMBs is the complexity and high cost of deploying and managing BI systems. However, according to recent IT industry survey
of SMBs executives, they now realize the crucial role BI systems play in the company’s performance, and competitiveness and they
are now increasingly investing in and implementing BI technologies.
Jel Code: M15.
Keywords: SMBs, turbulent global market, managing BI systems, IT industry.
Resumen:
El objetivo principal del documento es sensibilizar a las organizaciones en desarrollo sobre los beneficios de la tecnología y el papel
crucial que desempeña en la supervivencia y competitividad de la empresa ante el complejo y turbulento mercado global. Durante
muchos años, las pequeñas y medianas empresas (PYMES) no han seguido a las organizaciones grandes en la implementación del
modelo Business Intelligence (BI). La razón principal declarada por las pymes es la complejidad y el alto costo de implementar
y administrar sistemas de BI. Sin embargo, según una encuesta reciente de la industria de TI a los ejecutivos de la PYME, ahora
se dan cuenta del papel crucial que juegan los sistemas de BI en el rendimiento y la competitividad de la empresa y ahora están
invirtiendo cada vez más en su implementación.
Código Jel: M15.
Palabras clave: PYME, turbulento mercado global, gestión del Business Intelligence, Industria IT.
INTRODUCTION
Second to its people, a company’s most valuable asset is information. Information is a critical resource for any
organization. In this rapidly changing global market, consumers are now demanding quicker, more efficient
service from businesses. To stay competitive, companies must meet or exceed the expectations of consumers.
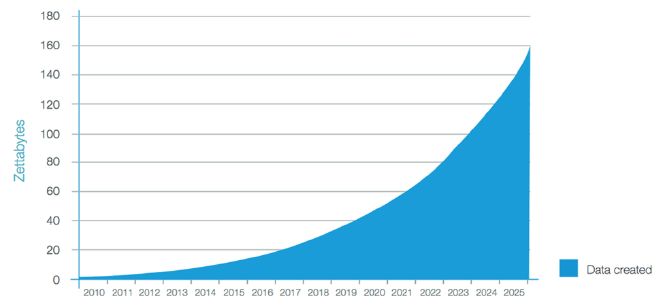
Moreover, the world has witnessed an information explosion. Data is being generated at a very high pace, and
more and more of this Data is unstructured, which makes its analysis challenging to say the least. Nowadays
Data is seen as a new class of economic assets, just like currency or gold.
PDF generated from XML JATS4R by Redalyc
Project academic non-profit, developed under the open access initiative 5Mercados y Negocios, 2020, no. 41, Enero-Junio, ISSN: 1665-7039 2594-0163
FIGURE 1
e Information Explosion
(zettabyte = unit of information equal to one sextillion (1021) or, strictly, 270 bytes)
Source: Own elaboration.
So to stay competitive and to improve its own performance, a company must make decisions, oen
promptly, based on timely and accurate information. To this end, many leading innovative companies are
adopting and relying on Business Intelligence systems to stay ahead of trends and future events. Also, Business
Intelligence (BI) expedites decision making. is, in turn, helps companies to act quickly and correctly on
information before competing businesses do. e result of all this is a competitively superior performance
for the company, which allows for an appropriate and timely response to customer problems and primary
concerns.
e ultimate achievement is improved customer experience. BI refers to technologies, applications and
approaches practices for the collection, integration, analysis, and presentation of business information
(Hedgebeth, 2007). BI helps managers gain insights into their own business as well as into the market in
general, and it provides them with valuable facts and information that improves the quality of their decisions.
(Chaudhuri, Dayal & Narasayya, 2011)
Analytics, on the other hand, is defined as the scientific process of transforming data into insight for
making better decisions. A sound BI system provides the decision-maker with valuable information, at the
appropriate time and in the right format. e ability to mine and analyze big data gives organizations deeper
and richer insights into business patterns and trends, helping drive operational efficiencies and competitive
advantage in manufacturing, security, marketing, and IT (Ghasemghaei, 2019). Sun and Wang (2017) state
that big data have become a strategic resource for industry, business, and national security. Moreover, Sun and
Wang (2017) affirm that data nowadays have also become a strategic enabler of exploring business insights
and the economics of services.
FIGURE 2
Data mining
Source: Own elaboration.
BI systems merge data with different formats and from various sources and gather it into data warehouses
or data marts. en they use Analytics to process these data to provide historical, current and predictive
PDF generated from XML JATS4R by Redalyc
Project academic non-profit, developed under the open access initiative 6Mohamed Djerdjouri. Data and Business Intelligence Systems for Competitive Advantage: prospects, c...
outlook of business operations and the market in which they operate. e information is usually presented
through a dashboard or analytics interface. BI soware makes analysis and report-making much faster and
more reliable.
In her article, Loshin (2012) reported that BI is used to understand and improve performance and to cut
costs and identify new business opportunities, this can include, among many other things:
o Analyzing customer behaviors, buying patterns, and sales trends
o Identifying opportunities to reduce costs
o Measuring, tracking and predicting sales and financial performance
o Budgeting and financial planning and forecasting
o Tracking the performance of marketing campaigns
o Optimizing processes and operational performance
o Improving delivery and supply chain effectiveness
o Web and e-commerce analytics
o Customer relationship management
o Risk analysis
o Strategic value driver análisis
Jennifer Lonoff Schiff (2013), reports that CIO.com surveyed a sample of BI experts and IT executives
about the benefits of investing in BI systems. e consensus among these experts is that BI improves the
bottom line of businesses. And the fundamental reasons for that are that BI helps organizations: - Get fast
answers to critical business questions; align business activities with corporate strategy; empower employees;
reduce time spent on data entry and manipulation; gain insights into customers; benchmark sales channel
partners; identify areas for cost-cutting; and boost productivity.
BI simplifies information discovery and analysis, making it possible for decision-makers at all levels of an
organization to quickly and more easily access, understand, analyze, collaborate, and act on information,
anytime and anywhere. BI helps move from just consuming information to developing in-depth contextual
knowledge about that information. By tying strategy to metrics, organizations can gain competitive
advantage by making better decisions faster, at all levels of the organization. BI is the capability that
transforms data into meaningful, actionable information.
BI soware consolidates data from different sources and assembles it in “data warehouses” or “data marts”
that eliminate distinctions in data formats. It then presents the results through a reporting, analytics or
dashboard interface. BI soware thus serves as a common platform for shared, company-wide insight. BI
soware makes analysis and report making much faster and more reliable.
TECHNOLOGY AND TOOLS
A typical architecture for supporting BI within a firm is shown in figure 3 below. A BI architecture is a
framework for organizing the data, information management, and technology components that are used
to build BI systems for reporting and data analytics. e underlying BI architecture plays a vital role in BI
projects because it affects the development and implementation of timely decisions. e data over which BI
tasks are performed are typically loaded into a repository called the data warehouse that is managed by one or
multiple data warehouse servers. e data oen comes from different sources, operational databases across
departments within the firm, as well as external sources. e data have different formats and structures. Also,
both structured and unstructured data may be used. All these data need to be standardized and integrated
in preparation for BI tasks. e technologies for preparing the data for BI are known as Extract-Transform-
Load (ETL) tools. Also, a popular engine tool for storing and querying data warehouses is Relational
Database Management Systems (RDBMS). Large data warehouses usually deploy parallel RDBMS engines
so that SQL queries can be executed over large volumes of data.
PDF generated from XML JATS4R by Redalyc
Project academic non-profit, developed under the open access initiative 7Mercados y Negocios, 2020, no. 41, Enero-Junio, ISSN: 1665-7039 2594-0163
FIGURE 3
Typical Business Intelligence (BI) architecture
Source: Own elaboration.
e technology components, referred to as BI tools in figure 4 above, are used to present information to
business users and enable them to analyze the data. is includes the BI tools (or BI soware suite) to be
used within an organization as well as the supporting IT infrastructure such as hardware, database soware,
and networking devices. ere are various types of BI applications that can be built into an architecture: -
reporting, ad hoc query, and data visualization tools, as well as online analytical processing (OLAP) soware,
dashboards, performance scorecards, data mining engines, and web analytics, to name a few.
FIGURE 4
Data Integration Architecture
Source: Own elaboration
Reporting tools are an essential way to present data and easily convey the results of analysis. BI users
are increasingly business users who need quick, easy-to-understand displays of information (Mikalef et al.,
2019). And report writers allow users to design and generate custom reports Ad hoc query tool is an end-
user tool that accepts an English-like or point-and-click request for data and constructs an ad hoc query to
retrieve the desired result. Visualization tools: help users create advanced graphical representations of data
via simple user interfaces. is tool help users uncover patterns, outliers, and relevant facts. Online Analytical
Processing (OLAP) tools enable users to analyze different dimensions of multidimensional data. e OLAP
server understands how data is organized in the database and uses special functions for analyzing the data.
Examples of analysis tools are time series and trend analysis.
Dashboards typically highlight key performance indicators (KPIs), which help managers focus on the
metrics that are most important to them. Dashboards are oen browser-based, making them easily accessible
by anyone with permission. Performance scorecards attach a numerical weight to performance and map
progress toward goals. ink of it as dashboards taken one step further. Scorecards are an effective way to
keep tabs on key metrics.
Data mining tools allow users to analyze data from many different dimensions or angles, categorize it,
and summarize the relationships identified. Technically, data mining is the process of finding correlations
or patterns among dozens of fields in large relational databases
Web analytics tools enable users to understand how visitors to a company’s website interact with the
pages (Imhoff, Galemmo & Geiger, 2003; Shen, 2013). ey perform the measurement, collection, analysis,
PDF generated from XML JATS4R by Redalyc
Project academic non-profit, developed under the open access initiative 8Mohamed Djerdjouri. Data and Business Intelligence Systems for Competitive Advantage: prospects, c...
and reporting of Web data for purposes of understanding and optimizing Web usage. ey are also used for
business and market research, and to assess and improve the effectiveness of a web site.
BENEFITS
A well-implemented BI strategy can deliver real insight for an organization. BI systems help the organization
make better decisions with higher speed and confidence; recognize and maximize the firm’s strengths;
shorten marketing efforts; improve customer relationships; align effort with the firm’s strategy and improve
revenues and profits (Williams & Williams, 2010).
Moreover, BI systems help firms quantify the value of relationships with suppliers and customers, and this
gives them more leverage during negotiations. Jennifer Lonoff Schiff (2013) reports that in a survey of executives
of “500” companies, they revealed a variety of benefits these firms, the main ones include: Eliminate guesswork.
get faster answers to your business questions; get key business metrics reports when and where you need
them; gain insight into customer behavior; identify cross-selling and up-selling opportunities; learn how to
streamline operations; improve efficiency; learn what your real manufacturing costs are; manage inventory
better and; see where your business has been, where it is now and where it is going.
Without business intelligence, a firm runs the risk of making critical decisions based on either insufficient
or inaccurate information. Robert Eugene Miller (2013) also reports that executives that a well-implemented
BI strategy helps firms in the following ways:
- Quickly identify and respond to business trends
- Empowered staff using timely, meaningful information and trend reports
- Easily create in-depth financial, operations, customer, and vendor reports
- Efficiently view, manipulate, analyze, and distribute reports using many familiar tools
- Extract up-to-the-minute high-level summaries, account groupings, or detail transactions
- Consolidate data from multiple companies, divisions, and databases
- Minimize manual and repetitive work
It is reported in the literature that successful implementation and usage of BI has shown excellent results in
all sectors of the economy- healthcare, e-commerce, government, industry, etc. On average, companies have
reported an ROI of $10.66 for every dollar spent on business intelligence/analytics. Real-world applications
in different sectors of the economy will be presented in section 5 below.
CHALLENGES
According to the Garner Analytics firm research, 70% to 80% of corporate BI projects fail. Firms encounter
many challenges when developing and implementing a BI strategy. e two main ones are: user resistance
for adoption, Poor data quality, and Others challenges
User resistance for adoption
Like for any new IT system, user resistance is one significant barrier to BI success. Users resist changing
the way they do things unless their current methods are tedious and time-consuming. Also, many firms make
the mistake of believing that if they implement the system first, people will use it (build it, and they will come
cliché). e way around this pitfall is for the firm to involve all the stakeholders from the beginning o the
project and throughout the implementation process. Users should define what they really need from a BI
project. When the implementation ends, the majority of the users will already be familiar with the system
and know how to use it. ey also feel empowered when their suggestions are implemented. us to ensure
success, the firm must high rates of user adoption.
Poor data quality
PDF generated from XML JATS4R by Redalyc
Project academic non-profit, developed under the open access initiative 9Mercados y Negocios, 2020, no. 41, Enero-Junio, ISSN: 1665-7039 2594-0163
Without the collection, storage, and access to reliable data, a firm cannot get any valuable and accurate
insights into their business and the business environment. Data is the most essential component of any BI
system. e main challenge here is for the firm to make sure the data stores and data warehouses are in
good working order before they can begin extracting and acting on insights. e risk is that if that is not
done correctly, critical and strategic decisions will be made based on unreliable information. e firm must
establish and maintain an appropriate level of data quality to feed into the BI system.
Others challenges
e other challenges include breaking down departmental knowledge silos; integrating the BI tool with
other operational, performance management and transactional system; transforming the workplace from
a culture of ‘gut feel’ to one of data-based decision-making; securing executive sponsorship and necessary
financial backing,
Finally, measuring the performance of BI is a significant challenge and can be problematic. e firm should
develop and employ a set of key metrics to help evaluate performance and return on investment. In practice,
many firms use metrics such as the time it takes to answer user queries, the depth, and usability of the
information obtained from the BI tool and, the number and quality of decisions made as a result of insights
generated via the BI tool
BUSINESS AND GOVERNMENT APPLICATIONS
Proper implementation of BI technologies can reap many benefits for the firm. Excellent results have been
reported across all sectors of the economy: healthcare, government, and industry. It is estimated that for
each dollar spent in BI technologies and Analytics technology, there is, on average a ten dollars return on
investment. In this section, a few successful implementations of BI will be presented. e summaries below
are “literally” taken from the articles in which the cases were published.
New York State Department of Taxation and Finance: Using Business Intelligence to improve tax
revenues and citizen equity .(IBM Smarter Planet Leadership Series, 2011)
e New York State Department of Taxation and Finance resolved to make its processes more data-
driven. e Tax Audits department has a team of 1600 auditors. Research has shown that more than half
of U.S. taxpayers willing to take liberties with their taxes when they sense that the government lacks the
information to catch them. e core of the deterrent is the incorporation of more data sources–combined
with the use of predictive intelligence capabilities–to accurately identify potentially questionable returns.
e main flaw with the current process (“pay and then chase”) was that the problems were oen detected
only aer refund checks had been sent and cashed. Also, the process was time-consuming, drained valuable
resource and was oen fruitless. e department wanted to change the process to catch and rectify such
refunds before they were sent out.
e system: e New York State Department of Taxation and Finance achieved this goal by developing
a BI system called Case Identification and Selection System (CISS). e system is not merely used to search
for questionable returns patterns with historical data stored in the department’s warehouse.
e analytics are embedded directly into the mainstream return process. e department uses predictive
intelligence to determine dynamically when to process a refund request and when to set it aside for further
analysis or to reject the refund directly. In a nutshell, the system compares each open case with profiles of
past similar cases to recommend which cases should be pursued and through which means, to maximize
the overall amount of revenue collected. e results were outstanding. e New York State Taxation and
Finance Department reported the following critical results and benefits:
- $1.2 billion reduction in improper or questionable refunds paid from the State of New York’s coffers,
plus another $400 million reduction projected in 2011
- Dramatic reduction in the costs and inefficiencies associated with “pay and chase” policies
PDF generated from XML JATS4R by Redalyc
Project academic non-profit, developed under the open access initiative 10Mohamed Djerdjouri. Data and Business Intelligence Systems for Competitive Advantage: prospects, c...
- $100 million increase in delinquent tax collections through the use of optimization algorithms
- Over a 350% increase in criminal tax fraud investigations due to greater interdepartmental
collaboration on cases.
Business Intelligence and Analytics in Politics: e Real story behind President OBAMA Election
Victory (Siegel, 2013)
Barack Obama’s 2012 campaign for a second term employed more than 50 Business Intelligence/
Analytics experts. e traditional political campaigns up to now spent large amounts of money focusing on
trying to sway swing voters in swing states. e Obama campaign management hired a multi-disciplinary
team of statisticians, predictive modelers, data-mining experts, mathematicians, soware programmers, and
quantitative analysts. It eventually built an entire Business Intelligence/Analytics department five times as
large as that of its 2008 campaign.
What the Obama BI team realized is that presidential campaigns must focus even more narrowly than
that. ey applied predictive analytics (BI technology) that pinpoints truly persuadable voters. e BI team
moved beyond simple poll analysis. Its real power came from in trying to influence the future rather than to
speculate on it. Forecasting calculates an aggregate view for each US state, whereas predictive analytics (BI
technology) delivers predictions for each individual voter.
During the six months leading up to the election, the Obama team launched a full-scale and all-front
campaign, leveraging Web, mobile, TV, call, social media, and analytics to directly micro-target potential
voters and donors with tailored messages. Instead of focusing on just “swing” voters (mostly independent
voters who have not made up their minds and are persuadable to vote one way or another “swingable.” e
Obama BI team realized that a “persuadable voter” (swingable) is a person who will be influenced to vote for
the candidate by a call, a door knock, flyer, or TV ad?
e benefits: e Obama BI team predicted an entirely new thing. Beyond predicting which a constituent
was destined to vote, they also predicted whether each individual voter would be persuaded by campaign
contact. e best way to do persuasion is to predict it. Beyond identifying voters who will come out for
Obama if contacted, the BI models had to distinguish those voters who would come out for Obama in any
case as well as those who were at risk of being turned off by campaign contact and switching over to for vote
for the opponent.
e necessity was to learn to discriminate, voter by voter, whether contact would persuade. ere were
only four especially close states in the 2012 election. Only Florida, North Carolina, Ohio, and Virginia were
decided by less than 5 percentage points. e smallest number in 30 years (Reagan vs Mondale).
e results: More voters were convinced to choose Obama, in comparison to traditional campaign
targeting. Most people predicted the election to be very close, but in fact, Obama won a decisive victory.
Obama got 51.1 percent of the popular vote to Mitt Romney's 47.2 percent, a four-point margin. Moreover,
President Obama won 26 states and the District of Columbia, and he also won 332 electoral votes against
206 for Romney (It takes 270 electorate votes to win the Presidential election). It is widely believed that the
use of BI/Analytics by Obama’s Campaign led to the landslide victory by Barack Obama. (Scherer, 2012)
Improving Financial Reserve Management in the Insurance Industry (Microso, 2019)
EM Insurance company located in the state of Iowa employs more than 2100 people. With assets of
approximately $3 billion, it sells its products through independent insurance agencies throughout the United
States. EMC Insurances Companies struggled with pinpointing the right amount of money to hold in
reserve against potential case payouts; keeping too much or too little could be disadvantageous to the firm’s
performance.
Aer experience a run-up in reserves, EMC took steps to improve its financial reserve management.
e company had a great deal of insurance claim data but a limited ability to analyze the information.
Unexpected fluctuations of financial reserves prompted EMC to use BI technologies to uncover anomalies,
PDF generated from XML JATS4R by Redalyc
Project academic non-profit, developed under the open access initiative 11Mercados y Negocios, 2020, no. 41, Enero-Junio, ISSN: 1665-7039 2594-0163
correlations, relationships, and patterns hidden within the firm’s warehouse of claim data. e BI system
included predictive modeling for improved claim outcomes.
Results/Benefits: e company can identify casualty and worker’s compensation claims that are likely
to have a negative outcome. ere is also an apparent enhancement of the accuracy and reliability of
data. Executive decision making is supported with improved analysis. Expenses are now more effectively
controlled.
ere are many more success stories in business and government of organizations which decision process
and quality improved significantly with the appropriate implementation of BI technologies. e main benefit
for these organizations was the improvement of their competitiveness in the Marketplace.
e Gartner report (2019) mentioned that the benefits of fact-based decision-making are clear to
business managers in a broad range of disciplines, including marketing, sales, supply chain management,
manufacturing, engineering, risk management, and finance and HR. Significant changes are imminent to the
world of BI and analytics, including the dominance of data discovery techniques, more extensive use of real-
time streaming event data, and the eventual acceleration in BI and analytics spending when big data finally
matures, said Roy Schulte, vice president, and distinguished analyst at Gartner. As the cost of acquiring,
storing and managing data continues to fall, companies are finding it practical to apply BI and analytics in a
more extensive range of situations. Nowadays thousands of businesses in all sizes, in all industries, all around
the world are implementing and utilizing Strategic Business Intelligence (Stackpole, 2011).
e Chief Information Officers focus on BI, and analytics looks set to continue through 2017, according
to Gartner (2013). Gartner's user surveys show that "improved decision making" is the key driver of BI
purchases. Capabilities that will evolve BI from an information delivery system to a decision platform will
increase the value of BI and drive its growth (Gartner Report, 2011 and 2019).
CONCLUSION
According to the 2019 Gartner report, by 2020, the number of data and analytics experts in business units
will grow at three times the rate of experts in IT departments, and by 2021, analytics and BI adoption will
increase from 35% of employees to over 50%, including new classes of users, particularly front-office workers.
BI is essential for the firm’s growth and decision-making. It gives companies a more structured way to look
at data while providing in-depth interpretations. It aids decision making via real-time, interactive access to
and analysis of vital corporate information. e business and technological advances promised by BI are still
being developed, explored, and enhanced.
For many years, many small and medium-sized businesses (SMBs) have not followed large organizations
in the implementation of BI technologies. e main reason stated by SMBs is the complexity and high cost
of deploying and managing BI systems. However, according to recent IT industry survey of SMBs executives,
they now realize the crucial role BI systems play in the company’s performance, and competitiveness and
they are now increasingly investing in and implementing BI technologies.
In the majority of developing economies, firms face much more significant and numerous challenges
because most organizations do not have access to the latest technologies. However, the biggest obstacle to
implementing BI systems stems from the lack of reliable and quality data. As mentioned earlier in this paper,
data is the lifeblood of BI systems. Today’s data-driven business culture has given organizations new resources
and competitive advantages through the integration of data into everyday operations and strategic business
decisions.
However, the managerial culture should change to adopt more a data-driven decision-making process.
Organizations should realize the importance of collecting, storing, and analyzing internal as well as external
data to harness the information obtained from BI systems and Analytics to improve business processes,
PDF generated from XML JATS4R by Redalyc
Project academic non-profit, developed under the open access initiative 12Mohamed Djerdjouri. Data and Business Intelligence Systems for Competitive Advantage: prospects, c...
uncover insights into customer buying patterns, internal cots, revenues, and profitability trends and of other
critical business issues.
REFERENCES
Chaudhuri, S., Dayal, U., & Narasayya, V. (2011). An overview of business intelligence technology. Communications
of the ACM, 54(8), 88-98.
Deloitte Report (2014). e 2014 Global Report. UK: Deloitte.
Gartner. (2011). Magic Quadrant for Business Intelligence Platforms. Core Research Note G00210036. Gartner.
Gartner. (2019). Gartner market trends report: how to win as wan edge and security converge into secure access service
edge. Core Research Note G0035476. Gartner.
Ghasemghaei, M. (2019). Does data analytics use improve firm decision making quality? e role of knowledge sharing
and data analytics competency. Decision Support Systems, 120, 14-24.
Hedgebeth, D. (2007). Data-driven decision making for the enterprise: an overview of business intelligence
applications. Vine, 37(4), 414-420.
IBM (2011). Smarter Planet Leadership Series. New York: IBM. Link: ibm.com/smarterplanet
IDC (2014). e Digital Universe of Opportunities: Rich Data and the Increasing Value of the Internet of ings.
Massachusetts: EMC.
Imhoff, C., Galemmo, N., & Geiger, G. (2003). Mastering data warehouse design: relational and dimensional techniques.
John Wiley & Sons.
Lonoff, J. (2013). 8 Ways Business Intelligence Soware Improves the Bottom Line. CIO FEATURE. Link: https://
www.cio.com/article/2384577/8-ways-business-intelligence-software-improves-the-bottom-line.html
Loshin, D. (2012). Business intelligence: the savvy manager's guide. Massachusetts: Morgan Kaufmann.
Mikalef, P., Krogstie, J., Pappas, O., & Pavlou, P. (2019). Exploring the relationship between big data analytics
capability and competitive performance: e mediating roles of dynamic and operational capabilities.
Information & Management.
Microso (2019). Customer Stories. Toronto: Microso. Link: https://customers.microsoft.com/en-CA/search?sq=
EMC&ff=&p=0&so=story_publish_date%20desc
Scherer, M. (2012) Inside the Secret World of the Data Crunchers Who Helped Obama Win. Time, Nov. 7, 2012.
Shen, G. (2013) Big Data, Analytics, and Elections. Analytics Magazine, e Fiscal Times, January 21, 2013).
Stackpole, B. (2011). A midmarket guide to leveraging data as an asset with business intelligence and analytics.
SearchBusinessAnalytics.com.
Sun, Z., & Wang, P. (2017). Big data, analytics and intelligence: an editorial perspective. Journal of New Mathematics
and Natural Computation, 13(2), 75-81.
Sun, Z., Sun, L., & Strang, K. (2018). Big data analytics services for enhancing business intelligence. Journal of Computer
Information Systems, 58(2), 162-169.
Williams, S., & Williams, N. (2010). e Profit Impact of Business Intelligence. San Francisco: Morgan Kaufmann
(Elsevier).
Alternative link
http://mercadosynegocios.cucea.udg.mx/index.php/MYN/article/view/7537 (pdf)
PDF generated from XML JATS4R by Redalyc
Project academic non-profit, developed under the open access initiative 13You can also read