A CONTRIBUTION TO pMPA - Scottish Natural Heritage
←
→
Page content transcription
If your browser does not render page correctly, please read the page content below
A CONTRIBUTION TO pMPA
          DISCUSSIONS

   Identifying zones where basking sharks occur
    more frequently within a possible MPA to aid
              management discussions

                         For further information on this report please contact:

                                      Dr Suzanne Henderson
                                      Scottish Natural Heritage
                                      Great Glen House
                                      INVERNESS
                                      IV3 8NW
                                      Telephone: 01463 725238
                                      E-mail: suzanne.henderson@nature.scot

This report should be quoted as:

M. J. Witt, L. A. Hawkes and S. M. Henderson. (2019) Identifying zones where basking
sharks occur more frequently within a possible MPA to aid management discussions.

This report, or any part of it, should not be reproduced without the permission of Scottish Natural Heritage. This
permission will not be withheld unreasonably. The views expressed by the author(s) of this report should not be
taken as the views and policies of Scottish Natural Heritage.

                                     © Scottish Natural Heritage Year 2019
Identifying zones where basking sharks occur
            more frequently within a possible MPA to aid
                      management discussions

Contractor: University of Exeter
Year of publication: 2019

Summary
Scottish Natural Heritage (SNH) has provided advice on four Marine Protected Areas (SNH
2014) to Scottish Government, and a public consultation on these possible MPAs (pMPA) is
planned in 2019. One of these pMPAs is the Sea of the Hebrides, which includes the
protected feature, basking sharks as well as minke whale, oceanographical fronts and the
geomorphological feature Inner Hebrides Carbonate Production Area.

To help inform potential advice given by SNH on management of the Sea of the Hebrides
pMPA, and to assist in discussions with stakeholders, existing data sources were collated
and analysed for basking sharks in the pMPA. Two options of basking shark awareness
zones were identified based on these data. These are zones where sharks are expected to
occur most frequently in relatively high numbers and are therefore most vulnerable to certain
human activities. The basking shark awareness zones options presented provide a starting
point for discussing potential management with stakeholders through the public consultation
process.

                                For further information on this project contact:
                            Name of Project Manager – Dr Suzanne Henderson
                                               Tel: 01463 725238
          For further information on the SNH Research & Technical Support Programme contact:
      Knowledge & Information Unit, Scottish Natural Heritage, Great Glen House, Inverness, IV3 8NW.
                                 Tel: 01463 725000 or research@snh.gov.uk

                                                    i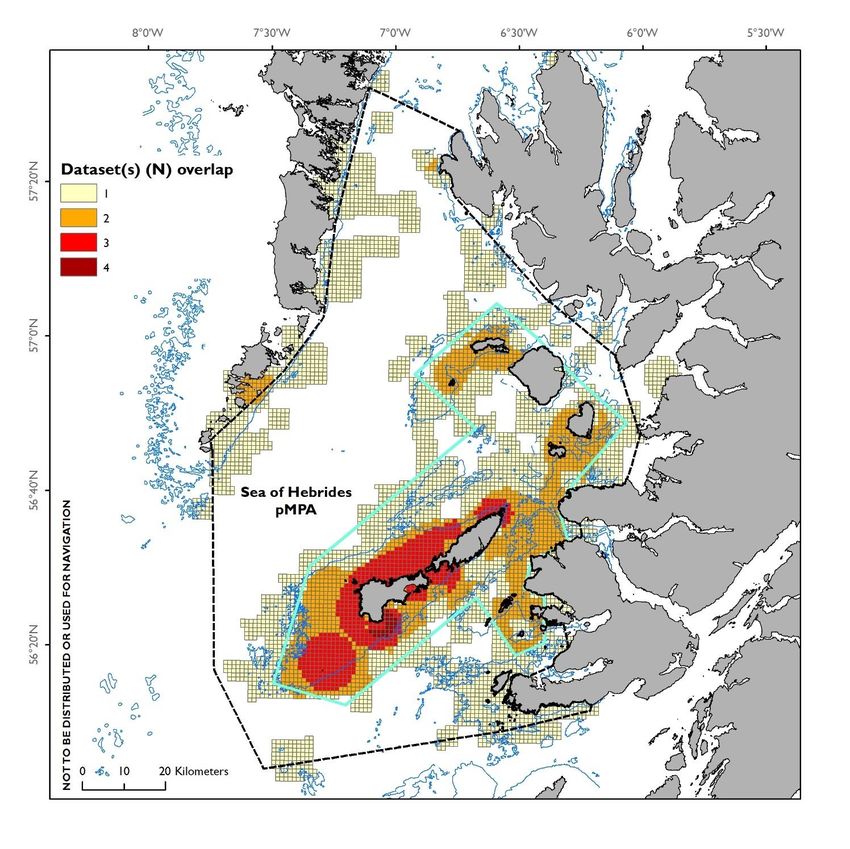
Table of Contents                                                      Page

1.   INTRODUCTION                                                        3
2.   METHODOLOGY                                                         3
     2.1  Rationale for approach                                         3
     2.2  Data sources used                                              3
     2.3  Spatial analysis                                               6
     2.4  Alternative options around thresholds and dataset overlaps     7
     2.5  Integrating depth data                                        15
     2.6  Contextualising data                                          15
     2.7  Options for basking shark awareness zones                     19
     2.8  Consideration of incidental fisheries catch                   19
     2.9  Recreation yachting                                           23
3.   CONCLUSIONS                                                        24
4.   REFERENCES                                                         25
ANNEX 1: DEPTH UTILISATION BEHAVIOUR                                    27
ANNEX 2: SEASONALITY OF PUBLIC SIGHTINGS                                28
ANNEX 3: SPATIO-TEMPORAL LOCATION OF TRACKED BASKING SHARKS             29

                                          ii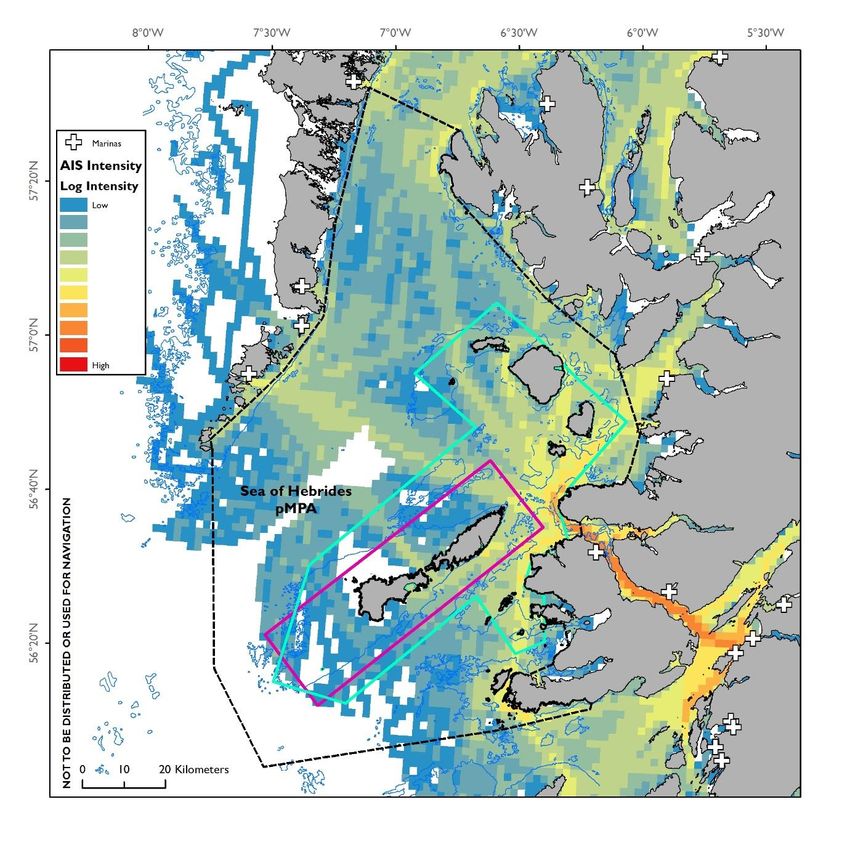
1.      INTRODUCTION
This report collates and interprets datasets on basking shark distribution within the Sea of
the Hebrides possible Marine Protected Area (pMPA) to delineate areas where the species
is most likely to be present, both at the surface and at depth, and thus potentially vulnerable
to:

   i.     Vessel collisions - hull and propeller strike
  ii.     Accidental fisheries catch - entanglement in static and mobile fishing gear
 iii.     Disturbance from vessels

We have analysed multiple, independently collected, datasets that describe basking shark
presence across the entire Sea of the Hebrides over 20 years. All ecological datasets have
inherent biases and limitations, but by using diverse datasets with a broad spatial and
temporal range, we have provided an enhanced understanding of basking shark distribution.
By mapping basking shark presence in surface waters, the location of potential ‘basking
shark awareness zones’ has been proposed, which identify where the species is most
vulnerable to the pressures identified above. This work and the awareness zones produced
can facilitate pMPA management discussions with the intention that possible management
measures may then be considered within the basking shark awareness zones. Interrogation
of depth-use data was also undertaken to determine whether zones of higher use could be
identified in the water column in addition to surface waters.

2.      METHODOLOGY

2.1     Rationale for approach
The development of evidence-based awareness zones requires datasets that contain
basking shark locations that overlap with the pMPA between May and October (reflecting our
current understanding of basking shark occupancy within the Sea of the Hebrides based on
public sightings and satellite tracking data; Annex 2&3). There are currently no
comprehensive, repeated inter- and intra-annual aerial or sub-surface surveys for basking
sharks in the Sea of the Hebrides. This would be the ideal method to locate areas of high
relative density, but such surveys are expensive and time consuming to collect and hence
have not been undertaken. Instead, there are a range of datasets, collected by different
organisations, at different periods, with differing biases, that can be used to determine
relative basking shark abundance and distribution. The spatially explicit high relative
abundance zones from each dataset can be overlaid to investigate consistency in basking
shark presence between years and parts of the Sea of the Hebrides pMPA. High relative
abundance zones that are consistently indicated in multiple datasets are most likely to
represent areas where sharks are predictably and repeatedly present. Thus, if we wish to
reduce risks, such as from vessel collision and accidental capture/entanglement by fisheries,
these are potential candidate areas for conservation action. In addition, sharks aggregating
in high densities at such sites may be doing so for courtship and mating, such that
disturbance may have considerable effect on life history processes. The multi-dataset
approach presented here is conservative, but provides a complete picture of basking sharks
in the pMPA.

2.2     Data sources used
A survey of known spatial datasets describing basking shark occurrence around Scotland
was undertaken (Table 1); such datasets were subsequently prepared and mapped. The
datasets vary in how they were collected and subsequently treated for follow-on analysis.

                                                 3
First, the effort spent to observe sharks during standard surveys for marine life can be
quantified, meaning that the data can be expressed as relative abundance (i.e. a sighting of
a single shark alone during a standardised survey suggests that there was only one shark
present at the surface / low density of sharks at that same time and place). The effort spent
to observe sharks by the public (e.g. Table 1F), or using satellite tracking, where basking
sharks may spend long periods underwater without sending location data (e.g. Table 1G)
cannot be quantified, and these data are typically treated as presence only data with no
accompanying estimate of abundance (i.e. a sighting or location from one shark does not
necessarily suggest that more sharks may have been present at the same time and place).
Secondly, the spatial coverage of data can vary enormously. Public sightings data have a
huge spatial coverage at fractional expense, while standardised surveys may be very
focused on specific target sea areas, but at considerable expense.

For the purposes of the present report, we considered that standardised surface surveys for
basking sharks could be used where they covered much of the spatial extent of Sea of the
Hebrides pMPA. These data provide synoptic coverage for the site and suffer from only
minor limitations in survey coverage. Hence any differences in sightings density between
regions should reflect the true distribution of animals and should not be an artefact of survey
effort. Data collected by the Hebridean Whale & Dolphin Trust and Wave Action (Table 1A &
B) have been used in a previous SNH report (Paxton et al. 2014) to generate an index of
predicted basking shark surface persistence certainty (i.e. the chances that a basking shark
would be present at the surface), and thus to avoid duplicating data, we have used the
modelled Paxton product, rather than the original survey data in analyses. We have not
directly used sightings data from a boat-based survey by Scottish Power Renewables for the
proposed Argyll Array in 2012 because of its limited spatial extent to the west of the island of
Tiree (Booth et al. 2013), although these are important contextual data. We considered that
data with unquantifiable survey effort (e.g. public sightings) could be used, if they also
covered the majority of the Sea of the Hebrides. These encompassed public sightings data
gathered by the Marine Conservation Society UK (https://www.mcsuk.org/sightings) as well
as locations of basking sharks from satellite tracking (Doherty et al. 2017a, b; Witt et al. SNH
report 752 & 908). Finally, data describing basking shark breaching behaviour from
accelerometry tags deployed in 2017 (Table 1H) and aggregation behaviour from towed
video tags deployed in 2018 (Table 1I) were not used in the formal spatial analyses because
of their limited spatial extent west of Tiree. While behavioural data like these cannot be
easily integrated in to spatial distribution analyses, they can provide important contextual
data on: (i) why basking sharks might occupy regions within the pMPA (e.g. for breeding,
mate finding and feeding), (ii) information on specific habitat preference (e.g. habitat type)
and (iii) likely types of behaviour that may be susceptible to disturbance.

                                               4
Table 1. Sources of data describing basking shark presence in the Sea of the Hebrides. Table shows the data name and details, the time
period over which the data were collected, the spatial scale and notes about its inclusion for spatial analysis.

                                                                                                       Used in spatial analysis to produce
Data name                                                           Period          Spatial extent
                                                                                                       awareness zone(s)

A. Hebridean Whale & Dolphin Trust (HWDT) boat-based survey         2003 to      West Scottish seas    Not directly used as incorporated in
for Minke whales and basking sharks                                  2011                              Paxton et al. persistence index

B. Wave Action boat-based survey for basking sharks (Colin          2002 to      Sea of the Hebrides   Not directly used as incorporated in
Speedie and Louise Johnson)                                          2006                              Paxton et al. persistence index

C. Index of predicted basking shark surface persistence certainty   2001 to      National to 12 nm     Data used in spatial analysis
based on HWDT and Wave Action basking shark data, with               2012
environmental data, created using Generalised Estimating
Equations (Paxton et al. 2014. CR594)

D. Hi-Definition aerial camera survey for basking sharks of the      2016        Sea of the Hebrides   Data used in spatial analysis
proposed MPA in the Sea of Hebrides by a Cesna 406 aircraft
flying at 610 m above sea surface at 220 km/hr (3 surveys flown)

E. Scottish Power Renewables boat survey for basking sharks          2012        West of Tiree         Data not used due to limited spatial
                                                                                                       extent, but used as contextual layer

F. Public sightings of basking sharks, collated by the Marine       1998 to      National to 12 nm     Data used in spatial analysis
Conservation Society                                                 2013

G. Satellite tracking of basking sharks using Smart Position Only   2012 to      National to 12 nm     Data used in spatial analysis
Tags (SPOT, n=34 sharks, funded by Scottish Natural Heritage         2015
33 tags, and the Marine Conservation Society 1 tag)

H. Archival pop-off tracking of three basking sharks using Daily     2017        West of Tiree         Data not used due to limited spatial
Diary accelerometer tags, providing data on where breaching                                            extent, but used as contextual layer
behaviours take place

I. Archival pop-off towed cameras attached to three basking          2018        West of Tiree         Data not used due to limited spatial
sharks, providing details of where basking sharks aggregate                                            extent, but used as contextual layer

                                                                             5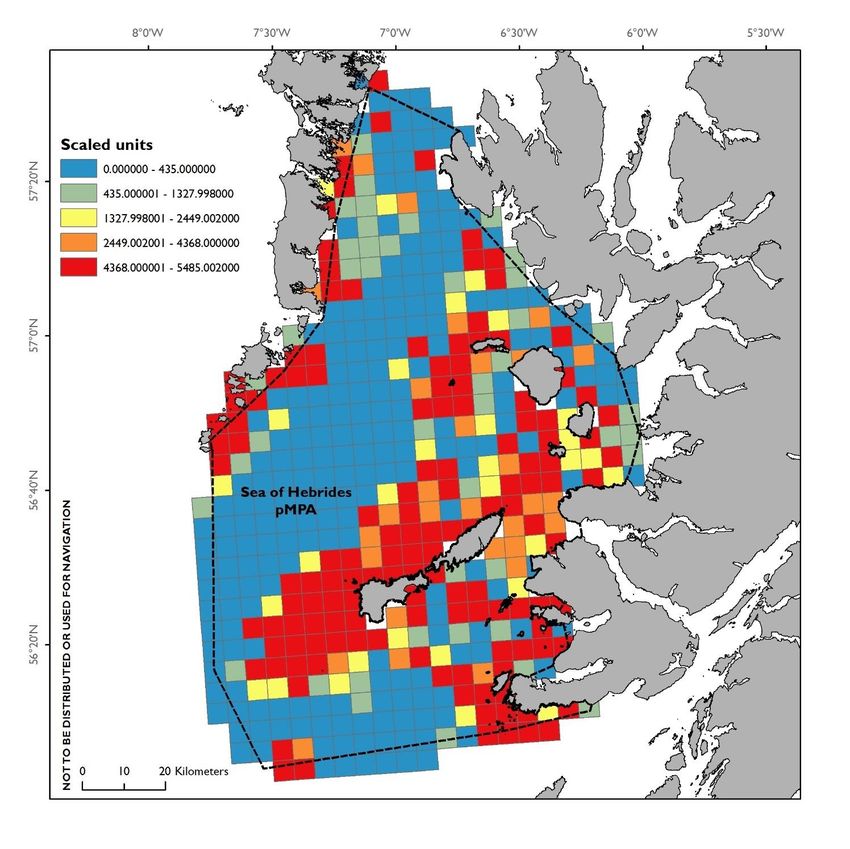
2.3   Spatial analysis
In order to delineate possible basking shark awareness zones within the pMPA, we
combined the modelled persistence, aerial survey, public sightings and satellite tracking
data. First, we created a raster of 1x1 km grid cells across the entire pMPA region (see
methodology schematic; Fig. 1). Then, for aerial survey, public sightings and satellite
tracking data (Fig. 2-4) we created kernel density estimates from basking shark locations
using a quartic kernelling approach. We optimised the smoothing parameter and grid cell
size and extents across all three datasets to a bandwidth of 10 km on a 2.5x2.5 km grid. We
then extracted the 50% kernel density estimate from the three datasets, which indicate that
at least 50% of the most densely aggregated location data for each dataset occur within that
defined area (Fig. 2-4), and re-mapped these final kernel density estimates using the initially
established template raster (1x1 km grid cell size). A 50% kernel density estimate was
selected as this is common practice in ecological studies seeking to determine core animal
distribution. For modelled persistence, we calculated the median value of all grid cells
(equivalent to 593 in scaled units) within the Sea of the Hebrides pMPA, and retained all
cells of this value and higher (Fig. 5). These cells have persistence values greater than the
median persistence value within the region, and this is analogous to identifying regions using
a threshold approach such as the 50% kernel density estimate used above. The resulting
modelled persistence regions were then expressed on a 1x1 km grid. The results of the first
stage of analysis were four raster datasets with the same spatial resolution and extent. Once
converted to binary form, these datasets (0 for all cells outside the 50% region and 1 for cells
within the 50% region) could be spatially summed (Fig. 6). The maximum possible value for
any grid cell within the final spatial product was four (i.e. where all four datasets had spatially
co-occurring regions greater than the 50% threshold). No dataset-specific weightings were
applied prior to summing the binary surface maps. All analyses were conducted in MATLAB
(The MathWorks), R (R Foundation) and ArcGIS (ESRI).

Figure 1. Schematic showing source data used to create a putative basking shark
awareness zone. Source data selected for analyses are highlighted in red (resultant
schematic maps of their 50% kernel density estimates shown). The four source datasets are
combined to create a final raster (bottom right) where colours indicate the number of
datasets that were present for each grid cell.

                                                6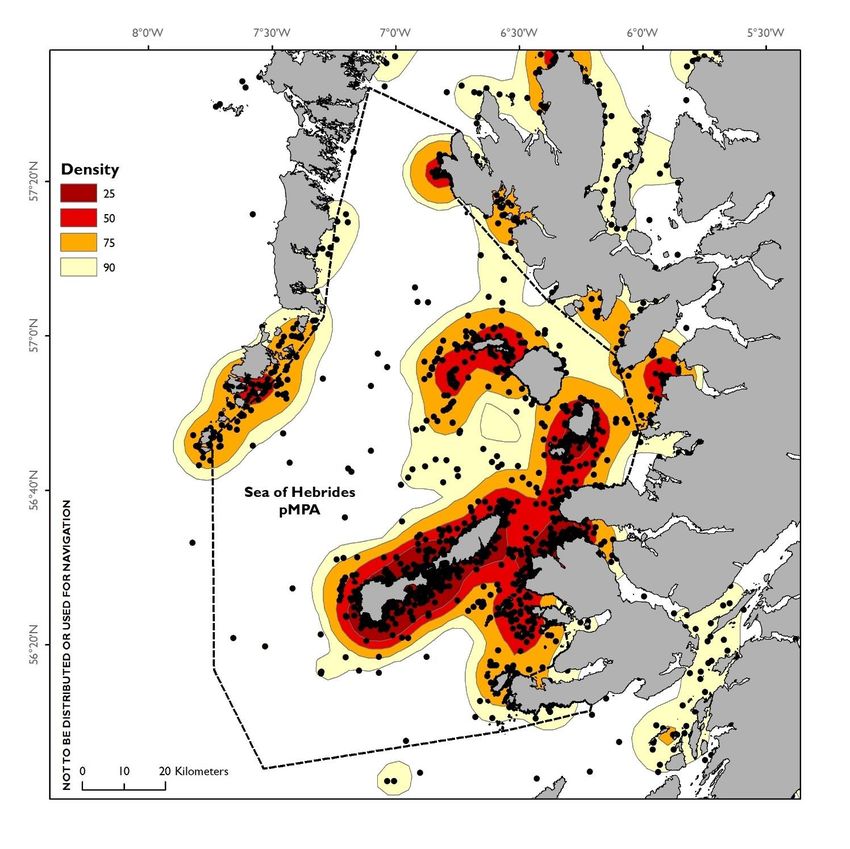
2.4   Alternative options around thresholds and dataset overlaps
A variety of thresholds could be used to determine regions of high relative abundance within
each basking shark distribution dataset. The adopted threshold (50% kernel density for
public sightings, satellite tracking and boat-based survey datasets), and 50th percentile
(median) value for modelled persistence, represents a conservative approach and reflects
generally accepted methods of identifying core regions in animal distribution datasets. It
would also be possible to repeat the process using the 75% kernel density estimates from
each survey type, which would delineate a larger area where more basking sharks may be
present at the sea surface - a more precautionary approach. Conversely, using the 25%
kernel density estimate would provide a smaller estimate and offer a less precautionary
approach. The suggested 50% threshold represents an initial option. The threshold
eventually selected could be influenced by the types, efficacy and extent of management
measures that are required. Pragmatic and layered trade-offs may be needed, for example,
more restrictive management measures where disturbance to sharks is critical to minimise
(e.g. no shark approaches) could be pursued in smaller areas that might be identified using
a 25% threshold, whereas voluntary measures, with less demanding management
requirements (e.g. speed restrictions) could operate over larger areas and these regions
might be identified using a threshold of 75%.

In addition to changing threshold values, awareness zones could be determined from any
number of spatially overlapping basking shark distribution datasets. The fewer the number of
overlapping datasets required for an awareness zone the larger the resulting area, and
conversely the greater the number of overlapping datasets required the smaller the
subsequent awareness zone.

Weightings might also be applied to differing basking distribution datasets prior to spatial
aggregation, this would allow certain datasets to have greater influence where they perhaps
have greater confidence (e.g. more complete spatial coverage, high detection probability,
repeated observations throughout the main season) might influence outputs more than those
with greater uncertainty (cf. patchy data in space and time). However, in the current work,
weightings have not been applied.

Two proposed basking shark awareness zones were prepared for stakeholder discussions,
these zones were, in general, bounded by grid cells where at least two, and three,
independent datasets overlapped respectively. We refer to these from hereon as Option A
and Option B (Fig. 7 and 8). To facilitate the discussion of an awareness zone that maritime
users could locate while at sea, it was necessary to simplify the boundaries of Option A and
Option B and hence in places they deviate from the underlying principles of the number of
datasets they circumscribe. The boundaries of Options A and B were considered with
respect to the 50m bathymetric contour and coastal-land / rock features visible at sea.
Vertices of the boundaries were reduced in number, and key vertices aligned with the 50m
depth contour and/or positioned with respect to visible landmarks from sea. Sea-going
vessels are commonly fitted with depth-finding equipment and hence should be able to
locate themselves at least with respect to seabed depth and to notable landmarks. Additional
manual adjustments were applied to the boundaries of these zones to further simplify them
(see section: Options for basking shark awareness zones).

                                             7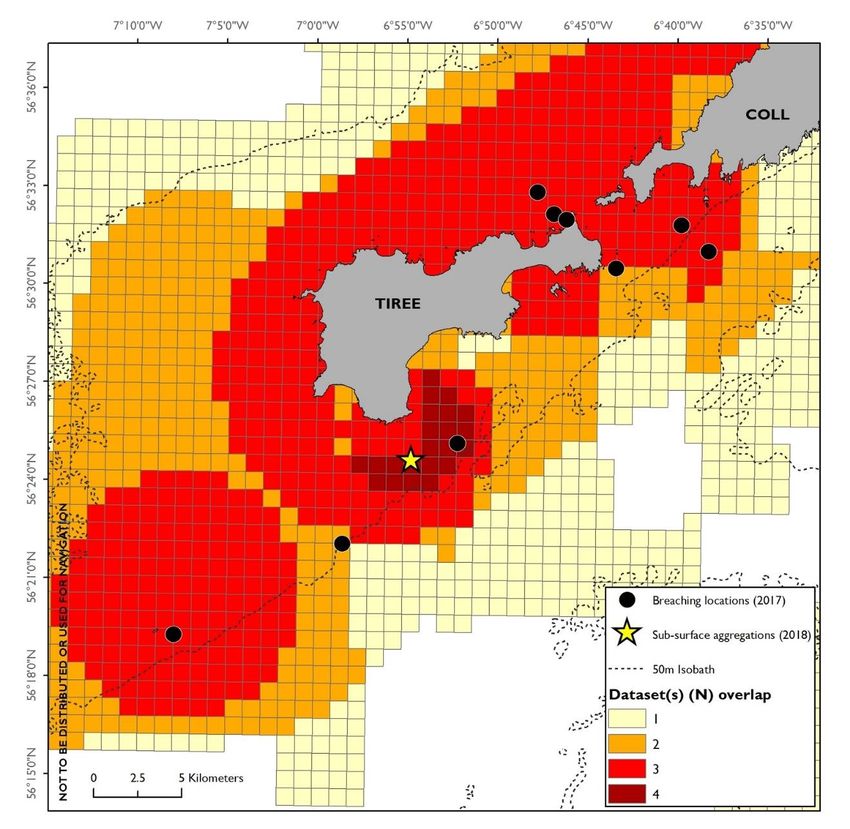
Figure 2. Map showing 25, 50, 75 and 90% kernel density estimates (in red to yellow
shades) of basking shark presence from an aerial survey carried out in 2016 (Webb et al.
2018). Aerial survey track denoted in blue, locations of sharks sighted during survey 1 and
survey shown as green and blue points. Sea of the Hebrides pMPA (black dashed polygon).
Contains OS data © Crown copyright and database right (2019).

                                            8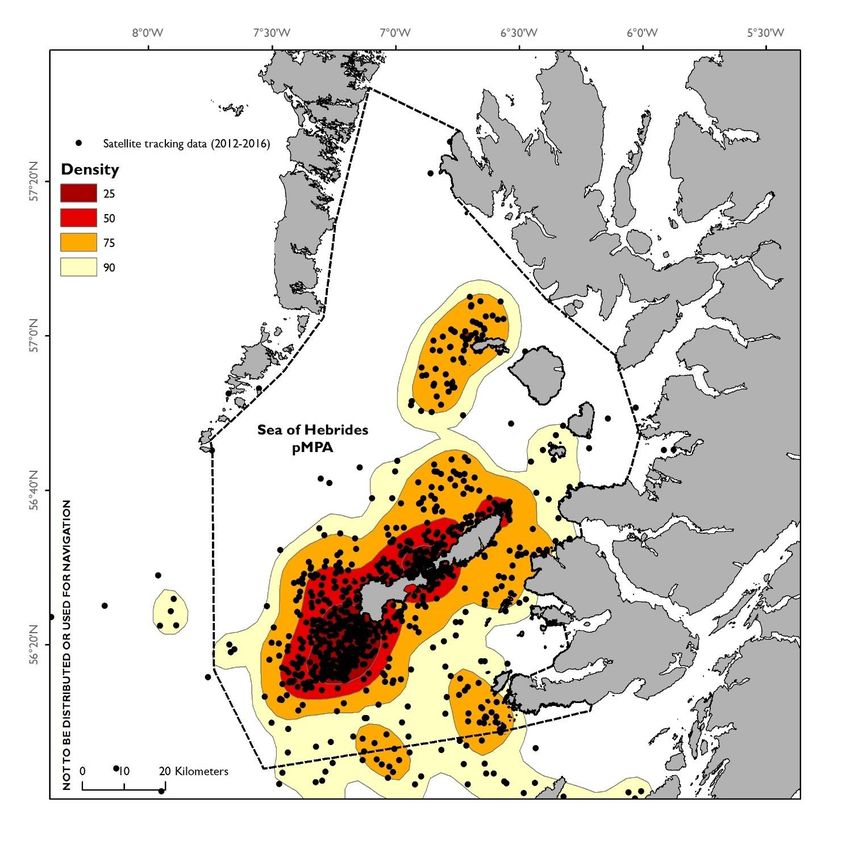
Figure 3. Map showing 25, 50, 75 and 90% kernel density estimates (in red to yellow
shades) of basking shark presence from public sightings gathered by the Marine
Conservation Society UK between 1998 and 2013. Sightings shown as black points. Sea of
the Hebrides pMPA (black dashed polygon). Contains OS data © Crown copyright and
database right (2019).

                                          9
Figure 4. Map showing 25, 50, 75 and 90% kernel density estimates (in red to yellow
shades) of basking shark presence from satellite tracking between 2012 and 2015. Individual
filtered location points (see Doherty et al. 2017a, b, Witt et al. 2014, 2017 for more details)
shown as black points. Sea of the Hebrides pMPA (black dashed polygon). Contains OS
data © Crown copyright and database right (2019).
10Figure 5. Map showing modelled persistence of basking sharks expressed as an index of
predicted surface persistence certainty on a 5x5 km grid (see Paxton et al. 2014 for more
details) where warmer colours indicate greater persistence, or greater certainty of
persistence of basking sharks. Sea of the Hebrides pMPA (black dashed polygon). Contains
OS data © Crown copyright and database right (2019).
11Figure 6. Map showing the location of key areas where basking sharks are likely to be
present at the sea surface in the Sea of the Hebrides pMPA (black dashed polygon) based
on four contributing datasets (modelled persistence, aerial survey, public sightings and
satellite tracking data), shown in dark red (all four datasets indicate presence), red (three
datasets indicate presence), orange (two datasets indicate presence) and yellow (one
dataset indicates presence). Contains OS data © Crown copyright and database right
(2019).
12Figure 7. Map showing location of a proposed basking shark awareness zone (Option A;
3290 km2) (turquoise polygon) within the Sea of the Hebrides pMPA (black dashed polygon)
overlaid on basking shark overlap data (see Figure 6 for symbology). Thin blue solid line
indicates 50m bathymetric contour. Contains OS data © Crown copyright and database right
(2019).
13Figure 8. Map showing location of a proposed basking shark awareness zone (Option B;
1300 km2) (turquoise polygon) within the Sea of the Hebrides pMPA (black dashed polygon)
overlaid on basking shark overlap data (see Figure 6 for symbology). Thin blue solid line
indicates 50m bathymetric contour. Contains OS data © Crown copyright and database right
(2019).
142.5 Integrating depth data
Previous satellite tracking work (Doherty et al. 2017a, Doherty et al. 2017b, Witt et al. 2016)
has shown that basking sharks in the wider Sea of the Hebrides spend much their time in the
upper 200-metres of the water column (84% of tracking time). Within the pMPA region,
basking sharks demonstrate both diel vertical migration (i.e. moving to the surface at night
and returning to depth during the day) and reverse diel migration (i.e. moving to the surface
during the day and returning to depth at night). This is likely to be a response to the physical
(e.g. temperature and salinity) structure of the water column, which in turn influences the
distribution of zooplankton, the major prey of basking sharks (Sims et al. 1997). We present
the depth use preferences (recorded at 15-second intervals) of twelve sharks that carried
dive recording transmitters (SPLASH and MiniPAT; Wildlife Computers) between July and
August in 2012, 2013 and 2014. Tags on these sharks did not record location at a fine-scale,
instead carrying light-geolocation satellite tracking tags that are accurate to within 50 km in
open-water environments (and less so in coastal waters). However, higher spatial resolution
SPOT tags, which do not record depth data, on 34 other sharks demonstrated consistent
space use of the Sea of the Hebrides pMPA during the period July and August and we
therefore assume that sharks carrying depth recording tags were also present in the Sea of
the Hebrides at this time. From SPOT tags it is evident that as the summer progresses, the
probability of sharks occurring outside the pMPA increases and so depth data gathered in
July and August have high certainty of occurring within the pMPA.
The depth-use data (Fig. 9) highlight considerable variability between individuals with some
sharks consistently occupying shallower waters than others. This level of variability within
and among individuals suggests a precautionary principle should be adopted for integrating
the depth data into producing awareness zones. In addition, regional weather patterns,
seabed depth and tidal conditions can influence water-column structure and thus plankton
presence, thus it is challenging to generate a simple spatially constrained understanding of
basking shark distribution based on depth. We therefore propose that any awareness zone
should capture the area from the sea surface to the seabed and be active over the complete
24-hour daily cycle at least for the main period when basking sharks are thought to occupy
the region based on both public sightings data and satellite telemetry research (May to
October; Annex 2&3).
2.6 Contextualising data
Within the proposed awareness zones additional basking shark data from a wildlife survey
funded by Scottish Power Renewables exist (Fig. 10), which provide important information
on basking shark abundance. Behavioural data from research into the breaching of basking
sharks, which has been often linked to courtship, was conducted in 2017. Three archival
accelerometry tag systems were deployed and revealed information on breaching within
Gunna Sound and to the west of Tiree (Fig. 11). All tagged sharks were observed to breach,
with the longest tracked shark (30 days) breaching on 57 occasions, often not as single
events, but undertaking several breaching “episodes” with multiple breaches per event. In
addition, towed video camera tags were deployed in 2018 to investigate individual sub-
surface behaviour, and revealed that basking sharks aggregate near the bottom along the
south-eastly edge of the reef plateau extending from Tiree and west to Skerryvore lighthouse
(Fig. 11). It is not yet clear whether this happens regularly, or whether it happens elsewhere,
but aggregation behaviour such as this is a strong indicator that the Sea of the Hebrides may
be a key site for basking shark courtship. All these areas are encompassed in both Options
A and B presented.
15Figure 9. Circular plots showing the diurnal diving behaviour of 4 sharks (a to d) in August.
Circular axis shows time of day from midnight (top of circle) through midday (bottom of
circle) to midnight again (top of circle), distance from centre of circle indicates dive depth in
100m bins up to 300m (indicated in bottom right of each plot). All sharks predominantly
remain within the upper 100m of the Sea of the Hebrides, and do not vary their depth use
with the time of day, but shark c makes a series of additional dives to almost 200m, and
shark d makes many more dives to almost 200m, with a few excursions deeper still. See
also data for eight more sharks in Annex 1.
16Figure 10. Map showing a portion of the southern end of a putative basking shark awareness
zone within the Sea of the Hebrides pMPA where shading indicates the presence of the
contributing variables (modelled persistence, aerial survey, public sightings and satellite
tracking data) in relation to a boat-based survey for Scottish Power Renewables in 2012
(black dashed line shows survey track) for basking sharks (sightings shown as green points).
Contains OS data © Crown copyright and database right (2019).
17Figure 11. Map showing a portion of the southern end of a putative basking shark awareness
zone within the Sea of the Hebrides pMPA where shading indicates the presence of the
contributing variables (modelled persistence, aerial survey, public sightings and satellite
tracking data) in relation to breaching behaviour (black points) detected using accelerometry
tags (Witt et al. unpublished), and aggregation behaviour detected using towed camera
systems attached to sharks (Witt et al. unpublished). Contains OS data © Crown copyright
and database right (2019).
182.7 Options for basking shark awareness zones
As outlined above, two basking shark awareness zone options have been delineated, which
are described below. These represent areas where basking sharks are considered to be
more vulnerable to vessel collisions and disturbance.
Option A: This option seeks to encompass the marine regions of Canna, Rhum, Eigg and
Muck, the waters around Hyskier and the Mill Stone into a single awareness zone that
incorporates Coll and Tiree and the coastal waters to the west of the Isle of Mull. To the
south of Coll and Tiree, geographic areas with two or more basking shark datasets, are less
congruent with the 50m contour and so future development of awareness zones, should not
simply be a function of depth (Fig. 7). The boundary is very similar to that of the aerial survey
high density strata region (as shown in Fig. 4) in the eastern sector of the zone. The northern
boundary of Option A to the north of Coll and Tiree deviates somewhat from the region
circumscribing at least two basking shark datasets, this is an attempt to form simple parallel
lines with the southern boundary of Option A.
Option B: A simple rectangular polygon encompassing three or more datasets and aligned
with the dominant axis of the Isles of Coll and Tiree (Fig. 8). This option does not incorporate
waters to the north of Canna or waters surrounding Eigg, Muck, Rhum or Hyskier and the
Mill Stone.
Option A is much larger (3,290km2) than Option B (1,300km2) and is therefore more likely to
encompass more basking sharks but may restrict a greater number of marine users from
carrying out their activities depending on any measures developed. Option B encompasses
the core area of basking shark presence, and because it is smaller, may affect the activities
of fewer users, and be easier to manage, but may suffer from failing to protect basking
sharks sufficiently. For example, satellite tracking data suggested that an individual basking
shark may occupy a home range of between 2,600 and 3,300km2 (Doherty et al. 2017b)
over the course of the summer months, which is far larger than Option B and a similar size to
Option A. Furthermore, Option B does not encompass regions such as Mill Stone, to the
south west of Hyskeir, that anecdotally support considerable numbers of large sharks, but
the region is not resolved particularly well in the extant basking shark distribution datasets.
There may indeed be scope for multiple smaller awareness zones, and this approach might
be useful avenue to approach with stakeholders.
2.8 Consideration of incidental fisheries catch
Basking sharks are occasionally accidentally caught or entangled in fishing gear (Lack &
Sant 2009, Oliver et al. 2015, van der Molen 1998) and it is possible that they may also be
disturbed or harmed by fisheries interactions that do not result in their capture. Interactions
between basking sharks and fisheries are not well understand, in particular the spatial extent
to which it occurs, the magnitude or factors concerning their survivability should they be
released alive. Under-reporting of accidental capture/entanglement events is highly likely
given the protected nature of the species. Data on benthic fisheries effort were sourced from
the International Council for the Exploration of the Sea
(http://www.ices.dk/sites/pub/Publication%20Reports/Data%20outputs/ICES.2018.OSPAR-
spatial-data-fishing-intensity.zip). These data (cumulative hours fished) are expressed on a
0.05 by 0.05 °grid (for 2017; vessels ≥ 12m length). The most comprehensive and available
spatial data on pelagic (mid-water) and static fisheries were obtained from the Scottish
Government National Marine Plan Interactive (NMPi; http://marine.gov.scot/node/12882).
This report makes use of data for the period 2009 to 2013 from vessels ≥ 15m length,
specifically we use the spatial distribution of fisheries (relative density of vessel locations
operating at speeds indicative of gear specific fishing) directed towards crab and Nephrops
(static and mobile). Other fisheries data are available from the NMPi, including information
on pelagic herring and mackerel, lobster, squid, although these do not occur to any
19appreciable level within the pMPA boundary and so were not considered. We extracted and overlaid fisheries data with the proposed awareness zones (Fig. 12). Data were also obtained from ScotMap (Kafkas et al. 2014), a spatial fisheries information data product focusing on the distribution and monetary value of inshore fisheries (within 12nm of land) conducted by vessels
Figure 12. Distribution of fisheries effort within the Sea of Hebrides pMPA. (A) OSPAR
bottom mobile gear effort for 2017 (cumulative hours), (B) Crab fisheries, (C) Nephrops
static fisheries and (D) Nephrops mobile fisheries. Option A awareness zone (turquoise
empty polygon), Option B awareness zone (purple empty polygon). Contains OS data ©
Crown copyright and database right (2019).
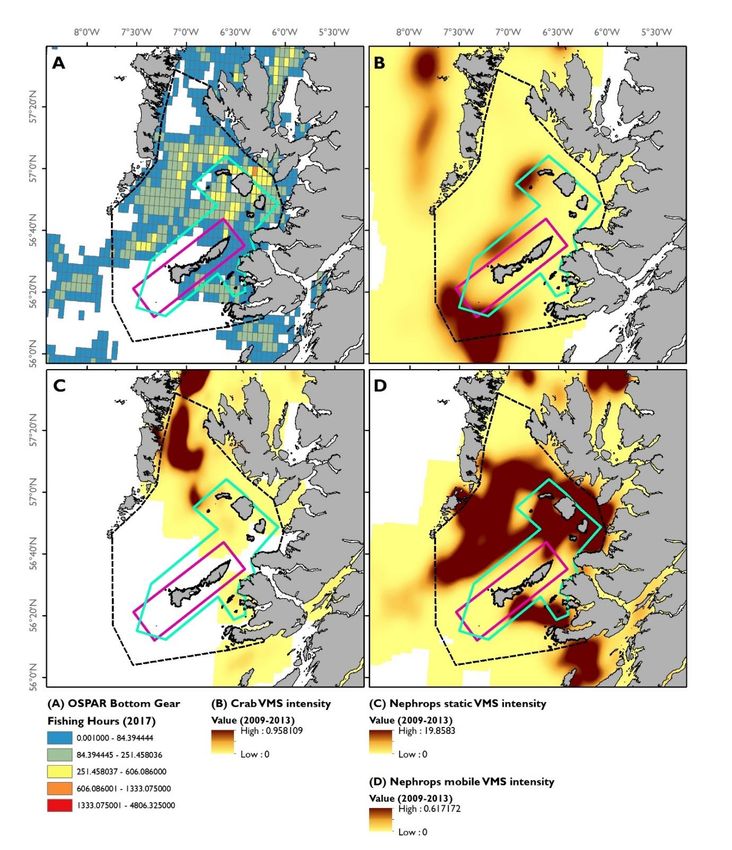
21Figure 13. Distribution of the number of vessels (
2.9      Recreation yachting

Spatially explicit data on the movements of recreational craft within the Sea of Hebrides
pMPA were obtained from the 1Royal Yachting Association. Positional data from vessels
carrying VHF equipment communicating with the Automated Identification System (AIS;
class B messages) were mapped and expressed as log vessel density for 2016 (Fig. 14).
Both options of basking shark awareness zones circumscribe recreational vessel activity,
with a noteworthy corridor of activity extending northwest from Gunna Sound towards Barra.
Slow moving recreational vessels including yachts and sailed powered craft likely represent
minimal risk to basking sharks due to their slow relative speed and low noise characteristics
(cf. powered vessels). This data layer likely under-represents vessel traffic from ecotourism
activities operating within the pMPA which often aggregate within the Option B awareness

zone.
Figure 14. Distribution of recreational vessel activity in 2016. Option A awareness zone
(turquoise empty polygon) Option B awareness zone (purple empty polygon). Contains OS
data © Crown copyright and database right (2019).

1
    UK Coastal Atlas of Recreational Boating 2.0 (2016). Royal Yachting Association.

                                                        23
3. CONCLUSIONS
The analysis undertaken in this report to propose a basking shark awareness zone has
highlighted that there are key areas in which basking sharks can be expected to occur and
hence sharks will be at risk of at least vessel collision and disturbance in these areas. Two
options have been drafted for consideration as basking shark awareness zones. The novel
observations of basking shark breaching and aggregation behaviour, which occur in the core
of the proposed awareness zones between Coll and Tiree, and immediately south of Tiree,
provide important additional contextual information. These are considered potential courtship
behaviours in other shark species (Jacoby et al. 2012) so we consider that these particular
areas of the awareness zone may be amongst the most important to consider for protection
from activities that have the potential to kill, injure or disturb basking sharks. Whilst it is
considered that basking sharks may not be at great risk of accidental capture or
entanglement in fishing gear within the awareness zones, initiatives such as the Scottish
Entanglement Alliance will help inform future discussions. However, it is uncertain whether
other surface or benthic activities are likely to affect basking sharks. Within both zone
options there is potential for interaction between basking sharks and vessels via collision
and disturbance but the risks associated with this are difficult to quantify. Additionally,
basking sharks are likely to be distributed unpredictably throughout the water column to
200m depth in the pMPA. Therefore, this lends support to a precautionary approach for
managing activities within the awareness zones.
244. REFERENCES
Booth, C.G., King, S.L. & Lacey, C. 2013. Argyll Array Wind farm Basking Draft Chapter for
Environmental Statement. SMRU Ltd report number SMRUL-WSP-2013001. January
2013 (unpublished).
Doherty, P.D., Baxter, J.M., Gell, F.R., Godley, B.J., Graham, R.T., Hall, G., Hall, J.,
Hawkes, L.A., Henderson, S.M., Johnson, L., Speedie, C., Witt, M.J. (2017a). Long-term
satellite tracking reveals variable seasonal migration strategies of basking sharks in the
north-east Atlantic. Scientific Reports 7, 42837.
Doherty, P.D., Baxter, J.M., Gell, F.R., Godley, B.J., Graham G.T., Hall, G., Hall, J., Hawkes,
L.A., Henderson, S.M., Johnson, L., Speedie, C., Witt M.J. (2017b). Testing the
boundaries: Seasonal residency and inter-annual site fidelity of basking sharks in a
proposed marine protected area. Biological Conservation 209:68-75.
Jacoby, D.M.P., Croft, D.P., Sims, D.W. (2012) Social behaviour in sharks and rays:
analysis, patterns and implications for conservation. Fish and Fisheries 13, 399-417.
Kafas, A., Jones, G., Watret, R., Davies, I., Scott, B., (2013) 2009 - 2013 amalgamated VMS
intensity layers, GIS Data. Marine Scotland, Scottish Government. doi: 10.7489/1706-1
Kafas, A., McLay, A., Chimienti, M., Gubbins, M. (2014) ScotMap Inshore Fisheries Mapping
in Scotland: Recording Fishermen’s use of the Sea. Scottish Marine and Freshwater
Science Vol: 5 Number 17. Edinburgh: Scottish Government, 32p. DOI: 10.4789/1554-1
Lack, M., Sant, G. (2009) Trends in global shark catch and recent developments in
management. TRAFFIC international.
https://www.traffic.org/site/assets/files/9523/trends-in-global-shark-catch.pdf
Oliver, S., Braccini, M., Newman, S.J., Harvey, E.S. (2015) Global patterns in the by-catch of
sharks and rays. Marine Policy 54, 86-97.
OSPAR Commission (2009) Background document for Basking shark Cetorhinus maximus
OSPAR Commission report 419/2009.
Paxton, C.G.M., Scott-Hayward, L.A.S. & Rexstad, E. 2014. Statistical approaches to aid the
identification of Marine Protected Areas for minke whale, Risso’s dolphin, white-beaked
dolphin and basking shark. Scottish Natural Heritage Commissioned Report No. 594.
Sims, D.W., Fox, A.M., Merrett, D.A. (1997) Basking shark occurrence off south-west
England in relation to zooplankton abundance. Journal of Fish Biology 51, 436-440.
Van der Molen, S., Caille, G., Raul, G. (1998) By-catch of sharks in Patagonian coastal trawl
fisheries. Marine and Freshwater Research 49, 641-644.
Webb, A., Irwin, C. & Humphries, G. 2018. Distribution and abundance of basking sharks
(Cetorhinus maximus) and minke whales (Balaenoptera acutorostrata) within the Sea of
the Hebrides MPA proposal – a pilot digital aerial survey. Scottish Natural Heritage
Research Report No. 974.
Witt, M.J., Doherty, P.D., Godley, B.J. Graham, R.T. Hawkes, L.A. & Henderson, S.M. 2014.
Basking shark satellite tagging project: insights into basking shark (Cetorhinus maximus)
25movement, distribution and behaviour using satellite telemetry (Phase 1, July 2014).
Scottish Natural Heritage Commissioned Report No. 752.
Witt, M.J., Doherty, P.D., Godley, B.J. Graham, R.T. Hawkes, L.A. & Henderson, S.M. 2016.
Basking shark satellite tagging project: insights into basking shark (Cetorhinus maximus)
movement, distribution and behaviour using satellite telemetry. Final Report. Scottish
Natural Heritage Commissioned Report No. 908.
26ANNEX 1: DEPTH UTILISATION BEHAVIOUR
Circular plots showing the diurnal diving behaviour of 12 sharks (a to l) in August. Circular
axis shows time of day from midnight (top of circle) through midday (bottom of circle) to
midnight again (top of circle), distance from centre of circle indicates dive depth in 100-metre
bins up to 300 metres (indicated in bottom right of (a)). All sharks predominantly remain
within the upper 100 metres of the Sea of the Hebrides, and do not vary depth use with the
time of day, but several make deeper excursions, with the deepest depths used by
individuals j, k and l.
27ANNEX 2: SEASONALITY OF PUBLIC SIGHTINGS
Seasonality of public sightings data for basking sharks observed off the west coast of
Scotland (1998-2013). Boxplot shows the distribution of the annual proportion of records
occurring within respective months. Median for each distribution (month) highlighted by bold
horizontal lines in each vertical boxplot. Boxplot highlights key sightings season for basking
sharks, which ranges between May and October. August is the month receiving most
records each year (median: 37% of records, although ranging between 15 and 65% of
records within any one year), followed by July (24%) and September (11%).
28ANNEX 3: SPATIO-TEMPORAL LOCATION OF TRACKED BASKING SHARKS
Monthly location of basking sharks with respect to pMPA. Matrix highlights month at location
of tagged basking sharks with respect to Sea of the Hebrides pMPA (dark grey = within
pMPA). Not all tags remained attached to reveal month of return to the region. Tag detached
(D). Synthesis of data from Witt et al. SNH Commissioned Reports 752 & 908.
Tracking
Tag Tag
Sex Year duration J A S O N D J F M A M J J A S
ID model
(months)
129431 SPLASH-F F 2013 2 D
129432 SPLASH-F U 2013 2 D
129433 SPLASH-F M 2013 2 D
129434 SPLASH-F U 2013 2 D
137646 SPLASH-F M 2014 2 D
137647 SPLASH-F M 2014 2 D
119855 SPOT U 2012 2 D
120497 SPOT F 2012 2 D
120500 SPOT M 2012 2 D
129435 SPOT F 2013 2 D
129438 SPOT M 2013 2 D
137648 SPLASH-F F 2014 3 D
137653 SPLASH-F M 2014 3 D
129446 SPOT U 2013 3 D
129447 SPOT U 2013 3 D
137645 SPLASH-F U 2014 4 D
119856 SPOT M 2012 4 D
120496 SPOT F 2012 4 D
129443 SPOT F 2013 4 D
137650 SPLASH-F F 2014 5 D
137652 SPLASH-F U 2014 5 D
120498 SPOT F 2012 5 D
137649 SPLASH-F U 2014 6 D
120499 SPOT M 2012 6 D
129450 SPOT F 2013 8 D
129441 SPOT M 2013 9 D
137654 SPLASH-F U 2014 10 D
137651 SPLASH-F F 2014 10 D
119854 SPOT U 2012 11 D
129445 SPOT U 2013 11 D
129444 SPOT U 2013 13 D
129437 SPOT U 2013 13 D
129449 SPOT U 2013 14 D
129448 SPOT U 2013 14 D
129436 SPOT U 2013 14 D
129439 SPOT U 2013 14 D
129440 SPOT F 2013 15 D
2930
You can also read