Levels and trends in marine contaminants and their biological e ects - CEMP Assessment Report 2013 - OSPAR Commission
←
→
Page content transcription
If your browser does not render page correctly, please read the page content below
Levels and trends in marine contaminants and their
                                   biological effects – CEMP Assessment Report 2013
Monitoring and Assessment Series

                                                                                    2014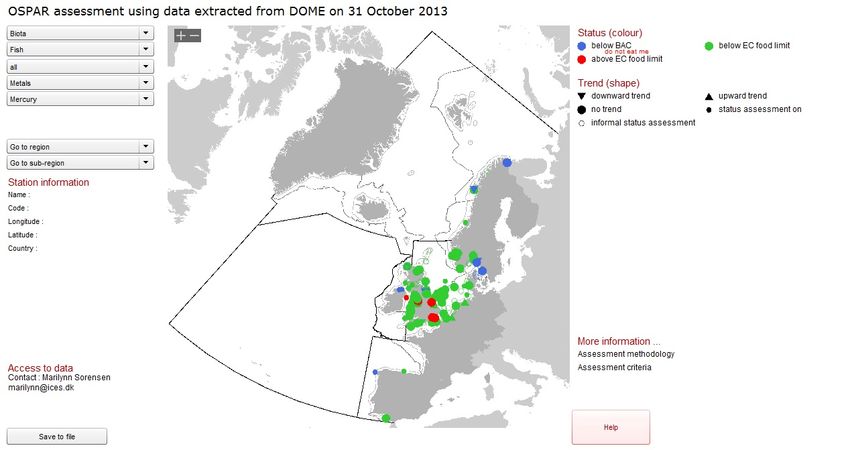
Levels and trends in marine contaminants and
their biological effects – CEMP Assessment
report 2013

OSPAR Commission 2014
Levels and trends in marine contaminants and their biological effects – CEMP Assessment report 2013

OSPAR Convention                                             Convention OSPAR
The Convention for the Protection of the Marine              La Convention pour la protection du milieu marin
Environment of the North-East Atlantic (the                  de l'Atlantique du Nord-Est, dite Convention
“OSPAR Convention”) was opened for signature                 OSPAR, a été ouverte à la signature à la réunion
at the Ministerial Meeting of the former Oslo and            ministérielle des anciennes Commissions d'Oslo
Paris Commissions in Paris on 22 September                   et de Paris, à Paris le 22 septembre 1992. La
1992. The Convention entered into force on 25                Convention est entrée en vigueur le 25 mars
March 1998. The Contracting Parties are:                     1998. Les Parties Contractantes sont :
Belgium, Denmark, the European Union, Finland,               l'Allemagne, la Belgique, le Danemark, l’Espagne,
France, Germany, Iceland, Ireland, Luxembourg,               la Finlande, la France, l’Irlande, l’Islande,
Netherlands, Norway, Portugal, Spain, Sweden,                le Luxembourg, la Norvège, les Pays-Bas,
Switzerland and the United Kingdom.                          le Portugal, le Royaume-Uni de Grande Bretagne
                                                             et d’Irlande du Nord, la Suède, la Suisse et
                                                             l’Union européenne.

Acknowledgement
This report has been prepared by the Working Group on Monitoring and on Trends and Effects of
Substances in the Marine Environment (MIME). Special thanks to Dr Martin M. Larsen, Denmark, and
Dr Rob Fryer, UK, for their hard work in producing this report.

2
Levels and trends in marine contaminants and their biological effects – CEMP Assessment report 2013
Contents
Executive Summary ........................................................................................................................................... 4
Récapitulatif....................................................................................................................................................... 5
Introduction ....................................................................................................................................................... 6
Web-based presentation of CEMP assessment results............................................................................ 6
Contaminants and matrices covered ....................................................................................................... 6
Methods ................................................................................................................................................... 7
Overview of data submissions ................................................................................................................. 7
Status and trends............................................................................................................................................... 9
Overview of results for biota and biological effects ................................................................................ 9
Overview of results for sediments .........................................................................................................10
Imposex and TBT: Status, trends and effects in marine organisms: an improving
situation?................................................................................................................................................11
Metals in sediment: status and trend of copper burden .......................................................................13
Conclusion ....................................................................................................................................................... 16
OSPAR Commission References ...................................................................................................................... 16
Annex 1 – Analysed substances and significant trends in sediment ............................................................... 17
Annex 2 – Analysed substances and significant trends in biota ...................................................................... 18
Annex 3 - Assessment criteria used in the CEMP data assessment ................................................................ 20
3Levels and trends in marine contaminants and their biological effects – CEMP Assessment report 2013
Executive Summary
The CEMP assessment measured progress towards the OSPAR objective of having concentrations of
hazardous substances at background levels, or close to zero, by 2020. Concentrations of metals, PCBs, and
PAHs were generally stable or decreasing. In biota, 73, 87 and 96% of significant time trends were
downwards for metals, PAHs and PCBs respectively. In sediment, the corresponding values were 72, 93 and
91%. For both biota and sediment, only about half of the parameters assessed showed any upward trends
and only metal concentrations increased at more than four stations. Cadmium, mercury, lead, and copper
concentrations increased at 20, 16, 12, and 8 biota stations respectively; arsenic, copper, chromium, nickel
and lead concentrations increased at 14, 14, 7, 5 and 5 sediment stations respectively.
This report focuses in particular on the assessment of CEMP data on TBT and its biological effects, as well as
on contamination by copper:
• Concentrations of the antifouling agent TBT and biological effects in marine gastropods resulting
from its use have also decreased following the ban on the use of TBT on pleasure boats in 1987 and
on all ships in 2001. TBT concentrations decreased significantly in 55% of sediment time series and
81% of biota time series, and the biological effect vas deference index decreased significantly in
61% of time series. Copper is also used as an antifouling agent, and the assessment results for TBT
and Cu are addressed in this report. For the information on TBT/Imposex, a separate Assessment
Sheet is published by OSPAR alongside this report;
• 7% of the 202 copper time series in sediment were increasing and 11% were decreasing. Most of
the upward trends are seen in the vicinity of harbours, marinas and major shipping lanes where
concentrations are already at levels possibly causing effects to the ecosystem. The increasing
concentrations in sediments should be investigated further and the sources and pathways into the
sediment clarified.
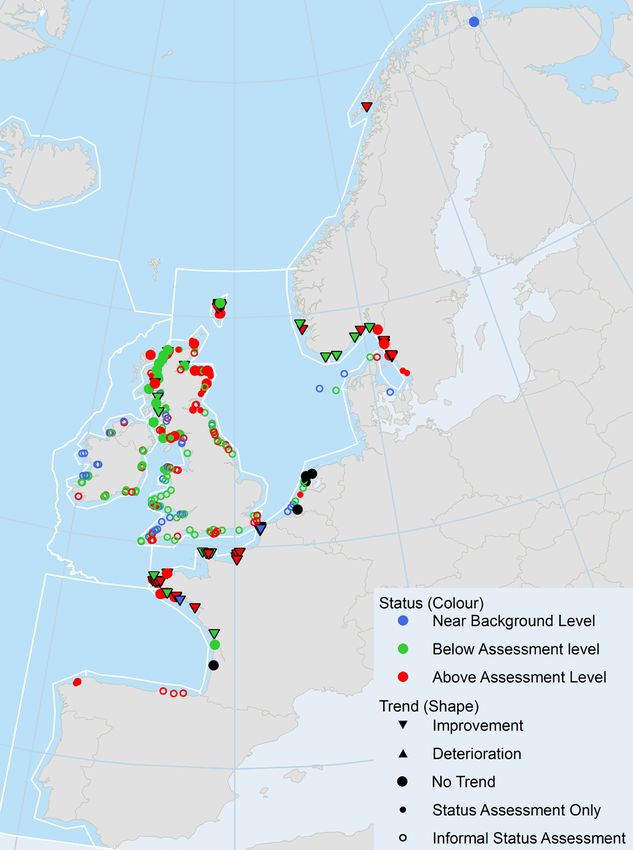
These CEMP assessment results can be consulted in full detail on-line at http://dome.ices.dk/osparmime/main.html
4OSPAR Commission 2014
Récapitulatif
L'évaluation du CEMP a mesuré les progrès réalisés vers l'objectif d'OSPAR, nommément des
concentrations de substances dangereuses aux niveaux de fond, ou proches de zéro, d'ici à 2020. Les
concentrations de métaux, de PCB et de HAP ont généralement été stables ou en diminution. Dans le biote,
73 %, 87 % et 96 % des tendances temporelles significatives étaient à la baisse pour les métaux, les HAP et
les PCB, respectivement. Dans le sédiment, les valeurs correspondantes étaient de 72 %, 93 % et 91 %. Pour
le biote comme pour le sédiment, la moitié seulement des paramètres évalués ont présenté des tendances
à la hausse, et seules les concentrations de métaux ont augmenté dans plus de quatre stations. Les
concentrations de cadmium, de mercure, de plomb et de cuivre ont augmenté dans 20, 16, 12 et 8 stations
de contrôle du biote, respectivement ; les concentrations d'arsenic, de cuivre, de chrome, de nickel et de
plomb ont augmenté dans 14, 14, 7, 5 et 5 stations de contrôle du sédiment, respectivement.
Ce rapport concerne en particulier l'évaluation des données du CEMP sur le tributylétain (TBT) et sur ses
effets biologiques, ainsi que la contamination par le cuivre :
• Les concentrations de l'agent antifouling TBT et les effets biologiques que son utilisation produit sur
les gastéropodes marins ont aussi diminué, suite à l'interdiction de l'utilisation du TBT sur les
bateaux de plaisance en 1987 et sur tous les navires en 2001. Les concentrations de TBT ont
diminué significativement dans 55 % des séries chronologiques de sédiment et dans 81 % des séries
chronologiques de biote, et l'Indice vas deferens (Vas Deferens Index, VDSI) utilisé pour évaluer
l'effet biologique a diminué significativement dans 61 % des séries chronologiques. Le cuivre est
aussi utilisé comme agent antifouling, et les résultats de l'évaluation pour le TBT et le cuivre sont
traités dans ce rapport. En ce qui concerne les informations sur le TBT/Imposex, une Fiche
d'évaluation séparée est publiée par OSPAR parallèlement à ce rapport ;
• 7 % des séries chronologiques du cuivre 202 dans le sédiment étaient en augmentation et 11 %
étaient en diminution. La plupart des tendances à la hausse sont observées à proximité des ports,
des marinas et des grandes voies de navigation, où les concentrations sont déjà à des niveaux qui
pourraient avoir des effets sur l'écosystème. Il convient d'étudier davantage les concentrations
croissantes dans les sédiments, et de clarifier les sources et les voies qui aboutissent au sédiment.
La version intégrale de ces résultats de l'évaluation du CEMP peut être consultée en ligne à http
://dome.ices.dk/osparmime/main.html
5Levels and trends in marine contaminants and their biological effects – CEMP Assessment report 2013 Introduction The 2013 assessment of data collected under the OSPAR Coordinated Environmental Monitoring Programme (CEMP) was prepared by the OSPAR Working Group on Monitoring and on Trends and Effects of Substances in the Marine Environment (MIME) at, and following, its meeting in December 2013 and is based upon data reported by Contracting Parties to ICES and held in the ICES Environmental databases. This report focuses on case study assessments of TBT, Imposex and Copper. The assessment results on TBT and Imposex are also published as a separate Assessment Sheet. The CEMP is the monitoring under the OSPAR Joint Assessment and Monitoring Programme where the national contributions overlap and are coordinated through adherence to commonly agreed monitoring guidelines, quality assurance tools and assessment tools. It covers temporal trend and spatial monitoring programmes for concentrations of selected chemicals and nutrients, and for biological effects. Monitoring under the CEMP aims to indicate the extent of contamination of fish, shellfish and sediments with hazardous substances and the intensity of their biological effects. The purpose is to support OSPAR assessments of the effectiveness of measures to reduce releases of hazardous substances to the environment. The assessment evaluates the status and trend of concentrations of hazardous substances in the marine environment for selected hazardous substances which have been prioritised for action by OSPAR due to their risk for the marine environment and which are being monitored under the CEMP. It builds on experience gained in the first comprehensive trend assessment of CEMP data in 2005 (OSPAR Commission, 2005), and the annual CEMP assessments undertaken in the period 2006 – 2009 (OSPAR Commission, 2006; 2007; 2008; 2009a), which contributed to the OSPAR Quality Status Report 2010 (OSPAR Commission, 2010) accessible at http://qsr2010.ospar.org. Web-based presentation of CEMP assessment results The OSPAR assessment for 2013 covers over 400 000 measurements in 73 parameters at 1223 stations. There were 8765 time series (station / parameter combinations with more than three years of data) that were assessed for trends in sediment, biota and for biological effects (Annexes 1 and 2). Overall, there were 1506 significant trends of which 88% were downwards indicating a general decline in pollutant concentrations. Assessment products are presented in the Web assessment tool at http://dome.ices.dk/osparmime/main.html. Assessment data are also available at this location together with supporting tables, plots, help files and methodological information. Contaminants and matrices covered The contaminants covered by the CEMP are the metals cadmium (Cd), mercury (Hg), lead (Pb), nickel (Ni), copper (Cu), zinc (Zn), chromium (Cr), arsenic (As) and the organic contaminants PCBs (congeners 28, 52, 101, 105, 118, 126, 138, 153, 156, 169, 180) and PAHs (naphthalene, phenanthrene, anthracene, dibenzothiophene, fluoranthene, pyrene, chrysene/triphenylene, benz[a]anthracene, benzo[a]pyrene, benzo[ghi]perylene, and indeno[12,3-cd]pyrene). This report focuses on TBT, the imposex biological effect (from TBT) and copper. The webtool assessment results are available for cadmium, mercury and lead, which are the metals selected by the OSPAR Commission for priority action. The other metals covered are either micronutrients (zinc and copper) or have other biological functions (arsenosugars, chromium, nickel). Further to the PAHs and CBs mentioned above, the webtool assessment also covers the concentrations of selected indicators from other hazardous substances groups: four organochlorine pesticides, eleven selected organobromines, one dioxin and one furan. The available data for each substance in marine sediment, fish tissue (muscle and liver) and/or shellfish tissues are assessed. 6
OSPAR Commission 2014

Finally nine biological effects are assessed, three imposex (TBT related) and six other, either general
biologic effect or specific for PAH (metabolites) related biological effects. For some biological effects higher
numbers indicate better status; this is reflected in the assessment criteria and colour scheme.

Methods
Methods for data screening, treatment of quality assurance information, temporal trend assessment and
assessment against criteria used previously by CEMP are described in the CEMP Assessment Manual
(OSPAR Commission, 2008b) and in the help files at http://dome.ices.dk/osparmime/main.html.
Criteria used to assess environmental concentrations of hazardous substances are set out in the OSPAR
agreement on CEMP Assessment Criteria for the QSR 2010 (OSPAR agreement 2009-2). The derivation of
these criteria for hazardous substances is discussed in a Background Document on CEMP Assessment
Criteria for the QSR 2010 (OSPAR Commission, 2009b). These criteria reflect a two-stage process in which
data are compared to concentrations yielding limited risks of biological effects (see Environmental
Assessment Criteria, EACs) and then against Background Concentrations (BCs) or zero, expressed as
Background Assessment Concentrations (BACs). The latter reflects the OSPAR Hazardous Substances
Strategy that concentrations should be at or close to background levels for naturally occurring substances
(thus zero for man-made substances).
An overview of the assessment criteria is at Annex 3.
This year, two changes were made to the configuration of the rollover assessment:
    1. Time series were only considered if they contained data collected within the previous six
       monitoring years (2007-2012) instead of five; this is in line with the six-year reporting cycle for
       MSFD.
    2. Trends in sediment were considered over the most recent twenty monitoring years (1993-2012)
       instead of ten. Trends in biota were considered over the most recent ten monitoring years as
       before. Sediment concentrations are likely to change more slowly than biota concentrations, so a
       twenty-year period is more relevant. Furthermore, the monitoring frequency at many sediment
       stations has been reduced (partly to reflect the slower expected rate of change in sediment
       concentrations) so a longer period is required to maintain statistical power. The number of
       significant downward trends (over all parameters) increased from 515 (in last year’s assessment) to
       594, whilst the number of significant upward trends decreased slightly from 89 to 85. However, the
       number of time series that were assessed had also increased. The assessment maps suggest no
       major shift in interpretation.

Overview of data submissions
The data submissions by Contracting Parties are assessed from the ICES website (via
http://info.ices.dk/datacentre/accessions/CommissionSummary.aspx?commission=OSPAR).
The status of each submission is:
      X: the Contracting Party has submitted data and these data are available for use from the ICES database;
      P: the Contracting Party has submitted data, and the data are still being processed (quality checks etc., by the
      Contracting Party or by the data host ICES).
The date stamp on this overview of data submissions is 17 February 2014.
The parameters reported within the 2005-2011 period are listed (only parameter groups assessed in MIME
during the last years, others may occur). Data for each parameter are not necessarily reported every year
for each station.

                                                                                                                         7
Levels and trends in marine contaminants and their biological effects – CEMP Assessment report 2013
Imposex and other Biological Effects in Biota Data
Country 2007 2008 2009 2010 2011 2012 Parameters #
Denmark P P IMP
France X X X X X X IMP (EROD)
Germany X X GRS, PAH
Ireland X X X
Netherlands X X X X X X IMP, GRS
IMP, ALAD, EROD,
Norway P X P X X X
PAH
Spain X X X X X X IMP, EROD, TOX
Sweden X X X X X X IMP
P P IMP, GRS, EROD,
United Kingdom X P X X
X P PAH, TOX
Portugal X X IMP
# IMP: Imposex/intersex; GRS: Fish diseases; PAH: PAH metabolites; ALAD: ALA Dehydratase; EROD: Cytochrome P4501A activity;
TOX: Sediment bioassays
Contaminants in Biota Data
Country 2007 2008 2009 2010 2011 2012 Parameters
Metal, TBT, PAH,
Belgium X X X X PCB, PBDE
Metal, TBT, PAH,
Denmark X X X X X X PCB, PBDE, Dioxin
Metal, TBT, PAH,
Faroe Islands X X PCB, PBDE
France X Metal, PAH, PCB
Metal, TBT, PAH,
Germany X X X X X X PCB, PBDE
Iceland X X X X X X Metal, PCB
Metal, PAH, PCB,
Ireland X X X X X X PBDE, Dioxin, PFOS
Metal, PTB, PAH,
Netherlands X X X X X X PCB, PBDE
Metal, PAH, TBT,
Norway P X P X X X PCB, PBDE, Dioxin,
PFOS
Metal, PAH, PCB,
Portugal P P P Dioxin
Metal, TBT, PAH,
Spain X X X X X X PCB, PBDE
Metal, TBT, PAH,
Sweden X X X X X X PCB, PBDE, PFOS,
Dioxin
Metal, TBT, PAH,
United Kingdom X X P P X X PCB, PBDE
8OSPAR Commission 2014
Contaminants in Sediment Data
Country 2007 2008 2009 2010 2011 2012 Parameters
Metals, TBT, PAH,
Belgium X X X P P PCB, PBDE
Metals, TBT, PAH,
Denmark X X X X X X PCB, PBDE, dioxin
Metals, TBT, PAH,
Germany X X P X X PCB, PBDE
Ireland X Metal, PCB, TBT, PAH
Metal, PCB, TBT, PAH,
Netherlands X X X X X X PBDE
Metal, PCB, TBT, PAH,
Norway X BDE, PFOS
Metal, TBT, PCB,
Spain X X X X X X PBDE, PAH
Metal, PCB, TBT, PAH,
United Kingdom X P P P P P PBDE
France has submitted Metals, PAH and PCB in 2003 sediments as the latest.
For information the submission of seawater data is illustrated below. This is not mandatory monitoring and
the data are not included in the CEMP assessment. Not all parameters are monitored and reported every
year.
Contaminants in Seawater Data
Country 2007 2008 2009 2010 2011 2012 Parameters
Metals, TBT, PBDE,
Belgium X P X X P P PAH
France
Germany PX PX X PX P P PCB, PAH, Triazines
Ireland X
Netherlands X X X X X X Metal
Spain X
Metal, TBT, PCB,
United Kingdom X P P X P P Triazines
Status and trends
The focus of the 2013 assessment has been on antifouling components (tributyltin (TBT) and copper), and
the effects of the ban on TBT with regard to both concentrations in the marine environment and the
biological effects on marine snails (imposex). As TBT is phased out, use of copper in antifouling products
may increase. Copper concentrations in sediment and biota are increasing in many areas with heavy ship
traffic. Two assessment sheets for imposex and TBT and for copper describe the situation in detail.
Overview of results for biota and biological effects
For biota and biological effects there were 4 604 time series involving 46 parameters, with 827 significant
trends of which 88% were downwards. ALAD biological effect and TCCD (2,3,7,8-tetrachloro-
dibenzo[b,e][1,4]dioxin) were the only parameters where all the trends were upwards, but both
9Levels and trends in marine contaminants and their biological effects – CEMP Assessment report 2013 parameters only had three time series. Dioxin-like CB126 and the furan 2,3,7,8-tetrachloro-dibenzofuran had one upward and one downward trend out of seven time series. Metals are the most commonly investigated parameters with between 250 and 300 time series each. Of these, between 10% (copper) and 20% (cadmium) were significant. Between 64% (mercury) and 88% (zinc) of the significant trends were downwards, so metals are reasonably well regulated. Although PCBs were monitored at a similar number of stations as metals there were fewer time series, typically between 100 and 250, due to concentrations close to detection limits. Between 12% (congeners 28, 153, 156) and 29% (congener 126) of the time series had significant trends. Of the significant trends, 96% were downwards, so in general PCB concentrations are declining. PAHs are monitored at around 270 stations, with typically between 80 and 170 time series. Between 8% (fluoranthene, pyrene) and 38% (naphthalene) of the time series had significant trends. Overall 87% of the significant trends were downwards. There were no upward trends for 22 of the 46 parameters with time series, including most dioxins, organotins and biological effects related to TBT (Vas Deferens Stage Index, imposex and intersex). The reporting and coverage of other biological effects is still far behind that of the chemical parameters, with at most four time series available for any one parameter, and overall only three significant trends, all downwards. Four PAHs (naphthalene, anthracene, dibenzothiophene, pyrene) and four PCBs (congeners 101, 105, 156, 169) only had downward trends. Legacy chlorinated pesticides (HCB and -HCH) and BDE47 also only had downward trends, whereas DDE (DDT breakdown product) and gamma-HCH both had 2 upward trends. Overview of results for sediments Where biota and biological effects usually show the current status of pollution responding to the “average” over the last months or year, sampling surface sediments is giving an “average” of years depending on the sedimentation rate at the sampling site and sampling depths (usually upper 1 cm). Around 350 stations were sampled for metals, parent PAHs and PCBs, some 290 stations for brominated substances, and some 100 for organotins and methylated PAHs. Overall, there were 4161 time series involving 43 parameters, with 679 significant trends of which 87% were downwards. There were no upward trends for 19 of the 43 parameters with time series. For metals, between 7% (lead) and 19% (mercury) of the time series had significant trends. Metals had the highest number of upward trends, with 14 for both arsenic and copper. For arsenic, only 18% of trends were downwards. However, for all other metals, between 62% (copper) and 94% (mercury) were downwards. For the parent PAHs, typically around 16% of the time series were significant and, overall, 93% of trends were downwards. Similarly, for most of the PCBs around 19% of time series were significant and, overall, 91% of trends were downwards. There were no time series for phenyltins and only a few for the brominated substances, either because measurements were seldom reported or because measurements were close to or below the detection limits. However, there were significant downward trends in tri- and di-butyltins in 49% of time series, with no upward trends for any of the butyltins. 10
Imposex and TBT: Status, trends and effects
                                                                                                                                      HASEC14/AS01

in marine molluscs: an improving situation?

                                                                           Policy Issue: Impacts of tributylin (TBT) on marine molluscs

                                                                           Policy Objective: Continued reduction of levels of TBT in the
                                                                           marine environment, so that the exposure of marine molluscs
                                                                           and the adverse imposex effect remains below agreed OSPAR
                                                                           environmental assessment criteria (EACs), and ultimately
                                                                           reduction to ‘close to zero’ levels.

Background
Antifouling paints are widely used on vessels of all sizes to
prevent the growth of marine organisms. Historically,
antifoulants were primarily based on the use of copper, creating
higher, toxic, concentrations close to the hull and so preventing the
attachment of organisms. Around the beginning of the 1980s, a
more effective component began to be used, TBT. This compound
proved extremely effective at preventing the attachment of algal
slimes, which are usually the first organisms to attach and which
then provide a coating to which other organisms can attach.
By the mid-1980s, oyster growers in both France and Great
Britain were becoming extremely concerned about poor growth
in their stocks. Cultured Pacific oysters, in particular, were
misshapen and contained little meat, so were not
marketable. Eventually, the cause was traced to the use of TBT in
anti-fouling paints applied mainly to pleasure vessels used in
estuaries and moored in marinas, close to the
commercial shellfish beds.
TBT is now known to be sufficiently toxic to harm many marine
organisms at very low concentrations and is unequivocally linked
to impairment of reproductive performance in a number of
molluscan species, with some female marine snails developing male
sex characteristics in response to TBT exposure; this is termed
‘imposex’ (OSPAR Commission, 2000). TBT ultimately affects
many creatures, but the marine mollusc’s sensitivity puts it at
the front line making it an important indicator species giving
an early warning of trouble to the marine ecosystem.
Over the past decade, a range of national and international             Figure 1: Current monitoring status of imposex in marine molluscs
measures have resulted in a continuous phase-out in the                 resulting from this assessment
OSPAR area of TBT containing paints and of their use on vessels,
in aquaculture and on underwater structures. A global
ban on TBT in anti-fouling systems on large vessels came                Has regulation proved effective?
into effect in 2008. Together, these measures address the               Imposex monitoring is currently completed at over 390+ sites on up
main TBT-related pressures on the marine environment.                   to 5 marine mollusc species. There is a diversity of approaches to
Assessment criteria in the form of background assessment criteria       selecting target sampling stations, although there is an emphasis on
(BAC) and environmental assessment criteria (EAC) have been             stations which are in, or proximate to, harbours, ports and marinas
derived by OSPAR for imposex measurement in a variety of                where effects are most likely to occur. Currently the OSPAR EAC set
molluscs, representing the most sensitive species used                  for TBT-specific effects is met at most sites (~65%). It is also clear
in the OSPAR monitoring guidelines.                                     that there is an overall improvement in mollusc imposex status at
                                                                        locations common for both the 2010 QSR assessment (OSPAR
                                                                        Commission, 2009) and for this assessment (n=145 sites).

                                                                                                                                www.aphotomarine.com
Imposex and TBT: Status, trends and effects
HASEC14/AS01
in marine molluscs: an improving situation?
Has regulation proved effective? (cont.)
Figure 3: Improvement
Figure 2: Improvement (green) and non-improvement (red) (green) and non-
in 5 marine mollusc species sampled at 107 sites in OSPAR improvement (red) in dog
region II whelks (Nucella lapillus) at
Nassarius reticulatus
115 sites in OSPAR regions
Buccinum undatum
16 4 I to IV
2
3 I
0 0
Nucella lapillus
64
Littorina littorea
5
64
10
Neptunea antiqua
II
3
2 17 10
III
10
0
Improvement and non-improvement was measured at 145 sites 11
common to both the QSR and CEMP 2013 assessment, using the Vas IV
Deferens Stage Index (VDSI) – a 7 stage measurement based on degree 1
of penis and Vas Deferens development in females. Improvement was
detected at >80% of these common sites with non-improvement shown
at 16% of locations, while at 4% of sites the status is at background
and continues to be stable so overall improvement is clearly evident. www.oceana.org
What happens next?
Ongoing monitoring in marine gastropods will continue to provide a good indicator for TBT pollution and help in identifying
illegal use of stocks of TBT-containing anti-foulants or losses of TBT from dockyards, marinas and vessel maintenance activities.
One or more further rounds of imposex monitoring will be conducted in order to follow the expected
decline in impacts indicated by the reductions in inputs described above.
Most antifouling products have now reverted to the use of copper-based paints, in some cases with the addition of other
chemicals (“booster biocides”) which enhance their efficacy. These have also been investigated for environmental persistence
and effects and have also been banned. OSPAR needs to keep an eye on future developments in this area and
avoid further adverse consequences of use of other compounds. In addition, there is a large reservoir of TBT in
sediments, particularly in estuaries, which may continue to provide a secondary source to the water column.
Despite the evident significant downward trend in impacts from TBT, some areas are still subject to high imposex levels.
Sites which show non-compliance with the EcoQO should be subject to further monitoring. The continued measurement of
imposex in marine molluscs offers the most clear-cut tool for monitoring of a contaminant-specific pollution effect under the
Marine Strategy Framework Directive.
Sources of data and information:
Law, R.J., Bolam, T., James, D., Barry, J., Deaville, R., Reid, R.J., Penrose, R., Jepson, P.D., 2012. Butyltin compounds in liver of harbour porpoises (Phocoena phocoena) from
the UK prior to and following the ban on the use of tributyltin in antifouling paints (1992-2005 & 2009). Marine Pollution Bulletin 64, 2576-2580.
OSPAR Commission, 2000. Quality Status Report 2000. OSPAR Commission, London. 108 + vii pp.
http://www.ospar.org/content/content.asp?menu=00650830000000_000000_000000
OSPAR Commission, 2009. CEMP assessment report: 2008/2009 Assessment of trends and concentrations of selected hazardous substances in sediments and biota, [ISBN
978-1-906840-30-3]; Publication Number: 390/2009OSPAR 2010. Quality Status Report 2010. OSPAR Commission. London. 176 pp.
OSPAR Commission, 2011. Background document on organic tin compounds. ISBN 978-1-907390-76-0. Publication Number: 535/2011OSPAR Commission 2014
ASSESSMENT FOCUS:
Metals in sediment: status and trend of copper burden
Policy issue
Many man-made and naturally occurring chemicals end up in the North-East Atlantic as a result of land-
based and sea-based human activities.
Policy objectives
• EU - Marine Strategy Framework Directive:
- aims to achieve good environmental status of the EU's marine waters by 2020.
- concentrations of contaminants are at levels not giving rise to pollution effects.
• OSPAR:
- cessation of discharges, emissions … of hazardous substances by 2020.
- hazardous substances in the marine environment: (i) achieve concentrations near background
values for naturally occurring substances; and (ii) close to zero for man-made substances.
Specific Questions/Background
Copper is an extensively used metal in a variety of applications. Since the early 1980s measures have been
taken to reduce riverine inputs, direct discharges and atmospheric inputs. As a result there were important
downward trends in concentrations in both sediment and biota. Recently, however, increasing copper
levels have been observed in contrast to most other metals and organic substances.
Copper has been used in antifouling treatments since ancient times (Yebra et al (2004)), but especially so
from the end of the 18th century when it was used together with other metals (mainly lead, arsenic and
mercury) as an antifouling agent. Copper-based paints are usually not used on aluminium hulls as contact
between the two metals can form a galvanic element and lead to damage of the hull.
Since a ban on the most efficient antifouling agent TBT (see Assessment Sheet for TBT/Imposex),
substitution with copper based paints with Irgarol 1051 (cybutryne) or Diuron booster biocides started on
smaller vessels and has now continued for over a decade. These two booster biocides have since been
banned in UK, Denmark and Holland (only Diuron), and Danish legislation placed limits on the release rate
of copper from antifouling paints on pleasure crafts to 200 µg/cm2/day in the first 14 days and 350
µg/cm2/day after 30 days (Danish Ministry of the Environment, 2011).
The new antifouling components, though not causing effects as detrimental as TBT, can have certain
adverse effects on biota and be concentrated in sediments, especially in harbour areas (e.g. Briant et al
(2013)). The rapid growth in the use of copper-based antifouling systems in aquaculture over the past
decade has markedly increased the inputs of copper to the sea in northern Scotland and west and north
Norway (OSPAR Commission, 2011). The total use of copper in Norwegian fish farms was estimated to be
261 tons of copper in 2005 (Fitridge et al, 2012), the same range as the 75-311 tons of copper estimated to
have been used on UK pleasure boats in 1998 (UK Marine SACs project). The impact on sediments and
bottom organisms in the vicinity of fish farms and public awareness of chemical antifouling use opposed to
“clean and green” marketing together with EU classification of copper as a R50/R53 dangerous substance
(EEC directive 67/548, 1967) may change the focus to other means of protection against fouling. Recent
surveys though have not shown increased concentrations outside an impact area of less than 250 m around
fish farms.
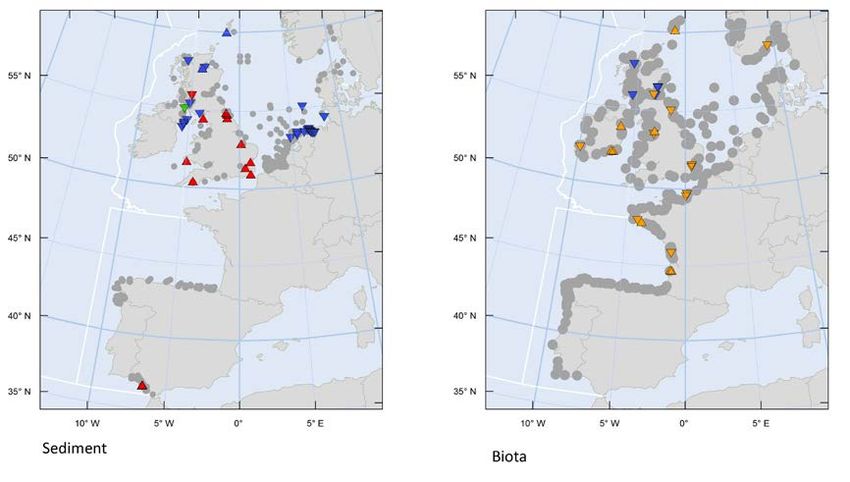
13Levels and trends in marine contaminants and their biological effects – CEMP Assessment report 2013 Findings Overall, the metal burden in sediments was mostly found to be decreasing in the North Sea, with 9% of 1541 assessed sediment time series showing downward trends compared to 3.5% showing an increasing trend. There were more significant trends for mercury than for any other metal: of the 180 mercury time series, 18% showed a downward trend and just 1% an upward trend. In contrast, 7% of the 202 copper time series in sediment were increasing and 11% were decreasing. The general pattern is (Figure 3, left) that sites with high concentrations are further increasing (southern UK, 10 of 11 “red” time series for UK upward, one downward) whereas for the green/blue sites below ERL/background, only two northern UK sites were upward of 22 trends. Also in Biota there have been 3% upward and 7% downward trends (of 267 time series). Most of the increasing trends were observed around the UK, in the Irish Sea, the English Channel and on the English east coast, rising from already elevated concentration levels. No direct geographical link was observed between copper in biota and sediment samples. Upward trends have also been found on the southern Spanish Atlantic coast and, at a lower concentration level, around the Shetland Islands to the north of Scotland. Most of the upward trends are seen in the vicinity of harbours, marinas and major shipping lanes. There are currently no indications from OSPAR monitoring of aquatic inputs (RID) of increased riverine inputs. In the QSR 2010 (OSPAR Commission, 2010) information about the use of copper, e.g. from Norway, suggested a significant increasing usage of copper in fish farming activities, but the focus on copper as a dangerous substance within the EU may help to reduce inputs and increasing concentration trends. Also, new results have indicated that use of copper and other substances in fish farming have only very local effects on copper concentrations in biota and sediments with elevated levels at 50 m, but not 250 m from the investigated farms in UK and Norway (Russell et al, 2011; Falk, 2014). Specific Questions/Background The importance of copper in brakes and tyres, and the losses from railway current supply, was mentioned in the QSR 2000 (OSPAR, 2000). A major source of copper to the environment is brake pad wear, and a recent estimate suggests that this contribution is at the same level as other sources of airborne copper pollution (Hulskotte et al (2006)). California has set up a roadmap with the aim of reducing copper concentrations in brake-pads to 5% in 2021 and to below 0.5% in 2025 (DTSC, 2010). Furthermore, a very important source is the corrosion of copper materials such as drinking water tubing, copper roofs and other copper containing materials (ER, 2014). Although a large part of the corrosion products is removed by adsorption on wastewater treatment sludge the remaining part flows via effluents into surface waters. Other important sources are the runoff and leaching of agricultural soils amended with livestock manure (especially from pigs) and, in some countries, due to application of sewage sludge as fertilizer (Nicholson et al, 2003). In harbours, leaching of copper antifouling from ships’ hulls is also of importance. In situ polishing of the brass propellers on ships by diving companies can also contribute to elevated concentrations of copper in harbour water and transport of fine copper particles to the sediment (Berbee, 2014). The fate of copper entering the marine environment is complex and the freshwater/sewage sources can be removed at the freshwater/seawater interface by flocculation and binding to settling particles or by being bound by natural complexing agents (e.g. humic substances) or substances released by algae before dispersion over larger areas. The increasing concentrations in sediments, but not in mussels, should be investigated further and the sources and pathways into the sediment clarified. 14
OSPAR Commission 2014

                 LEGEND                                        >>>> INCREASING CONCENTRATIONS >>>>
                                                                        Between background                  Above the upper
                                                                   assessment level and the upper      assessment criterion (ERL)
               Sediment                                            assessment criterion (ERL) with      with increasing trend (∆)
                                 Below background assessment           increasing trend (∆) or          or decreasing trend (∨)
                                 level with increasing trend (∆)        decreasing trend (∨)
                                     or decreasing trend (∨)            Above background assessment level and the upper
                 Biota                                                assessment criterion (ERL) with increasing trend (∆) or
                                                                                       decreasing trend (∨)

Figure 3: trend and status for Copper in sediment (left) and biota (right). Most trends are not significant
(grey circles). For significant time trends only, the assessment class is shown according to the table above.

References
Berbee, R.P.M. (2014). Rijkswaterstaat, personal information from discharge licensing requests in the Netherlands.
Briant, N., Bancon-Montigny, C., Elbaz-Poulichet, F., Freydier, R., Delpoux, S., Cossa, D. (2013). Trace elements in the sediments of a
large Mediterranean marina (Port Camargue, France): Levels and contamination history. Marine Pollution Bulletin 73, 78-85.
Danish Ministry of the Environment (2011) Declaration no 1257 of 15/12/2011 “The antifouling paint declaration” in Danish
https://www.retsinformation.dk/Forms/R0710.aspx?id=139585
DTSC (2010). Limiting copper in brake pads. http://www.dtsc.ca.gov/PollutionPrevention/BrakePads.cfm
EEC Directive 67/548 (1967). Council Directive 67/548/EEC of 27 June 1967 on the approximation of laws, regulations and
administrative provisions relating to the classification, packaging and labelling of dangerous substances.
http://eur-lex.europa.eu/LexUriServ/LexUriServ.do?uri=CELEX:31967L0548:en:NOT
ER (2014). Factsheet "Leaching of heavy metals from farmland and uncultivated land"; www.emissieregistratie.nl (choose English,
background documents, factsheet "Effluents WWTPs" (on effluents from wastewater treatment plants and sewer systems)
factsheet "Heavy metals from farmland").
Falk, A.H. (2014) Kadmium rundt oppdrettsanlegg – Er fiskefôr en potensiell kilde til kadmium i marint miljø? Akvaplan-niva rapport
6676-01 (31 p + appendices, in Norwegian).
Fitridge, I., Dempster, T., Guenther J., and de Nys, R. (2012). The impact and control of biofouling in marine aquaculture: a review.
Biofouling 28, 649–669
Hulskotte, J.H.J., Schaap, M., Visschedijk, A.J.H. (2006). Brake wear from vehicles as an important source of diffuse copper pollution.
   th
10 international specialized conference on diffuse pollution and sustainable basin management, September 18-22 2006, Istanbul
Turkey. https://www.tno.nl/downloads%5CW_211_Jan_Hulskotte.pdf
OSPAR Commission (2000). Quality Status Report 2000. OSPAR Commission, London. 108 + vii pp.
OSPAR Commission (2010). Quality Status Report 2010. OSPAR Commission. London. 176 pp.
Russell, M., Robinson, C.D., Walsham, P., Webster, L., Moffat, C.F. (2011). Persistent organic pollutants and trace metals in
sediments close to Scottish marine fish farms. Aquaculture. doi: 10.1016/j.aquaculture.2011.06.030
Yebra, D., Kiil, S., Dam-Johansen, K. (2004). Antifouling technology: past, present and future steps towards efficient and
environmentally friendly antifouling coatings. Progress in Organic Coatings, 50, 75–104.
Nicholson F.A., Smith S.R., Alloway B.J., C. Carlton-Smith C, Chambers, BJ (2003) Science of The Total Environment. Volume 311,
Issues 1–3, Pages 205–219

                                                                                                                                    15
Levels and trends in marine contaminants and their biological effects – CEMP Assessment report 2013
Conclusion
The general trend for hazardous substances in the environment is downward, in many cases based on actions taken to
reduce, minimise or ban use of specific chemicals in general or in specific applications within the individual countries,
within the EU or on a worldwide basis. Some naturally occurring substances like metals and PAHs are not following
this general trend and knowledge of the sources behind the upward trends are therefore required to make effective
legislation or recommendations on future voluntary restrictions on the use or discharge of such substances.
The OSPAR web-based tool for trends in the marine environment is one tool for following the OSPAR aim of reaching
levels of contaminants not giving rise to pollution effects and the cessation of discharges, emissions and losses of
hazardous substances by 2020. This report’s Assessment Focus sections and the associated Assessment Sheet outline
specific substances and the problems or solutions related to meeting these goals and will be produced and updated
regularly in the yearly CEMP assessment process.
OSPAR Commission References
(other than those of the Assessment Focus sections)
All these references are available via ‘Publications’ on www.ospar.org
2005. 2005 Assessment of data collected under the Coordinated Environmental Monitoring Programme (CEMP). OSPAR
Publication 235/2005. ISBN 1-904426-77-8.
2006. 2005/2006 CEMP Assessment: Trends and concentrations of selected hazardous substances in the marine
environment. OSPAR Publication 288/2006. ISBN 1-905859-26-0.
2007. 2006/2007 CEMP Assessment: Trends and concentrations of selected hazardous substances in the marine
environment. OSPAR Publication 330/2007. ISBN 978-1-905859-69-6.
2008a. 2007/2008 CEMP Assessment: Trends and concentrations of selected hazardous substances in sediments and trends
in TBT-specific biological effects. OSPAR Publication 378/2008. ISBN 978-1-906840-19-8.
2008b. CEMP Assessment Manual. Co-ordinated Environmental Monitoring Programme Assessment Manual for
contaminants in sediment and biota. OSPAR Publication 379/2008. ISBN 978-1-906840-20-4.
2009a. CEMP assessment report: 2008/2009 Assessment of trends and concentrations of selected hazardous substances in
sediments and biota, OSPAR Commission, 2009. OSPAR Publication 390/2009. ISBN 978-1-906840-30-3.
2009b. Background Document on Assessment Criteria used for assessing CEMP Monitoring Data for the Concentrations of
Hazardous Substances in Marine Sediments and Biota in the Context of QSR 2010. OSPAR Publication 461/210. ISBN 978-1-
907390-08-1.
2010. Quality Status Report 2010. OSPAR Commission, London 176 pp.
16OSPAR Commission 2014
Annex 1 – Analysed substances and significant trends in
sediment
Substance (code) # stations # TT % Up %Down
Anthracene (ANT) 354 138 1.4% 15.2%
Arsenic (AS) 339 185 7.6% 1.6%
Benzo[a]anthracene (BAA) 354 162 1.9% 12.3%
Benzo[a]pyrene (BAP) 362 165 1.2% 16.4%
BD100 (BD100) 298
$
2,2',4,4',5,5'-hexabromodiphenyl ether (PBDE153) (BD153 ) 295 4 0.0% 0.0%
BD154 (BD154) 297 0
BD183 (BD183) 296 0
BD209 (BD209) 168 0
BDE28 (BDE28) 285 0
$
2,2',4,4'-tetrabromodiphenyl ether (PBDE47) (BDE47 ) 298 7 0.0% 14.3%
$
2,3',4,4'-tetrabromodiphenyl ether (BDE66) (BDE66 ) 294 2 0.0% 0.0%
benzo[ghi]perylene (BGHIP) 364 165 0.6% 14.5%
2,2',4,5,5'-pentachlorobiphenyl (CB101) 356 94 1.1% 18.1%
2,3,3',4,4'-pentachlorobiphenyl (CB105) 272 20 % 0.0%
2,3',4,4',5-pentachlorobiphenyl (CB118) 356 96 3.1% 18.8%
2,2',3,4,4',5'-hexachlorobiphenyl (CB138) 355 100 2% 25%
2,2',4,4',5,5'-hexachlorobiphenyl (CB153) 356 112 2.7% 17.0%
2,3,3',4,4',5-hexachlorobiphenyl (CB156) 175 13 0.0% 0.0%
2,2',3,4,4',5,5'-heptachlorobiphenyl (CB180) 356 77 1.3% 15.6%
2,4,4'-trichlorobiphenyl (CB28) 356 74 1.4% 21.6%
2,2',5,5'-tetrachlorobiphenyl (CB52) 356 51 0.0% 9.8%
Cadmium (CD) 363 171 1.8% 13.5%
Chrysene (CHR) 347 148 0 18.9
Chromium (CR) 366 202 3.5% 6.9%
Copper (CU) 368 202 6.9% 11.4%
Dibenzothiophene (DBT) 90 21 0.0% 23.8%
C1 Dibenzothiophene (DBTC1) 83 27 3.7% 14.8%
C2 Dibenzothiophene (DBTC2) 77 28 0.0% 25.0%
C3 Dibenzothiophene (DBTC3) 77 28 0.0% 21.4%
dibutyltin (DBT) - expressed as Sn-atom (DBTIN) 129 42 0 40.5
Diphenyltin (DPTIN) 114 0
Fluoranthene (FLU) 364 179 1.7% 14.5%
Mercure (HG) 366 180 1.1% 17.8%
indeno[1,2,3-cd]pyrene (ICDP) 354 164 1.8% 19.5%
monobutyltin (MBT) - expressed as Sn-atom (MBTIN) 130 43 0 11.6
Monophenyltin (MPTIN) 114 0
Naphthalene (NAP) 170 56 1.8% 12.5%
C1 Naphthalene (NAPC1) 19 12 0.0% 0.0%
C2 Naphthalene (NAPC2) 101 36 0.0% 16.7%
C3 Naphthalene (NAPC3) 101 44 0.0% 15.9%
Nickel (NI) 368 202 2.5% 5.4%
17Levels and trends in marine contaminants and their biological effects – CEMP Assessment report 2013
Substance (code) # stations # TT % Up %Down
Phenanthrene (PA) 366 182 0.5% 13.7%
C1 Phenanthrene (PAC1) 86 32 0.0% 15.6%
C2 Phenanthrene (PAC2) 86 32 0.0% 21.9%
C3 Phenanthrene (PAC3) 77 25 0.0% 20.0%
Lead (PB) 367 201 2.5% 4.5%
pyrene (PYR) 364 181 1.7% 13.8%
tributyltin (TBT) - expressed as Sn-atom (TBTIN) 140 60 0 55
triphenyltin (TPTIN) 124 0
Zinc (ZN) 367 198 2.0% 12.1%
$: BD28, BD85, BD99, BD100, BD154, BD183, BD209: No TT data in 80 – 291 stations monitored
Annex 2 – Analysed substances and significant trends in
biota
Substance # stations # TT % Up %Down
Acetylcholine esterase activity (ACHE) 24 0
Aminolevulinic acid dehydrase (ALAD) 3 3 33.3 0
Anthracene (ANT) 271 90 0 8.9
Benzo[a]anthracene (BAA) 271 127 3.1% 18.9%
Benzo[a]pyrene (BAP) 268 87 4.6% 9.2%
3-hydroxy benzo(a)pyrene (BAP3OH) 4 1 0 0
$
2,2',4,4'-tetrabromodiphenyl ether (PBDE47) (BDE47 ) 210 42 0.0% 47.6%
benzo[ghi]perylene (BGHIP) 269 115 1.7% 8.7%
2,2',4,5,5'-pentachlorobiphenyl (CB101) 436 178 0.0% 12.9%
2,3,3',4,4'-pentachlorobiphenyl (CB105) 301 117 0 27.4
2,3',4,4',5-pentachlorobiphenyl (CB118) 437 215 0.9 15.3
3,3',4,4',5-pentachlorobiphenyl (CB126) 37 7 14.3 14.3
2,2',3,4,4',5'-hexachlorobiphenyl (CB138 403 209 0.5 20.6
2,2',4,4',5,5'-hexachlorobiphenyl (CB153) 438 248 0.4 12.1
2,3,3',4,4',5-hexachlorobiphenyl (CB156) 301 83 0 12
3,3',4,4',5,5'-hexachlorobiphenyl (CB169) 39 7 0 14.3
2,2',3,4,4',5,5'-heptachlorobiphenyl (CB180) 434 150 2 24
2,4,4'-trichlorobiphenyl (CB28) 435 98 1 11.2
2,2',5,5'-tetrachlorobiphenyl (CB52) 432 130 1.5 13.8
Cadmium (CD) 477 298 6.7 13.8
2,3,7,8-tetrachloro-dibenzofuran (CDF2T) 45 7 14.3 14.3
Chrysene (CHR) 266 135 1.5% 14.8%
Copper (CU) 457 267 3 7.5
Dibenzothiophene (DBT) 145 26 0 19.2
Dibutyltin (DBTIN) 68 19 0 47.4
DDE (p,p') (DDEPP) 232 99 2% 8.1%
Diphenyltin (DPTIN) 53 0
EROD (EROD) 64 3 0 0
18OSPAR Commission 2014
Substance # stations # TT % Up %Down
Fluoranthene (FLU) 270 167 1.8 6
1,2,5,6,9,10-hexabromocyclododecane (HBCD) 6 2 0 100
Hexachlorobenzene (HCB) 238 66 0 10.6
alpha-HCH (alpha-hexachlorocyclohexane) (HCHA) 248 25 0 20
gamma-HCH (gamma-hexachlorocyclohexane) (HCHG) 244 60 3.3 25
Mercury (HG) 482 286 5.6 9.8
indeno[1,2,3-cd]pyrene (ICDP) 267 105 2.9 5.7
Imposex stage (IMPS) 6 0
Intersex stage (INTS) 9 7 0 42.9
Monobutyltin (MBTIN) 68 10 0 30
Monophenyltin (MPTIN) 53 0
(Naphthalene) NAP 213 80 0 37.5
2-hydroxy naphthalene (NAP2OH) 4 0
Phenanthrene (PA) 271 163 2.5 9.8
1-hydroxy phenanthrene (PA1OH) 4 4 0 25
Lead (PB) 471 269 4.5 15.2
Pyrene (PYR) 252 164 0 7.9
1-hydroxy pyrene (PYR1OH) 25 4 0 50
1-hydroxy pyrene equivalent (PYR1OHEQ) 51 0
tributyltin (TBT) - expressed as Sn-atom (TBTIN) 78 27 0 81.5
polychlorinated dibenzo-p-dioxins (TCDD) 41 3 66.7 0
Triphenyltin (TPTIN) 62 2 0 0
Vas Deferens Sequence (VDS) 379 133 0 60.9
Zinc (ZN) 457 266 1.5% 10.9%
19Levels and trends in marine contaminants and their biological effects – CEMP Assessment report 2013
Annex 3 - Assessment criteria used in the CEMP data assessment1
MUSSELS (M) AND OYSTERS (O) FISH
SEDIMENT
(μg/kg dry weight except EC for metals: wet (μg/kg wet weight, except:
(μg/kg dry weight)
weight (ww)) EACpassive for CB: lipid weight (lw))
Group
Background/low Amber
Substance Blue (T0) Green (T1) Blue (T0) Green (T1) Blue (T0) Green (T1)
concentrations (T1)
< BAC < EAC < EC max. food
BC LC Spain < BAC < EAC < ERL BC/LC < BAC < EAC < EC BC/LC < BAC
Spain passive limit
Cd 200 86 310 129 1200 M-600 M-960 M-1000 a 26 1000 (bivalve.
O-1800 O-3000 O-1000 tissue)
Hg 50 53 70 91 150 M-50 M-90 M-500 a 35 500
O-100 O-180 O-500
Pb 25000 15500 38000 22400 47000 M-800 M-1300 M-1500 a 26 1500 (bivalve.
Metals
O-800 O-1300 O-1500 tissue)
As 15000 25000 ---
Cr 60000 81000 81000
Cu 20000 27000 34000 6000
Ni 30000 36000 ---
Zn 90000 122000 150000 63000
TBT --- --- --- 1.0 5.0 12.0
Naphthalene 5 --- 8 --- 160 --- --- 340
C1-naphthalene 155 2
C2-naphthalene 150
Phenanthrene 17 4.0 32 7.3 240 4.0 11.0 1700
C1-phenanthrene 170
C2-phenanthrene 200
PAHs
Anthracene 3 1.0 5 1.8 85 --- --- 290
Dibenzothiophene (DBT) 0.6 --- --- --- 190 --- --- ---
C1-dibenzothiophene 85
Fluoranthene 20 7.5 39 14.4 600 5.5 12.2 110
Pyrene 13 6.0 24 11.3 665 4.0 9.0 100
Benz[a]anthracene 9 3.5 16 7.1 261 1.0 2.5 80
1
The assessment criteria are discussed in OSPAR 2009, Background Document on CEMP Assessment Criteria for QSR 2010 (OSPAR Publication 461), which is based inter alia on:
- OSPAR 2004, OSPAR/ICES Workshop on the evaluation and update of background reference concentrations (B/RCs) and ecotoxicological assessment criteria (EACs) and how these assessment
tools should be used in assessing contaminants in water, sediment and biota (OSPAR Publication 214);
- OSPAR 1996, Report of the Third OSPAR Workshop on Ecotoxicological Assessment Criteria The Hague: 25-29 November 1996 (OSPAR Publication 81).
2
Sum of 1-methyl naphthalene and 2-methyl naphthalene
20OSPAR Commission 2014
MUSSELS (M) AND OYSTERS (O) FISH
SEDIMENT
(μg/kg dry weight except EC for metals: wet (μg/kg wet weight, except:
(μg/kg dry weight)
weight (ww)) EACpassive for CB: lipid weight (lw))
Group
Background/low Amber
Substance Blue (T0) Green (T1) Blue (T0) Green (T1) Blue (T0) Green (T1)
concentrations (T1)
< BAC < EAC < EC max. food
BC LC Spain < BAC < EAC < ERL BC/LC < BAC < EAC < EC BC/LC < BAC
Spain passive limit
Chrysene (Triphenylene) 11 4.0 20 8.0 384 4.0 8.1 ---
Benzo[a]pyrene 15 4.0 30 8.2 430 0.5 1.4 600
Benzo[ghi]perylene 45 3.5 80 6.9 85 1.5 2.5 110
Indeno[1,2,3-cd]pyrene 50 4.0 103 8.3 240 1.0 2.4 ---
CB28 0.0/0.05 0.22 1.7 0.0/0.25 0.75 3.2 0.0/0.05 0.10 67 lw
CB52 0.0/0.05 0.12 2.7 0.0/0.25 0.75 5.4 0.0/0.05 0.08 108 lw
CB101 0.0/0.05 0.14 3.0 0.0/0.25 0.70 6.0 0.0/0.05 0.08 121 lw
CB105 --- --- --- 0.0/0.25 0.75 --- 0.0/0.05 0.08 ---
CB118 0.0/0.05 0.17 0.6 0.0/0.25 0.60 1.2 0.0/0.05 0.10 25 lw
CB138 0.0/0.05 0.15 7.9 0.0/0.25 0.60 15.8 0.0/0.05 0.09 317 lw
CB153 0.0/0.05 0.19 40 0.0/0.25 0.60 80 0.0/0.05 0.10 1585 lw
CB156 --- --- --- 0.0/0.25 0.60 --- 0.0/0.05 0.08 ---
PCBs
CB180 0.0/0.05 0.10 12 0.0/0.25 0.60 24 0.0/0.05 0.11 469 lw
γ-HCH 0.0/0.05 0.13 3.0 0.0/0.25 0.97 1.45 --- --- --- 11b
α-HCH --- --- --- 0.0/0.25 0.64 --- --- --- --- ---
Pesticide
DDE (p,p’) 0.0/0.05 0.09 2.2 0.0/0.25 0.63 --- --- 0.0/0.05 0.10 ---
Hexachlorobenzene 0.0/0.05 0.16 20.0 0.0/0.25 0.63 --- --- 0.0/0.05 0.09 ---
Dieldrin 0.0/0.05 0.19 2.0 --- --- --- --- --- --- ---
a
datasets too limited to allow recommendation for BCs for metals in fish; b EAC for fish liver derived by applying a conversion factor of 10 on EAC for whole fish
Notes
- No assessment criteria for PBDE.
- Assessment criteria are used to assess contaminant concentrations
• Background Assessment Concentration (BAC)
• Environmental Assessment Criteria (EAC)
• Effects Range Low (ERL)
• European Commission food standard (EC)
- BACs were developed by the OSPAR Commission (OSPAR) for testing whether concentrations are near background levels. Mean concentrations significantly below the BAC are said to be near background.
- BACs and EACpassives are available for seven CBs.
- EACs were developed by OSPAR and the International Council for the Exploration of the Sea for assessing the ecological significance of sediment concentrations. Concentrations below the EAC should not
cause any chronic effects in marine species.
- BACs and / or EACs are available for ten PAHs.
- EACpassives were developed by OSPAR for assessing the ecological significance of sediment concentrations. Concentrations below the EACpassive should cause no chronic effects in marine species.
- ERLs were developed by the United States Environmental Protection Agency for assessing the ecological significance of sediment concentrations. Concentrations below the ERL rarely cause adverse effects in
marine organisms. Concentrations above the ERM will often cause adverse effects in some marine organisms.
- ECs have been used in the absence of any satisfactory criteria for assessing the ecological significance of biota concentrations. ECs are the maximum acceptable concentrations in food for the protection of
public health
21Victoria House t: +44 (0)20 7430 5200
37-63 Southampton Row f: +44 (0)20 7242 3737
London WC1B 4DA e: secretariat@ospar.org
United Kingdom www.ospar.org
OSPAR’s vision is of a clean, healthy and biologically diverse
North-East Atlantic used sustainably
ISBN 978-1-909159-64-8
Publication Number: 631/2014
© OSPAR Commission, 2014. Permission may be granted by the publishers for the report to be wholly or partly
reproduced in publications provided that the source of the extract is clearly indicated.
© Commission OSPAR, 2014. La reproduction de tout ou partie de ce rapport dans une publication peut être autorisée
par l’Editeur, sous réserve que l’origine de l’extrait soit clairement mentionnée.You can also read