Unraveling the association between socioeconomic diversity and consumer price index in a tourism country - Nature
←
→
Page content transcription
If your browser does not render page correctly, please read the page content below
ARTICLE
                  https://doi.org/10.1057/s41599-021-00822-w              OPEN

                  Unraveling the association between socioeconomic
                  diversity and consumer price index in a tourism
                  country
                  Yan Leng        1 ✉,   Nakash Ali Babwany2 & Alex Pentland3
1234567890():,;

                  Diversity has tremendous value in modern society. Economic theories suggest that cultural
                  and ethnic diversity may contribute to economic development and prosperity. To date,
                  however, the correspondence between diversity measures and the economic indicators, such
                  as the Consumer Price Index, has not been quantified. This is primarily due to the difficulty in
                  obtaining data on the micro behaviors and macroeconomic indicators. In this paper, we
                  explore the relationship between diversity measures extracted from large-scale and high-
                  resolution mobile phone data, and the CPIs in different sectors in a tourism country. Inter-
                  estingly, we show that diversity measures associate strongly with the general and sectoral
                  CPIs, using phone records in Andorra. Based on these strong predictive relationships, we
                  construct daily, and spatial maps to monitor CPI measures at a high resolution to comple-
                  ment existing CPI measures from the statistical office. The case study on Andorra used in this
                  study contributes to two growing literature: linking diversity with economic outcomes, and
                  macro-economic monitoring with large-scale data. Future study is required to examine the
                  relationship between the two measures in other countries.

                  1 McCombs School of Business, The University of Texas at Austin, Austin, TX, USA. 2 Independent Scholar, Toronto, ON, Canada. 3 Media Lab, MIT,

                  Cambridge, MA, USA. ✉email: yan.leng@mccombs.utexas.edu

                  HUMANITIES AND SOCIAL SCIENCES COMMUNICATIONS | (2021)8:157 | https://doi.org/10.1057/s41599-021-00822-w                                          1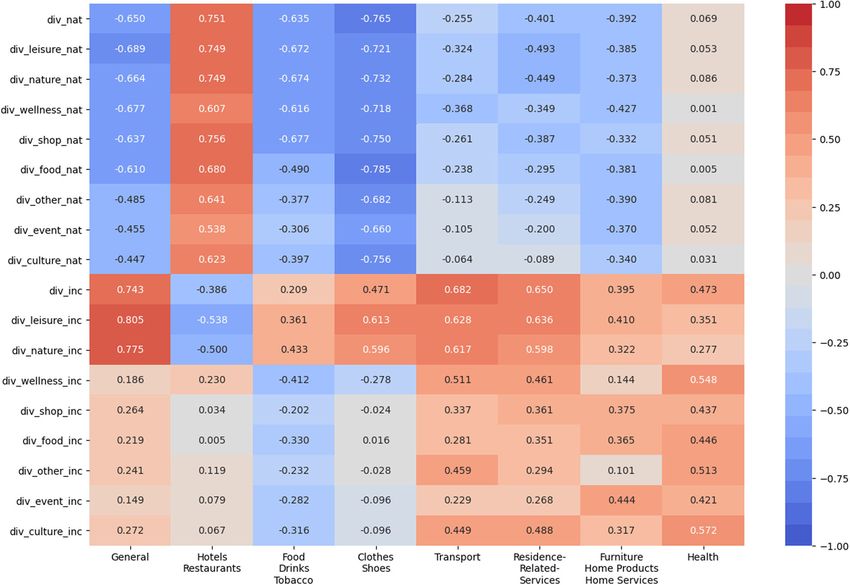
ARTICLE                                HUMANITIES AND SOCIAL SCIENCES COMMUNICATIONS | https://doi.org/10.1057/s41599-021-00822-w

D
Introduction
         iversity is exceedingly valuable in modern society (Puritty      (Maxmen, 2019), such as malaria in Kenya (Wesolowski et al.,
         et al., 2017). Empirical evidence relates diversity to tan-      2012), dengue in Pakistan (Wesolowski et al., 2015), and cholera
         gible benefits, such as productivity (sax, 2014; AlShebli         in Haiti (Rinaldo et al., 2012). Researchers have also used mobile
et al., 2018) and innovation (Ottaviano and Peri, 2006) for               phone data to extract macro-level indicators for touristic events
organizations and nations (Galinsky et al., 2015). Diversity has          performances (Leng et al., 2016a). During the COVID-19 pan-
attracted the interests from diverse fields. A commonly accepted           demic, we have seen an increasing number of applications using
view in cognitive science is that cognitive diversity enables the         mobile phones to do contact tracing (Oliver et al., 2020).
exchange of valuable information, thereby increasing creativity.          Therefore, mobile phone data has a nature appeal to unveil the
Similarly, sociologists find that diverse ties provide greater access      relationships between micro-level behaviors (e.g., diversity) and
to social and economic opportunities (Eagle et al., 2010). There          economic statistics (Leng et al., 2016a). In this paper, we present a
exist different opinions in economics; some claim that diversity          case study to explore the relationship between the travel demand
measures predict economic growth (Montalvo and Reynal-                    based diversity measures extracted from mobile phone data and
Querol, 2005); some argue for a negative impact due to resource           one of the most important macroeconomic indicators in this
allocation between groups (Alesina and Ferrara, 2005); some               tourism country, namely the Consumer Price Index.
argue that ethnic diversity deflates price bubbles (i.e., financial            To the best of our knowledge, our study constitutes the first
failures) (Levine et al., 2014); some argue that a diverse work           attempt to study the association between tourists-based diversity
force (e.g., gender and racial diversity) is generally beneficial to       and the CPI in a tourism country. We couple the most complete
corporate profits and earnings (Wright et al., 1995; Herring,              national communication data with the CPI statistics collected by
2009). Neighborhood ethnicity diversity has also been shown to            the Andorran government. Although the nature of the data limits
have different effects on housing price (Macpherson and Sirmans,          the ability to establish a causal relationship, we can explore the
2001). The enthusiasm from various disciplines highlights the             association between the micro-level diversity and the region
importance of understanding diversity. To date, however, the              economic indicator, both tourism and non-tourism related.
correspondence between micro-level diversity and macro-level              Specifically, we investigate the relationship between socio-
economic indicators (e.g., Consumer Price Index, measuring                demographic diversity extracted from mobile phone data sur-
changes in the cost of purchasing a fixed basket of goods (Stigler,        rounding different types of POIs1 and the CPI of different
1961)) has not been quantified. This gap is primarily due to the           industries. Our results demonstrate strong predictive relation-
lack of data on both micro-behavior and economic indicators.              ships between diversity measures of nationalities and income and
   Macroeconomic indicators are essential for economists and              the Consumer Price Index of different sectors. We build statistical
policymakers to discern expansions and contractions in the near           models to predict the CPIs of different categories in a European
future (Bok et al., 2018). A couple of studies focus on predicting        tourism country, Andorra. Finally, we estimate the CPI on a daily
inflation and CPI using the data collected from the financial               basis and at the cell tower levels, improving the temporal avail-
markets (Monteforte and Moretti, 2013; Modugno, 2013; Bań-                ability and spatial precision of CPI estimations. This associate
bura and Modugno, 2014). Establishing the relationship between            shows that diversity measures on tourists can be used to predict
micro-behaviors and macro-economic indicators is invaluable in            the macroeconomics in a tourism country.
monitoring the economic and social systems. Large-scale beha-                This paper proceeds as follows. Section “Methods” covers the
vioral data can illuminate social phenomena and economic pro-             setting and data of this study. Section “Results” presents the results
cesses (Bok et al., 2018; Lazer and Radford, 2017). Traditional           on the relationships between CPI and the diversity measures from
data collection methods are time-consuming, expensive to obtain,          mobile phone data. Section “Nowcasting and mapping” CPI pre-
and vulnerable to sampling error (Bok et al., 2018). Hence, pol-          sents daily nowcasting and spatial maps of the CPI measures. Sec-
icymaking can be improved with high spatial-temporal resolution           tion “Discussion” summarizes and concludes the paper.
indicators comparing with statistics with substantial publication
lags and limited contemporaneous information. Comparatively,
large-scale behavioral data has high geographic and temporal              Methods
granularity and is cost-effective (Lazer and Radford, 2017). Using        Call detail records. We use passively collected behavioral data,
massive data to approximate macro-indicators is especially pro-           call detail records (CDRs), in a European country, Andorra. The
mising in developing countries, where reliable data on economic           economy of Andorra heavily relies on tourism. The population of
livelihoods remains scarce (Blumenstock, 2016). There have been           Andorra is only 85,000, while it attracts 10.2 million international
several successful attempts in the literature. To name a few,             visitors annually (Cia.gov., 2012). The high volumes of tourists
satellite and survey data have been combined to predict local             makes Andorra an especially interesting country to study socio-
economic outcomes in five African countries by applying a deep             demographic diversity.
learning framework (Jean et al., 2016). Mobile phones have been              Mobile carriers initially collect CDRs for billing purposes;
combined with the environmental data to predict the Global                hence, this data widely exists in almost every country in the
Multidimensional Poverty Index (MPI) based on Gaussian Pro-               world. The spatial-temporal resolution of this data is high
cess regression (Pokhriyal and Jacques, 2017). The MIT Billion            compared to traditional surveys and has the most substantial
Prices Project used online prices to construct daily CPI in mul-          penetration rate among all passively collected data. The data is
tiple countries Cavallo and Rigobon (2016).                               recorded when users make phone calls, send short message
   Mobile phone data is especially promising in studying social           services (SMS), and use internet data services. It contains
and economic issues due to its high penetration rate and wide-            information on the longitude and latitude of the cell tower, the
availability (Leng et al., 2021, 2017). By January 2019, 5.1 billion      timestamp of the transaction, the registry country of the SIM
users globally had mobile phones, with a penetration rate of 67%.         card, and other characteristics about the phone (e.g., the brand,
Among them, 4.39 billion people had access to the internet                the vendor, the model, and the system of the phone). The CDRs
(Kemp, 2019). More than 20 mobile phone companies have                    were collected from July 2014 to August 2016 the only mobile
donated their proprietary information to developing big data              carrier in Andorra. Hence, the coverage of mobile phone data is
solutions for social good (Kemp, 2019; Bakker et al., 2019). Epi-         100% in our study, meaning that we have all the mobile phone
demiologists have explored call records to combat diseases                data of individuals who visited Andorra.

2                         HUMANITIES AND SOCIAL SCIENCES COMMUNICATIONS | (2021)8:157 | https://doi.org/10.1057/s41599-021-00822-w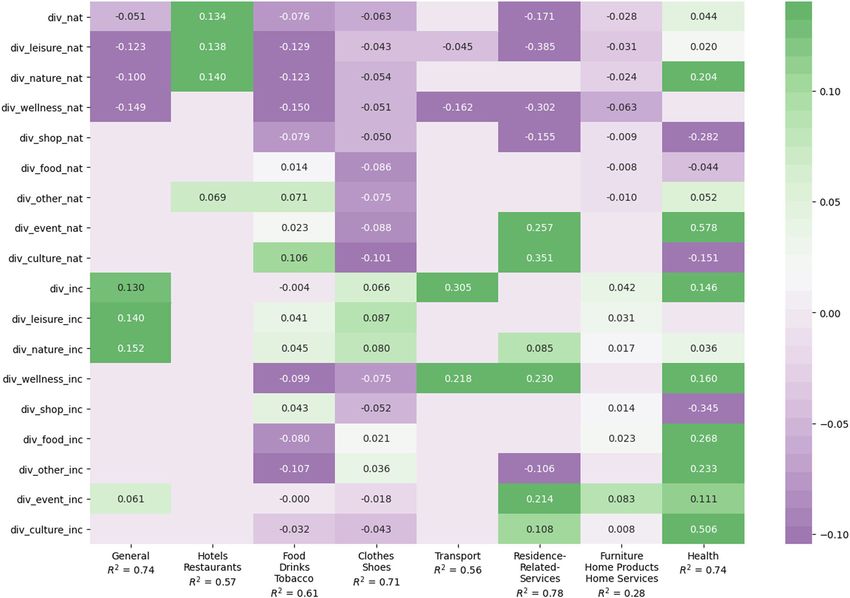
HUMANITIES AND SOCIAL SCIENCES COMMUNICATIONS | https://doi.org/10.1057/s41599-021-00822-w ARTICLE
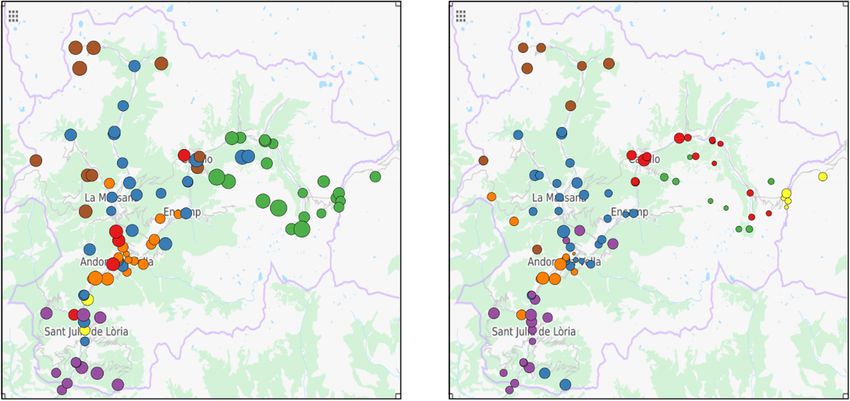
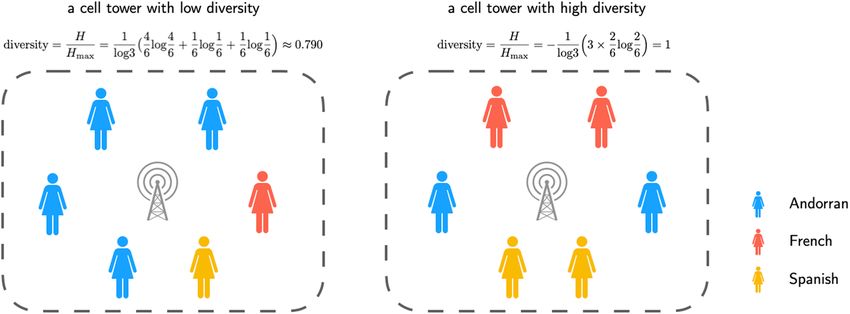
Fig. 1 Diversity at cell tower. We illustrate the diversity measure on nationality. Assume individuals connecting to the cell tower come from one of the
countries, {Andorra, Spanish, French}. The left panel—dominated by Andorrans—is less diversified than the right panel.
Categories of cell towers. There are one hundred cell towers in on day τ, Dnat,i,τ, is formulated as,
Andorra, each covering an area of 250 m to 2 km in radius. We !!
1 K t t i;k;τ
use the Voronoi tesselation to approximate the mobile tower i;k;τ
Dnat;i;τ ¼ þ ∑ ´ log ; ð2Þ
coverage (Fortune, 1987). We manually label the cell towers to log ðK τ Þ T
k¼1 i;τ T i;τ
eight categories of Points of Interests (POIs), including wellness,
leisure, shop, gastronomic, nature, event, culture, and others. where Ti,τ is the total number of individuals connected to cell i
Each tower may be associated with more than one POI category. during τ, ti,kτ is the number of individuals belonging to nation k
who connected to cell tower i during τ. K þ τ is the number of
distinct nationalities that appear at the cell tower on day τ. K is
Diversity measures. The diversity measure is defined using two
the total number of nations and K = 10 in our study. The nations
types of information, namely, nationality and approximation of
consist of Andorra and other countries with frequent tourists to
disposable income. We compute the diversity measures at each
Andorra, including Spain, France, Netherlands, Belgium, Russia,
cell tower and aggregate according to the eight kinds of POIs. We
the UK, Germany, Portugal, and others.
quantify diversity of cell tower as a function of Shannon entropy.
We use phone prices to approximate the disposable income of
According to Stirling (2007), there are three types of diversity
mobile phone users. We discretize phone prices into 14
measures, namely balance, variety, and disparity. The Shannon
categories, including [0, 20], [20, 30], [40, 50], [50, 100], [100,
entropy we employ in the paper captures balance. Balance mea-
150], [150, 200], [250, 300], [300, 400], [400, 500], [500, 600],
sures the pattern of apportionment of tourists from different
[600, 700], [700, 800], [800, 900], higher than 900. All units are in
origin countries. Specifically, Shannon entropy in our case cap-
USD. S is the number of phone price categories, and S = 14 in our
tures the evenness or concentration of tourists origins. It mea-
case. The diversity of income at cell tower i on day τ, Dinc,i,part, is
sures how likely a tourist from a certain origin interacts with
constructed similarly using Shannon entropy and is normalized
tourists from another country. We believe the types of interac-
by the number of categories. Formally, it is calculated as:
tions, how likely a foreigner interacts with tourists from another !!
country and how likely a local Andorran interacts with tourists 1 S p pi;s;τ
i;s;τ
from different countries, contribute to higher CPI. Variety and Dinc;i;τ ¼ ∑ ´ log ; ð3Þ
log ðSþ
τ Þ s¼1 T i;τ T i;τ
disparity are not appropriate in our study for the following rea-
sons. Variety is the number of categories into which system ele- where Sþ τ is the number of phone price categories with at least
ments are apportioned. However, a simple enumeration of the one users on day τ. pi,s,τ is the number of individuals connected to
number of countries tourists travel from cannot capture whether cell tower i who belong to phone price category s on day τ.
there are just one tourist from one country. Assume that there are A higher diversity measure implies that the cell tower attracts a
one tourist from each country around the world in Andorra, more diversified (i.e., less uniform) population; see Fig. 1 for an
varieties are large, however, cannot capture diversity. The other illustration. The left figure is dominated by Andorrans (with a
type is disparity, which refers to how each tourist origin can be lower diversity measure), while the right plot is more diversified
distinguished from another. It measures how different are the (with a higher diversity measure). We perform z-normalization
foreign tourists from another country in Andorra. This is not on all of the predictors used in this study to allow for an easier
appropriate in our setting in capturing diversity, as our goal is not comparison of variable importance.
to differentiate tourists from one country of origin from another. Let CðbÞ be the set of cell towers with POI type b. jCðbÞj is the
Next, we describe how we compute the diversity measure in number of cell towers with POI b. The average diversity of
this study, nationality at POI category b on day τ is:
1
Divnat;b;τ ¼ ∑ D : ð4Þ
J jCðbÞj j2CðbÞ nat;j;τ
H ¼ ∑ pj log ðpj Þ; ð1Þ
j¼1 Similarly, the average diversity of income at POI category b is:
1
Divinc;b;τ ¼ ∑ D : ð5Þ
jCðbÞj j2CðbÞ inc;j;τ
where pj is the proportion of individuals who belong to category j,
and J is the total number of categories. The diversity is computed Note that since one cell tower may be assigned to more than
at a daily level τ, where τ ∈ T and T is the set of days over the total one POI category, they may contribute to more than one POI
observational period. The diversity of nationalities at cell tower i categories.
HUMANITIES AND SOCIAL SCIENCES COMMUNICATIONS | (2021)8:157 | https://doi.org/10.1057/s41599-021-00822-w 3
ARTICLE                                  HUMANITIES AND SOCIAL SCIENCES COMMUNICATIONS | https://doi.org/10.1057/s41599-021-00822-w

Fig. 2 Correlations between the CPIs of different industries. The darker the color, the stronger the correlation.

Consumer price index. We collect the monthly CPI from the                    and nature places is exceptionally high, with correlations of 0.805
Andorra Government Statistics website2. The CPI measures we                  (p-val < 0.001) and 0.775 (p-val < 0.001). We further illustrate the
collected are a relative value compared with year 20013. Other               relationships via a scatter plot in the leftmost plot of the first row
than general CPI, we also collect CPI measures in different                  in Fig. 4. This pattern shows that we can easily predict general
industries. We segment them into tourism-related and residents-              CPI using a single diversity measure mentioned above.
related CPIs:                                                                   We observe that more diversity of nationality in the country
                                                                             predicts a deflation of the CPIs of (1) general (r = −0.650, p-val <
    ●   Tourism-related CPI: (1) hotels, cafes, and restaurants; (2)         0.001), (2) food, drinks and tobacco (r = −0.635, p-val < 0.001),
        food, drink, and tobacco.                                            and (3) clothes and shoes (r = −0.765, p-val < 0.001), while it
    ●   Resident-related CPI: (1) transport; (2) clothes and shoes.          predicts inflation of the CPIs of hotels and restaurants (r = 0.751,
        (3) residence related services4; (4) public and social security      p-val < 0.001). More diversity in income in the country predicts
        administration; (5) furniture, products and services for             an inflation in (1) general (r = 0.743, p-val < 0.001), (2) transport
        home5; (6) health.                                                   (r = 0.682, p-val < 0.001), and (3) residence related services
   We focus on the change in CPI relative to the past month. The             (r = 0.650, p-val < 0.001).
relative change in CPI in month t + 1 relative to month t is                    Besides, many of the diversity measures are highly predictive of
defined as,                                                                   CPIs in hotels and restaurants. For example, the diversity of
                                                                             nationality of the country and at shops associate with this diversity
                             CPItþ1  CPIt
                    ΔCPIt ¼                 :                 ð6Þ            measure with strong correlation (r = 0.75, p-val < 0.001). We present
                                 CPIt                                        the scatter plot in the two rightmost figures of the first row in Fig. 4.
   In Fig. 2, we present the correlations between each pair of               Additionally, four of the diversity of nationality measures (i.e.,
industries. Many of the resident-related CPIs (i.e., clothes,                diversity of nationality at the country level (r =
resident services, home products, and transport) are highly                  − 0.765, p-val < 0.001) and shopping (r = −0.750, p-val < 0.001),
positively correlated with the general CPI. Among these industrial           food (r = −0.785, p-val < 0.001), and cultural POIs (r = −0.756, p-
CPIs, the correlation between the CPI of transport and resident              val < 0.001)) negatively associate with the CPI of clothes and shoes.
services is the highest among all pairwise correlations                         Diversity of income and nationality present different roles in
(correlation = 0.93, p-val < 0.001). Two of the tourism-related              predicting inflation and deflation, as can be seen from the
CPIs (i.e., food, drink and tobacco, and leisure and culture)                contrary patterns. Diversity of income at different POIs positively
correlate with general CPI to a lesser extent. Interestingly, the            correlates with general CPI. In contrast, the diversity of
direction of the correlations is the opposite between the two. CPI           nationality presents a negative correlation. A similar contrary
of the hotel and restaurant industries negatively correlates with            pattern shows up in most other CPIs: diversity of nationality
the general CPI, while the correlation between CPI of food, drink            negatively correlates with CPI of residence related services (r =
and tobacco, and general CPI is positive.                                    − 0.401, p-val < 0.05), and furniture, home products, and home
                                                                             services (r = −0.392, p-val < 0.05). In contrast, the diversity of
Results                                                                      income positively correlates with these CPI measures: diversity of
Correlation between diversity and CPI. We first investigate the               nationality negatively correlates with CPI of transport (r = 0.682,
association between diversity and consumer price index (CPI), as             p-val < 0.001), residence related services (r = 0.650, p-val < 0.001),
illustrated in Figs. 3 and 4. We present the Pearson correlation in          and furniture, home products, and home services (r = 0.395, p-
Fig. 3. The association between the diversity of income at leisure           val < 0.05).

4                           HUMANITIES AND SOCIAL SCIENCES COMMUNICATIONS | (2021)8:157 | https://doi.org/10.1057/s41599-021-00822-w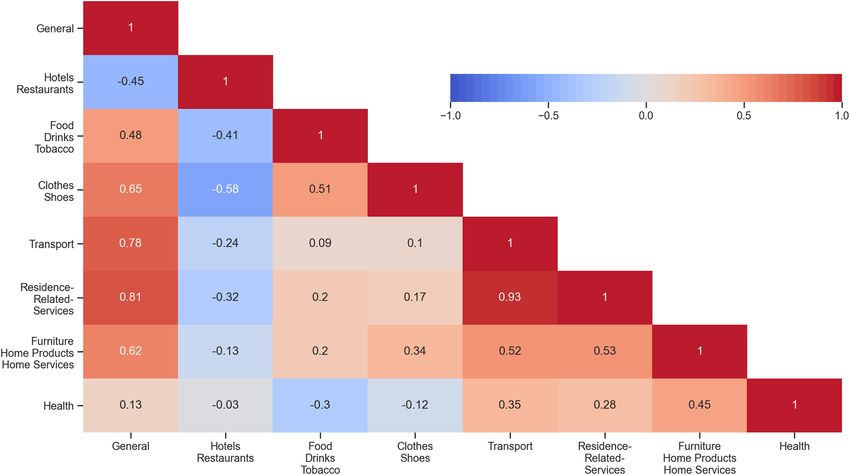
HUMANITIES AND SOCIAL SCIENCES COMMUNICATIONS | https://doi.org/10.1057/s41599-021-00822-w                                              ARTICLE

Fig. 3 Correlation between diversity measures and CPI. Heatmap of Pearson correlation in diversity measure (x-axis) and CPI (y-axis). The top nine rows
are nationality-related diversity measures. The bottom nine rows are income-related diversity measures. The value corresponds to Pearson correlation with
the legend shown on the right. Blue to red corresponds to correlation coefficients ranging from −1 to 1.

Fig. 4 Scatter plot of diversity measures and CPI measures of the top eight by the coefficients. The x-axis and y-axis correspond to diversity measures
and CPIs, respectively.

A selective set of diversity measures. Next, we use the elastic net           on CPIs. We see that diversity of income in the country, and at
regression method to select the most important covariates for                 leisure and nature POIs and the diversity of nationality at well-
predicting each CPI measure, as shown in Figs. 5 and 6. This                  ness POIs are more predictive of general CPI than other diversity
analysis helps us understand whether we can use a small number                measures. The three income-related diversity measures exhibit a
of diversity measures to reach reasonable predictive performances             positive relationship with general CPI, while the nationality

HUMANITIES AND SOCIAL SCIENCES COMMUNICATIONS | (2021)8:157 | https://doi.org/10.1057/s41599-021-00822-w                                               5
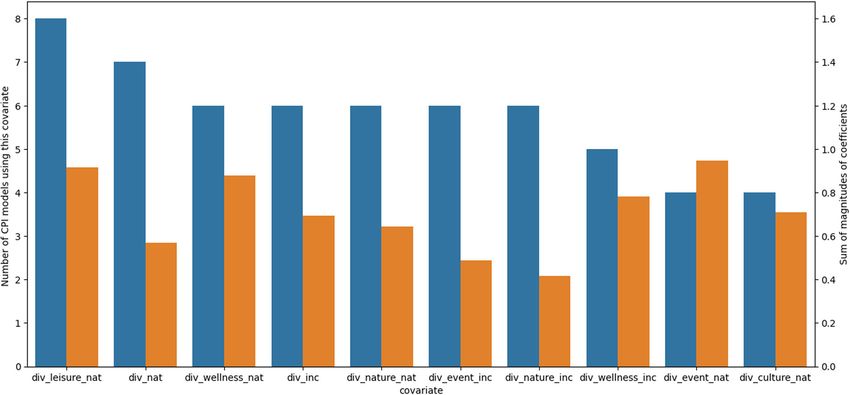
ARTICLE                                   HUMANITIES AND SOCIAL SCIENCES COMMUNICATIONS | https://doi.org/10.1057/s41599-021-00822-w

Fig. 5 Covariate selected by elastic net regression. We present the coefficients selected via elastic net regression. The value in the cell correspond to the
coefficients in the selected model. The covariates with non-zero coefficients are presented.

Fig. 6 Covariate importance. The number of models selected this covariate (the y-axis on the left) and the sum of coefficients in all models (the y-axis on
the right). The x-axis corresponds to the top covariates selected by both axises.

related diversity measures exhibit a negative correlation. In terms            R2 = 0.74, among which both diversity measures in the whole
of the CPI of hotels and restaurants, four covariates related to the           country and that at leisure and nature places are selected. Also,
diversity of nationality, including diversity of nationality in the            four diversity measures of nationality contribute negatively, and
country and at leisure, nature, and other POIs, are sufficient to               four diversity measures of income contribute positively to general
achieve reasonable outcomes. All of the diversity measures con-                CPI. This pattern—income diversity contributes positively, and
tribute positively, similar to the correlation pattern shown in Fig.           nationality diversity contributes negatively—also shows up in
3. For general CPI, eight diversity measures are selected to achieve           models for transport (with R2 = 0.78).

6                            HUMANITIES AND SOCIAL SCIENCES COMMUNICATIONS | (2021)8:157 | https://doi.org/10.1057/s41599-021-00822-w
HUMANITIES AND SOCIAL SCIENCES COMMUNICATIONS | https://doi.org/10.1057/s41599-021-00822-w                                        ARTICLE

   Four covariates are sufficient to predict the CPI of (1)                   correlated with the CPI of hotels and restaurants. Interestingly,
transport; and (2) hotels and restaurants. Comparatively, all                these two diversity measures negatively correlate with the CPI of
covariates provide additional predictive powers to nowcast the               clothes and shoes. Also, we use a statistical model to select a
CPI of (1) clothes and shoes, and (2) food, drinks, and tobacco.             smaller number of covariates for predictions. Our result shows
   We summarize the importance of covariates in Fig. 5. We                   that socio-demographic diversities of tourists in Andorra and at
present the top ten important covariates by the number of models             some tourism-related (e.g., leisure, nature, and wellness) POIs are
that contribute to and the sum of coefficients in magnitude. The              highly predictive of multiple sectoral CPIs. This result is useful
diversity of nationality at leisure POIs and in the whole country            when we cannot compute the diversity measures for many POIs
are predictive for most CPIs. Diversity of nationality at the event,         when data is limited or POIs are sparse. Although the data cannot
wellness, and leisure POIs are the most significant by the                    be used to show causality, the association suggests that diversity
magnitude of coefficients in all POIs. Diversity measures at the              can be a strong predictor for CPI. Our finding provides empirical
shop, food, and other POIs are not as predictive to CPI measures             evidence to support the relationships between social structures
comparing to the top ten diversity measures. This result indicates           (i.e., the diversity of individuals in a small region) and the CPI of
that diversities at leisure, nature, wellness, event, and culture POIs       different industries (both tourism and non-tourism related).
are more predictive for the CPIs in this tourism country. As data            Diversity of tourists may indicate that the service and tourism
on more countries become available, future research can explore              industry is attractive to tourists in different countries and with
whether this pattern exists in other tourism countries.                      different income levels. This suggests the wellness of the econ-
                                                                             omy. In addition, more international tourists may inflate the
Nowcasting and mapping CPI                                                   prices. All of these leads to changes in CPI.
Since the population’s diversity can be computed at a much                      Undoubtedly, new data and information technology can
higher spatial and temporal resolution, we can nowcast6 the CPI              improve timely statistics in economics and monitoring society
with much finer granularity. Using the covariates selected via                (Lazer and Radford, 2017). Our work represents an attempt to
elastic net regression7, we nowcast ΔCPI at a daily level and at the         build predictive maps and daily predictions of CPI using the
cell tower level. This analysis further highlights the benefit of             mobile phone data in a tourism-based European country,
using mobile phone data: it allows the government to adjust                  contributing to the burgeoning literature using big data to
economic policies timely, leading to a data-driven smarter city.             produce timely macroeconomic indicators. The strong asso-
                                                                             ciation may be due to the strong relationships between beha-
                                                                             vior of tourists and the CPIs of this tourism country. The
Temporal nowcasting on a daily basis. Regular updates on
                                                                             universal coverage of cell towers and the wide availability of
macroeconomic indicators are necessary to enable the federal
                                                                             CDRs makes it possible to predict CPI at high spatial and
government to (1) adjust historical data, to (2) escalate federal
                                                                             temporal resolutions in other countries. As behavioral data
payments and tax brackets, and to (3) adjust rents and wages
                                                                             becomes more available, the high-resolution predicted eco-
(Bok et al., 2018). To this end, our result helps to provide frequent
                                                                             nomic indicators from this data could complement the static
data for policymakers to complement the infrequent macro-
                                                                             and lagged government statistics to help policymakers and
economic statistics. This analysis demonstrates the potential of
                                                                             economists make more informed decisions. Using travel-
enhancing the timely proxy for CPI measures at the country and
                                                                             demand-based CDRs to provide CPI estimates of different
sectoral levels with mobile phone data. The nowcasting for daily
                                                                             industries to deliver accurate, high-resolution CPI maps offer a
CPI measures is shown in Fig. 7. We see that our model can
                                                                             way to complement traditional statistical methods and provide
capture the variations in the CPI measures. Most CPI indicators
                                                                             regular updates in high spatial resolution in this tourism
demonstrate a periodic pattern except for home product services,
                                                                             country. This study offers a framework to utilize human
which is relatively flat, and health services showed an increasing
                                                                             behavioral data by aggregating information at cell tower levels
trend in 2015. Our method captures the periodic pattern well,
                                                                             without revealing sensitive user information.
especially for clothes and shoes.
                                                                                Our study is not without limitations and hence points out
                                                                             several future directions. We provide empirical evidence
Mapping regional CPI. CPI is usually reported on a national                  demonstrating the relationship between diversity and inflation
scale, while our method can estimate such measures at a regional             (deflation) in a tourism country of Andorra. Andorra is an
level. This regional nowcasting provides more insights for pol-              interesting case study as a tourism country, as it is highly inter-
icymakers to design regional policies. In Fig. 8, we show the                nationally and attracts tourists from all around the world. This
spatial distributions of the predicted general CPIs in June 2015             makes Andorra an especially interesting case study for diversity.
and January 2016. The regional variation shown in both plots                 We expect that such study can possible extend to other tourism
demonstrates the regional differences in CPIs, which implies that            countries or cities that attract international travelers. We use
the country-level CPI is not sufficient to capture the regional               Andorra as a case study and this opens up opportunities for such
variations. We perform community detection on the cell towers                analysis in other countries using mobile phone data. We leave the
according to the predicted CPI. We observe that even if spatially            analysis to other contexts (non-tourism countries) for future
proximate cell towers belong to similar groups, we still see some            work. As more data becomes available, we expect the same fra-
farther-away cell towers being grouped. The regional nowcasting              mework to be applied in different countries to examine the
might be helpful for policymakers to design corresponding                    external validity of this study to more countries (tourism and
interventions to deal with the regional variations in CPI.                   non-tourism countries). The economic literature has laid out
                                                                             several micro-foundations to explain the forces underlying ethnic
Discussion                                                                   diversity and economic development Alesina and Ferrara (2005),
Our paper reveals strong associations between diversity measures             related to individual preferences Alesina et al. (2000), individual
and CPI measures in an European country of Andorra, con-                     strategies Alesina and Ferrara (2005), and production function
tributing to the growing literature of diversity in various dis-             (e.g., heterogeneity vs. innovation and productivity) Ottaviano
ciplines. We find that the diversity of income at leisure and nature          and Peri (2006). More theoretical groundings may grow out of
POIs alone is highly predictive of general CPI. Moreover, diver-             this work to explain the relationships between diversity and CPI,
sities of nationality at the country level and shops are highly              especially in a tourism country.

HUMANITIES AND SOCIAL SCIENCES COMMUNICATIONS | (2021)8:157 | https://doi.org/10.1057/s41599-021-00822-w                                        7
ARTICLE HUMANITIES AND SOCIAL SCIENCES COMMUNICATIONS | https://doi.org/10.1057/s41599-021-00822-w Fig. 7 Daily CPI nowcasting. The x-axis corresponds to the days. The y-axis is the predicted CPI (in blue) and the actual CPI (in orange), relative to the start of the period (June 1, 2014). Uncovering the underlying mechanism connecting diversity especially for the tourism0related industry. Fourth, tourists and CPIs is not within the scope of this study. However, we interacting with people from other nations and others with provide some potential explanations. Future studies can unveil different income levels can learn from the activities others the causal mechanism. First, the diversity of tourists may perform. This social learning process diversifies their travel indicate that the tourism industry of Andorra is attractive to experience and provides a new source of information. They diverse tourists (in different countries and with different may therefore make more purchases, leading to a higher CPI. income levels). The attractiveness to diverse cultures and We expect future research to provide micro-foundations to income may predict a higher CPI. This also suggests the eco- explain the forces underlying these socio-demographic diversity nomic wellness of the country, which may, in turn, attract measures on tourists and CPI measures in a tourism country. more tourists. Second, with many tourists from different Second, the data used in this paper does not allow for the nations, the Andorra tourism department and attraction establishment of causality. Further research can explore the causal organizers need to provide more services to accommodate relationships between social structure and inflation (deflation) diverse needs. Tourists from different nations conceivably have using observational causal analysis, which is useful in policy different language needs and expectations; tourists from dif- designs for economic development. Lastly, our results present ferent income levels are more likely to be interested in a interesting patterns in a tourism country. As more data become broader range of activities. Third, tourists from different available, it would be interesting to see whether similar patterns nations mean that more marketing investments have been persist comparing with other countries with a different economic made in foreign countries. This may also boost the CPI, structure. 8 HUMANITIES AND SOCIAL SCIENCES COMMUNICATIONS | (2021)8:157 | https://doi.org/10.1057/s41599-021-00822-w
HUMANITIES AND SOCIAL SCIENCES COMMUNICATIONS | https://doi.org/10.1057/s41599-021-00822-w                                                           ARTICLE

Fig. 8 Mapping general CPI in Andorra for general CPI in June, 2015 (left panel) and January, 2016 (right panel). The size of the nodes corresponds to
the predicted CPI of the corresponding month. The color of the nodes corresponds to the segmentation based on the predicted CPIs across our
observational period. We compute the pairwise correlations of cell towers and then perform spectral clustering on the correlation matrix to obtain the
clusters.

Appendix: data availability                                                  Talkingdata is a China-based company that provides data and
The data was obtained through a collaboration with the Andorra               services on mobile phone data10. Predicio is based in Europe that
government and the Andorra mobile carriers. The brand of the                 provides mobile phone data and helps businesses with actionable
phone and the country that the SIM card was registered was                   consumer behavior insights11. Flowminder is a Sweden-based
collected by the mobile carrier for billing purposes. The data is            company that provides anonymous phone records for policy-
fully anonymized (no user identification is collected) and the data           making and social good12. Moreover, other firms provide a
is stored on Andorran servers. The authors run algorithms on the             similar type of mobile phone records with higher spatial resolu-
Andorran server and obtain the aggregate statistics at cell tower            tion through GPS, such as SafeGraph13 and Cubiq14. To allow the
levels (e.g., diversity measures used in this study).                        collective efforts to fight against COVID-19, SafeGraph has cre-
   Next, we will discuss the availability of such data to replicate          ated a data consortium and shared mobility data in the US.
the analysis of this research. We agree that the availability of
mobile phone data and the practical applications of the method to            Data availability
assess the impacts of our paper. First, the application of mobile            Due to the nature of this research, data stakeholders did not agree
phone data into smart cities has been an active research field. In            for their data to be shared publicly, so supporting data is not
these applications, policy-making departments (e,g, transporta-              available.
tion, tourism environment) can easily collaborate with the mobile
carriers to utilize these data for social issues. The tourism and            Received: 9 July 2020; Accepted: 1 June 2021;
transportation department is a governmental organization and
can typically collaborate with mobile carriers to obtain relevant
data. These three organizations can collaborate collectively to
build smart cities to improve and economy, similar to the type of
collaboration built in this study. Second, in the case where the
collaboration has not been established, mobile phone data has                Notes
                                                                              1 A point of interest is a specific location that someone may find useful or attractive,
been made available by different stakeholders, specifically, open                such as a skiing resort or a museum. This term widely appears in geographic
data by some mobile carriers and services (data and analytics)                  information systems. The category of POI potentially indicates the trip purposes and
from some companies. Let us name a few of them. Owing to the                    activities in transport studies (Leng et al., 2021).
wide-availability and the opportunistic nature (i.e., data initially          2 Govern D’Andorra.
collected for billing purposes) of mobile phone data, many mobile             3 Note that CPI is a measure of the average change overtime in the prices paid by urban
                                                                                consumers for a market basket of consumer goods and services. Hence, it is usually
carriers share their data with the public. For example, in Europe,              reported relative to the past.
the CDR data has been made available in Milan and the Province                4 residence related services include (1) rental of housing, (2) services and products for
of Trentino in Italy. In Africa, CDRs have been opened to the                   the conservation of the home, (3) water distribution sewers and purification, (4)
public in Ivory Coast and Senegal through two Orange D4D                        electric energy, (5) gas, flammable liquids.
challenges. In Asian, China Unicom has shared the mobile phone                5 This category includes: (1) furniture, furniture accessories, carpets, (2) textile articles
data in 2018 CCF big data and computer intelligence competition                 for home and articles of furniture, (3) equipment and accessories for the home, (4)
                                                                                crystal, crockery and other home products, (5) small tools and disposable items for
through Data Foundation8. Except for these open data, some                      construction.
other organizations and companies provide services and analytics              6 Nowcasting is the prediction of the present, the very near future and the very recent
on mobile phone data. For example, AirSage provides the service                 past in economics (Giannone et al., 2008).
in the US for collecting this type of CDR data that commercial                7 When tuning the parameters for elastic net regression, the search space used for λ, the
companies can be used for identifying consumer patterns9.                       penalty term, was 10−3 to 103. The possible range for values of α, the mixing

HUMANITIES AND SOCIAL SCIENCES COMMUNICATIONS | (2021)8:157 | https://doi.org/10.1057/s41599-021-00822-w                                                                 9
ARTICLE HUMANITIES AND SOCIAL SCIENCES COMMUNICATIONS | https://doi.org/10.1057/s41599-021-00822-w
parameter between Ridge (α = 0) and Lasso (α = 1) regression, is 0 to 1. The optimal Oliver N et al. (2020) Mobile phone data for informing public health actions
parameters (λ, α) found for each CPI category were: (0.419, 0.105) for general CPI, across the covid-19 pandemic life cycle. Science Advances. 6,eabc0764
(0.296, 0.421) for hotels and restaurants, (0.470, 0) for food, drinks and tobacco, (2020)
(0.944, 0.0) for clothes and shoes, (0.117, 0.895) for transport, (0.117, 0.053) for Ottaviano GI, Peri G (2006) The economic value of cultural diversity: evidence
residence-related services, (1.501, 0.105) for furniture, home products and services, from us cities. J Econ Geogr 6:9–44
and (0.052, 0.053) for health. Pokhriyal N, Jacques DC (2017) Combining disparate data sources for improved
8 https://www.datafountain.cn/. poverty prediction and mapping. Proc Natl Acad Sci USA 114:
9 https://www.airsage.com. E9783–E9792
10 http://mi.talkingdata.com. Puritty C et al. (2017) Without inclusion, diversity initiatives may not be enough.
11 http://www.predic.io. Science 357:1101–1102
12 https://web.flowminder.org. Rinaldo A et al. (2012) Reassessment of the 2010–2011 haiti cholera outbreak and
13 https://www.safegraph.com. rainfall-driven multiseason projections. Proc Natl Acad Sci USA
14 https://www.cuebiq.com. 109:6602–6607
Stigler GJ (1961) The economics of information. J Polit Econ 69:213–225
Stirling A (2007) A general framework for analysing diversity in science, tech-
References nology and society. J R Soc Interf 4:707–719
Alesina A, La Ferrara E (2000) Participation in heterogeneous communities. Quar J Wesolowski A et al. (2012) Quantifying the impact of human mobility on malaria.
Econ 115:847–904 Science 338:267–270
Alesina A, Ferrara EL (2005) Ethnic diversity and economic performance. J Econ Wesolowski A et al. (2015) Impact of human mobility on the emergence
Lit 43:762–800 of dengue epidemics in pakistan. Proc Natl Acad Sci USA 112:11887–11892
AlShebli BK, Rahwan T, Woon WL (2018) The preeminence of ethnic diversity in Workforce diversity: a key to improve productivity. Proc Econ Finance 11, 76–85
scientific collaboration. Nat Commun 9:1–10 (2014)
Bakker MA et al. (2019) Measuring fine-grained multidimensional integration Wright P, Ferris SP, Hiller JS, Kroll M (1995) Competitiveness through
using mobile phone metadata: the case of syrian refugees in turkey. In: Guide management of diversity: effects on stock price valuation. Acad Manag J
to mobile data analytics in refugee scenarios. Springer, pp. 123–140. 38:272–287
Bańbura M, Modugno M (2014) Maximum likelihood estimation of factor models on
datasets with arbitrary pattern of missing data. J Appl Economet 29:133–160
Blumenstock JE (2016) Fighting poverty with data. Science 353:753–754
Bok B, Caratelli D, Giannone D, Sbordone AM, Tambalotti A (2018) Macroeconomic
nowcasting and forecasting with big data. Ann Rev Econ 10:615–643 Acknowledgements
Cavallo A, Rigobon R (2016) The billion prices project: using online prices for The authors would like to thank Andorra Telecom for providing the data used in this
measurement and research. J Econ Perspect 30:151–178 study. Meanwhile, the authors would like to thank Kent Larson and Luis Alonso from
Cia.gov. (2012) Cia world factbook entry: Andorra. Cia.gov MIT Media Lab for the helpful discussions.
Eagle N, Macy M, Claxton R (2010) Network diversity and economic development.
Science 328:1029–1031 Competing interests
Fortune S (1987) A sweepline algorithm for voronoi diagrams. Algorithmica 2:153 The authors declare no competing interests.
Galinsky AD et al. (2015) Maximizing the gains and minimizing the pains of
diversity: a policy perspective. Perspect Psychol Sci 10:742–748
Giannone D, Reichlin L, Small D (2008) Nowcasting: the real-time informational
content of macroeconomic data. J Monet Econ 55:665–676 Additional information
Herring C (2009) Does diversity pay?: race, gender, and the business case for Supplementary information The online version contains supplementary material
diversity. Am Sociol Rev 74:208–224 available at https://doi.org/10.1057/s41599-021-00822-w.
Jean N et al. (2016) Combining satellite imagery and machine learning to predict
poverty. Science 353:790–794 Correspondence and requests for materials should be addressed to Y.L.
Kemp S (2019) Digital 2019: global digital overview. https://datareportal.com/
reports/digital-2019-global-digital-overview Reprints and permission information is available at http://www.nature.com/reprints
Lazer D, Radford J (2017) Data ex machina: introduction to big data. Ann Rev
Sociol 43:19–39 Publisher’s note Springer Nature remains neutral with regard to jurisdictional claims in
Leng Y, Rudolph L, Zhao J, Koutsopolous HN (2017) Synergistic data-driven travel published maps and institutional affiliations.
demand management based on phone records. Proceedings of the ACM
SIGKDD International Workshop on Urban Computing
Leng, Y. et al. (2016) Urban computing using call detail records: mobility pattern Open Access This article is licensed under a Creative Commons
mining, next-location prediction and location recommendation. Ph.D. thesis, Attribution 4.0 International License, which permits use, sharing,
Massachusetts Institute of Technology adaptation, distribution and reproduction in any medium or format, as long as you give
Leng Y, Narrowing A, Pentland A (2021) Tourism Event Analytics with Mobile appropriate credit to the original author(s) and the source, provide a link to the Creative
Phone Data. Forthcoming in ACM/IMS Journal of Data Science Commons license, and indicate if changes were made. The images or other third party
Levine SS et al. (2014) Ethnic diversity deflates price bubbles. Proc Natl Acad Sci material in this article are included in the article’s Creative Commons license, unless
USA 111:18524–18529 indicated otherwise in a credit line to the material. If material is not included in the
Macpherson DA, Sirmans GS (2001) Neighborhood diversity and house-price article’s Creative Commons license and your intended use is not permitted by statutory
appreciation. J Real Estate Finance Econ 22:81–97 regulation or exceeds the permitted use, you will need to obtain permission directly from
Maxmen A (2019) Can tracking people through phone-call data improve lives?, url = the copyright holder. To view a copy of this license, visit http://creativecommons.org/
https://www.nature.com/articles/d41586-019-01679-5, urldate = 29 May, 2019 licenses/by/4.0/.
Modugno M (2013) Now-casting inflation using high frequency data. Int J Forecast
29:664–675
Montalvo JG, Reynal-Querol M (2005) Ethnic diversity and economic develop- © The Author(s) 2021
ment. J Dev Econ 76:293–323
Monteforte L, Moretti G (2013) Real-time forecasts of inflation: the role of financial
variables. J Forecast 32:51–61
10 HUMANITIES AND SOCIAL SCIENCES COMMUNICATIONS | (2021)8:157 | https://doi.org/10.1057/s41599-021-00822-wYou can also read


