Automatic Signboard Detection and Localization in Densely Populated Developing Cities
←
→
Page content transcription
If your browser does not render page correctly, please read the page content below

Automatic Signboard Detection and Localization
                                            in Densely Populated Developing Cities

                                         Md. Sadrul Islam Toaha, Sakib Bin Asad, Chowdhury Rafeed Rahman, S.M.
                                        Shahriar Haque, Mahfuz Ara Proma, Md. Ahsan Habib Shuvo, Tashin Ahmed,
                                                                 and Md. Amimul Basher

                                                        United International University, Dhaka, Bangladesh
arXiv:2003.01936v3 [cs.CV] 5 Jan 2021

                                              Abstract. Most city establishments of developing cities are unlabeled
                                              because of the necessity of manual annotation. Hence location and tra-
                                              jectory services remain under utilized in such cities. Accurate signboard
                                              detection and localization in natural scene images is the foremost task
                                              for accurate information retrieval from such city streets. We develop
                                              an automated signboard detection system suitable for such cities using
                                              Faster R-CNN based localization by incorporating two specialized pre-
                                              training methods and a run time efficient hyperparameter value selection
                                              algorithm. We have taken an incremental approach in reaching our final
                                              proposed model through detailed evaluation and comparison with base-
                                              lines using our constructed SVSO signboard dataset containing signboard
                                              natural scene images of six developing countries. Our proposed method
                                              can detect signboards accurately, even though images contain multiple
                                              signboards with diverse shapes and colours in a noisy background. Our
                                              proposed model achieves 0.91 mAP score on validation set and 0.90 mAP
                                              score on an independent test set.

                                              Keywords: Signboard · Faster R-CNN · Clustering

                                        1   Introduction
                                        Automatic signboard detection task has obtained its importance in computer
                                        vision and information retrieval field with many practical and relevant appli-
                                        cations. Some of them are store classification, automatic annotation of estab-
                                        lishments in web map, information extraction from signboard and unlawful
                                        signboard monitoring [1, 8, 34]. Nowadays, location based web services such as
                                        Google Maps, UBER and foodpanda are growing fast. Currently, these compa-
                                        nies require manual labeling of street establishments such as shops, hospitals,
                                        banks and other commercial landmarks [5, 22]. Thus, the establishment annota-
                                        tion process is still inefficient and in some cases inaccurate [3]. In this case, an
                                        automatic establishment annotation system can solve this problem using sign-
                                        board details [4], as signboards are a vital information source for street estab-
                                        lishments. The automatic establishment annotation problem can be divided into
                                        the following three sub tasks: signboard detection, information extraction and
                                        web map annotation. However, extracting information from signboard image is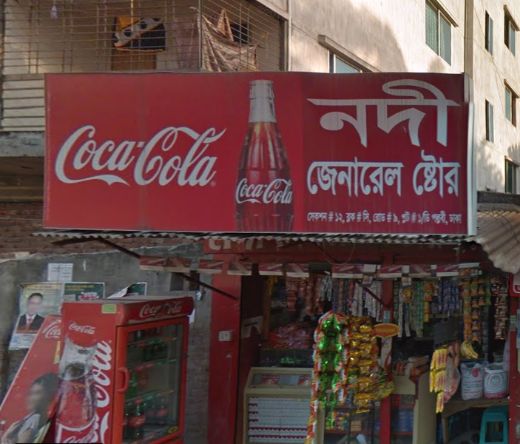
2       Toaha et al.

still an open problem due to large variation of signboards from one country to
another. Variations include noise, brightness, captured angle and background
type [1, 12, 16, 25, 29, 32, 34]. Therefore, it is important to localize the signboards
in an input image for the development of an efficient establishment annotation
system. Existing researches on signboard localization [1,8,12,15,24] show limita-
tions in their capability when faced with challenging urban features of developing
countries [27] such as - (i) diverse shapes and appearances of signboards, (ii) pres-
ence of pillars, trees and wires across the signboards, (iii) identical manifestation
of signboards, (iv) deformed and poor quality signboards and so on. In Figure
1a, the image depicts the signboard characteristics of a developed city, while
Figure 1b shows the scenario of developing or less developed cities. The fore-
most goal of this research is to solve the first step of the automatic establishment
annotation problem by detecting and localizing signboards from an image in the
context of densely populated developing cities.

                        (a)                                 (b)

Fig. 1. Problem complexity scenario: (a): Signboard characteristics of a developed city.
(b): Scenario of developing or less developed city which reveals the complexity of our
case.

    In relevant researches, authors performed signboard detection in three types
of approaches: (i) text segmentation method (TSM), (ii) classical image process-
ing and edge detection (CIPED) and (iii) segmentation based learning algorithm
(SBLA). However, existing works commonly focus on one or two of the mentioned
approaches. Applying TSM without detecting the signboard is a common strat-
egy for retrieving signboard information [16, 34] aiming to minimize the system
complexity. Authors in [34] used Maximally Stable Extremely Region (MSER)
algorithm to detect signboard region by segmenting texts for information extrac-
tion. They showed that their multi scale approach combined with TSM is able
to recognize signboard texts successfully. A system according to TSM technique
for signboard text recognition and translation was proposed in [16]. CIPED
methods are popular for simple and cost efficient implementation on signboard
detection. Applications of CIPED methods can be found in [12, 15, 24]. Authors
in [24] showed successful result of their CIPED approach for signboard detection
on 104 image dataset. Another CIPED based system was developed in [12] where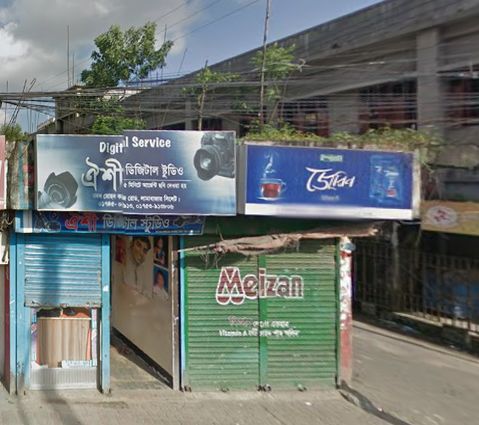
Automatic Signboard Localization       3

they introduced a few image processing techniques such as dilation, erosion and
distortion correction to reduce noises. They claimed that their proposed system
can detect the signboard area. The recent rise of deep learning based algorithms
has inspired researchers to solve the signboard detection problem using SBLA
methods [1, 8, 15]. Generally, SBLA approaches are beneficial for large variety
of object detection tasks [7, 11, 18, 30, 35, 37]. The authors in [15] showed that
combination of image processing techniques with neural network algorithm can
boost the signboard detection and text recognition results. A system was devel-
oped using Faster R-CNN algorithm in another research [23] where they claimed
to have improved the performance of Faster R-CNN on traffic sign detection by
introducing secondary RoI proposal method. In [1], authors proposed a Faster
R-CNN based detection algorithm for checking legality of building façades by
detecting window, door, advertising objects and signboards. They showed that
their method can detect signboards along with other objects. Store classifica-
tion task was performed in [8] where they solved the problem by detecting and
recognizing store signboards successfully using segmentation based algorithms.
    We now discuss the limitations of the existing approaches. Absence of texts
or different character orientations and shapes in signboard often causes TSM ap-
proaches fail in detecting the region of signboard. CIPED methods cannot solve
multiple signboard detection problem from image. Such methods do not work
well in noisy and overlapping signboard conditions. However, SBLA methods
carry the possibility of robust signboard detection system development. Exist-
ing SBLA based systems focus on a particular use case of signboard detection for
specific country region and these systems cannot differentiate between signboards
and other identical objects. Training segmentation based models end to end from
scratch degrades model performance, especially when the training dataset is not
large enough. If the dataset is different from existing large benchmark segmen-
tation datasets, fine tuning also becomes an obsolete option. Finally, choosing
appropriate anchor box dimensions is critical when it comes to SBLA algorithms
such as Faster RCNN. Typical practice is to go with the default values which
can be detrimental to dataset specific performance.
    In this research, we tackle the limitations of Faster RCNN based segmen-
tation algorithm in terms of signboard localization task in densely populated
developing cities. Our workflow is the same as that of Faster RCNN, but with
some dataset dependent modifications. We propose an algorithm named Anchor
Ratio & Anchor Scales (ARAS) for appropriate anchor dimension detection
to provide as hyperparameters in our algorithm. This algorithm takes into ac-
count the objects which are to be localized. We propose a method for secondary
labelled dataset extraction from our original signboard detection dataset. This
dataset facilitates our proposed convolutional neural network (CNN) backbone
model pretraining. Finally, we propose isolated pretraining of region proposal
network portion before moving on to the main training phase, which enhances
validation performance. In response to designing a signboard detection system
in the context of developing cities, we introduce a novel dataset named Street
View Signboard Objects (SVSO) in this research.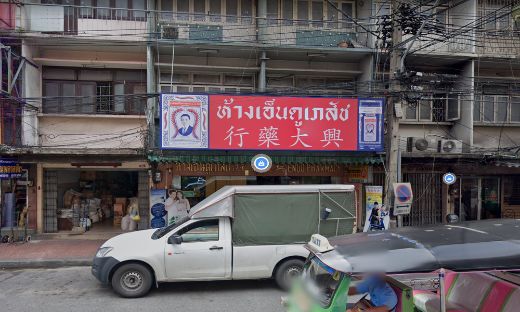
4         Toaha et al.

      In summary, our main contributions are as follows:

    – We design an algorithm named ARAS to generate appropriate proposal box
      shapes and sizes according to signboard characteristics of the dataset.
    – We have introduced two performance enhancer pretraining techniques - (i)
      SB PreCNN for specialized pretraining of CNN backbone and (ii) Pre-
      RCNN for isolated pretraining of region proposal network.
    – We have performed detailed evaluation and comparison of our proposed
      method with appropriate baselines.
    – We have made our street view signboard dataset publicly available, which is
      expected to facilitate further research in this domain.

2      Materials and Methods

2.1     Benchmark Dataset Construction

We present a dataset in this research titled, Street View Signboard Objects
(SVSO), which contains signboard images of establishments. The SVSO data
include signboard images of various shapes and colours from 6 developing coun-
tries, such as Bangladesh, Malaysia, Bhutan, Srilanka, Myanmar and Thailand.
The main focus was the 10 cities of Bangladesh - Dhaka, Chittagong, Sylhet, My-
mensingh, Barisal, Rajshahi, Khulna, Rangpur, Bogra and Pabna. These natural
scene signboard images are labelled in Pascal VOC format and are converted into
XML files using an auto labelling tool, labelImg [31]. An annotation file has been
generated in CSV format using all the labelled XML files and it contains 12961
signboard samples with image id, file path, bounding box information (xmin,
xmax, ymin, ymax, width) and object class fields. Figure 2 shows some sample
images of SVSO dataset. In SVSO dataset, each RGB image has been resized
to 1000 × 600 pixels using Anti-aliasing method. Then image normalization has
been performed on these images to transform each pixel value between 0 and 1.
To keep all image features on the same scale, standardization method has been
applied.

2.2     Faster R-CNN Algorithm Overview for Signboard Detection

Our signboard localization approach is based on the workflow of Faster R-CNN
which has shown state-of-the-art performance in various object detection appli-
cations [20,23,36]. Faster R-CNN can be divided into two independent networks.
The first one is region proposal network (RPN) and the second one is fast region
based convolutional neural network (Fast R-CNN). The RPN module proposes
the regions for possible signboard object locations, while Fast R-CNN module
returns the prediction result as object classification and bounding box regres-
sion. In Figure 3, we show the unified architecture of Faster R-CNN, which
consist of CNN, RPN and Fast R-CNN module. In the following discussion, we
briefly illustrate all the main components of Faster R-CNN architecture.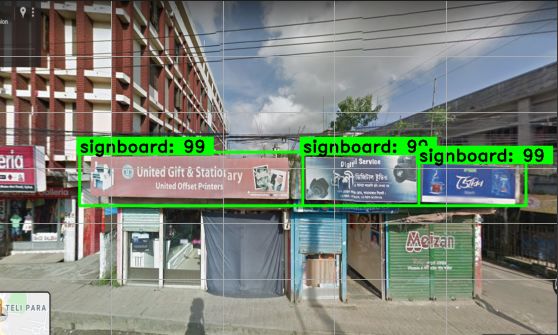
Automatic Signboard Localization             5

                  Fig. 2. Some sample images from SVSO dataset

                                               RPN
                                                                           Desired Output

                                                                CONV
                                            Anchor Box          Layer
                                             Generator

                            Feature Maps
                                                          ROI Proposals
                  CNN
                 VGG-16

Input Image                                                                     Fully
                                                                              Connected
                                                                               Layers
                                            ROI Pooling
                             Feature Maps
                                                              Fast R-CNN

Fig. 3. Faster R-CNN architecture: The single unified network for object detection.
The RPN module acts as the ‘attention’ and the Fast R-CNN module serves as the
‘detector’ of this architecture.
6      Toaha et al.

    CNN is used in both RPN module and Fast R-CNN detection network as
a backbone. Basically, CNN is composed of convolutional layers, ReLU layers
and pooling layers. Initially, CNN passes a fixed size input image through these
layers for appropriate feature extraction. Then it shares the output feature maps
with RPN layer and Fast R-CNN detector to predict the presence of signboard
class object in the input image. We bring some improvements in CNN backbone
architecture learning process in this research by introducing batch normalization
(BN) layers (details in Section 2.6) and a specialized dataset specific pretraining
technique (detailes in Section 2.3).
    RPN is utilized to find regions which may contain objects by applying the
feature matrix extracted by CNN. At first, it takes output feature map from
CNN backbone and generates proposal boxes for possible locations of signboard
objects in the image. Proposal boxes are produced for each point in the feature
map by generating N×M number of anchors, where N and M define number
of predefined anchor scales and anchor ratios, respectively. In the second step,
RPN eliminates overlapped proposal boxes using non max suppression (NMS)
method and returns the predicted proposal boxes as output. In this research, we
propose an algorithm named ARAS for defining appropriate anchor dimensions
(details in Section 2.5).
    Fast R-CNN consists of RoI pooling layer and fully connected dense lay-
ers. Initially, the feature maps from the CNN backbone and the proposal boxes
from the RPN layer are sent to RoI pooling layer. Then, RoI pooling layer ex-
tracts the features from the backbone feature map using RoI proposals of RPN
layer. Generally, max pooling is used to transform these features into fixed size
flattened vectors. These vectors from RoI pooling layer are passed into fully
connected classifier layers for regression and classification. These layers produce
more accurate predictions at every training iteration by minimizing classification
and regression losses using softmax and linear activation loss function, respec-
tively. Finally, the network returns the desired detection result by predicting
object class type and accurate bounding boxes. We propose isolated pretrain-
ing of RPN and Fast R-CNN layers to increase the detection and localization
performance of the proposed model (details in Section 2.4).

2.3   Pretraining of CNN Backbone

Fine tuning approach accelerates the training performance of deep learning
model by transferring important information of the pretrained model to the
target model [21, 26]. Therefore, this approach speeds up convergence of the
model [6]. In recent years, many object detection tasks have achieved state-of-
the-art results by pretraining with ImageNet dataset [19,20]. However, ImageNet
dataset does not contain any class similar to the objects of signboard class. Be-
sides, images in our dataset contain other objects similar to signboard shape,
colour and feature. Therefore, we proposed a pretraining method named Sign-
board PreCNN (SB PreCNN) to fine tune the CNN backbone.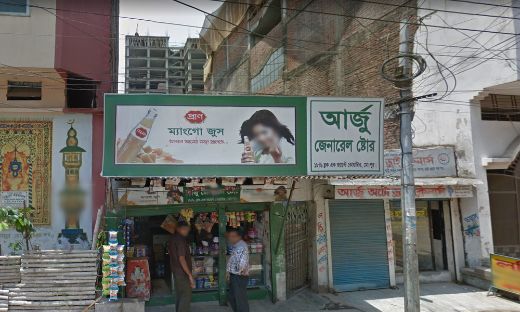
Automatic Signboard Localization       7

Pretrained Model Preparation Our approach is based on pretraining CNN
backbone architecture on signboard and non-signboard images. To prepare this
pretrained model, we build another secondary training dataset from the original
SVSO dataset using Object Region Extractor (ORE) method (described in
Section 2.3). This dataset contains 20000 signboard class and non-signboard
class images and the shape of each image is 224×224×3. At the beginning of
SB PreCNN model training, we pass the newly created signboard and non-
signboard images through convolutional and pooling layers of the CNN archi-
tecture to filter out signboard and non-signboard features. Finally, we send the
feature maps to fully connected layer and compute the binary class probability
scores using Sigmoid function. We train this model up to 60 epochs and further
use it for fine tuning of our proposed model CNN backbone.

                                        Object Region   non-signboard
                                          Extractor
                                            (ORE)

                     Input Image

                                                         signboard

Fig. 4. Signboard and non-signboard image generation using Object Region Extractor
(ORE) method

Object Region Extractor Object Region Extractor (ORE) method ex-
tracts each class objects (signboard) and background (non-signboard) regions
from an image without the need of any manual labeling. Initially, it takes an im-
age and its signboard labeling details as input. Then, we extend labelled bound-
ing box range by 10 pixels on both dimensions so that we can crop signboard
regions appropriately. To build signboard class images, we just crop out the la-
belled bounding box range from each image using corresponding xmin, xmax,
ymin and ymax values. After that, we collect non-signboard images using slid-
ing window method. Here, size of each window is 224 × 224 and we slide every
position on an image and verify whether the covered area is overlapped with any
labelled bounding box range or not. If a sliding window block does not belong
to any labelled bounding box range of signboard class, then we crop out this
block from the image and save it as non-signboard image. Using ORE method,
we have created 20000 signboard and non-signboard images. In Figure 4, we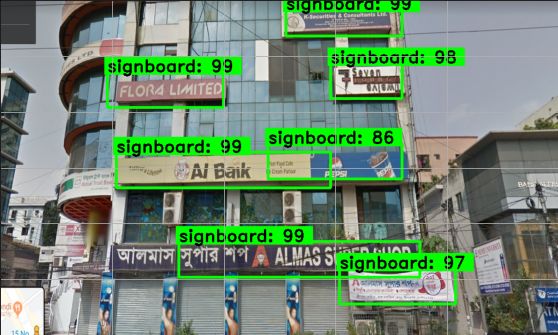
8      Toaha et al.

show signboard & non-signboard class sample generation from an original image
based on ORE method.

2.4   Pretraining of RPN and Fast R-CNN Detection Network
Generally, RPN and Fast R-CNN layers are initialized with randomly generated
weights and are placed on top of CNN backbone layers, where CNN layers are
initialized with pretrained weights [20, 23]. However, in terms of training speed
and performance, pretraining approaches give better performance than random
initialization [10]. We propose a pretraining technique named PreRCNN for
RPN and Fast R-CNN detection network. We prepare another pretrained model
by training only RPN layer and Fast R-CNN layer of Faster R-CNN architecture
on SVSO dataset, while making other layers non-trainable (frozen). We save the
updated weights and use them for fine tuning during the main training phase.
Such isolation training helps these detection layers get a solid grasp over the
dataset unique characteristics.

2.5   Appropriate Anchor Scale and Anchor Ratio Determination
Anchor box generation is a widely used technique in state-of-the-art localization
algorithms such as Faster R-CNN, YOLO etc [19, 20]. In Faster R-CNN, these
anchor boxes are generated in RPN layer using pre defined anchor ratios and
anchor scales. Initially, we start our experiments according to the default anchor
box dimensions provided in [20]. We have tuned the proposal box sizes during
training time. However, we have found out that without appropriate anchor
ratios and anchor scales in accordance with signboard shapes of the dataset, we
cannot lead the model towards our desired performance. Therefore, we propose
an algorithm named Anchor Ratio & Anchor Scales (ARAS) to select
appropriate anchor box dimensions. Figure 5 shows the RPN layer’s anchor box
generation process according to ARAS algorithm. We illustrate the algorithm
steps as follows.

                                    RPN
                                     +
                                   ARAS

Fig. 5. Generation of RPN layer anchor boxes using ARAS algorithm on signboard
image

1. Figure 6 illustrates the simulation of Step 1 to 3. At first, we create a data
   table to store all signboard width and height values from our dataset, which
   we use as an input of our ARAS algorithm.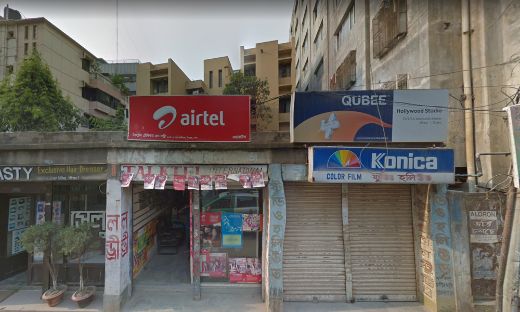
Automatic Signboard Localization            9

 2. Then, we read width and height values of signboard from the data table
    and create a separate list for widths and heights denoted as W and H,
    respectively.
 3. Since shape and size are the major features for accurate anchor box gener-
    ation, a proper clustering algorithm is necessary for generalized feature ex-
    traction [14, 17, 33]. Therefore in this step, we calculate K number of width
    and height centers using the K-Means clustering algorithm, where K = 3.
    These width and height centers are denoted as W C and HC, respectively.
    W C and HC values are important for aspect ratio calculation.

                                               400
Widths Heights
                                               350
 (W)     (H)
                                               300
  372      77
                                               250
  206      76
                                               200
                       k-means
                                      Height

  131      57
                         k=3                   150
  160     158                                  100
   ...     ...                                 50
   ...     ...                                  0
                                                     0     200     400        600   800   1000
                                                                  Width
   Step 1 & 2                                                       Step 3

Fig. 6. Step 1-3 of ARAS algorithm: 3 center values for widths and heights are cal-
culated using K-Means clustering.

                                                                   Anchor Ratios
                                                                         (X:1)
                3 Centers        Width-Height Ratios                     2.46 : 1
                WCi HCi             ( WCi / HCi )                        3.26 : 1
                                  174 / 71 = 2.45                        4.70 : 1
                174   71
                                  340 / 104 = 3.26
                340   104
                                  607 / 129 = 4.70                 Anchor Scales
                607   129
                                                                    71 104 129

                                         Step 4 & 5

Fig. 7. Step 4 & 5 of ARAS algorithm: using width centers (W C) and height centers
(HC), anchor ratios (AR) and anchor scales (AS) are determined
10     Toaha et al.

4. Figure 7 illustrates the simulation of Step 4 and 5. We calculate our desired
   aspect ratios (X : Y ) using W C and HC values. Therefore, at first we divide
   each width center, W Ci , by each height center, HCi , from K number of W C
   and HC values. Then we have set Xi = W Ci /HCi and Yi = 1. We keep
   aspect ratio in X : 1 format, because calculating aspect ratio in fraction
   format (X/Y ) can carry off to wrong anchor box generation. Now, we have
   stored K number of aspect ratios in a list titled Anchor Ratios (AR).
5. During aspect ratios calculation, we have stored the HC values as Anchor
   Scales (AS). Because each height center, HCi value represents the factor of
   the corresponding aspect ratio Xi : 1. As a result, appropriate proposal boxes
   can be produced by multiplying each height center HCi with corresponding
   aspect ratio Xi : 1, where the box width and height will be HCi × Xi and
   HCi × 1, respectively. So, until now we have calculated K number of anchor
   ratios (AR) and anchor scales (AS), we choose K = 3 to reduce the RPN
   layer’s processing time.
6. Figure 8 shows step 6 and 7. At this phase, we generate maximum width
   (Wmax ) and maximum height (Hmax ) from width (W ) and height (H) list
   of Step 1. Then, we calculate additional Anchor Ratio by dividing Wmax by
   Hmax and pick Hmax as additional Anchor Scale. This step is necessary for
   handling the cases of large signboards, as K-Mean faces challenging issues
   while clustering large valued outlier data points of the dataset [14].
7. Finally, we get K + 1 number of Anchor Ratios (AR) and Anchor Scales
   (AS) by including the maximum ratio and the maximum scale, respectively.
   Figure 9 shows the proposal box sizes and shapes generated from ARAS
   algorithm.

                                   Maximum                      Anchor Ratios
              Widths Heights     Width & Height                      (AR)
               (W)     (H)
                                  989     418                      2.46 : 1
               372     77
                                                    Final          3.26 : 1
                206    76
                                                                   4.70 : 1
                131    57          Additional
                                  Width / Height                   2.37 : 1
                160    158            Ratio
                 ...    ...                                 Anchor Scales (AS)
                 ...    ...      989 / 418 = 2.37
                                                            71 104 129 418
                                   Step 6 & 7

Fig. 8. Step 6 & 7 ARAS algorithm: final anchor ratios (AR) and anchor scales (AS)
are determined by including max aspect ratio and max height

2.6   Integration of the Proposed Methodology
Figure 10 shows our final signboard detection model architecture. Initially, we
have designed the CNN backbone with an improved version of VGG16 archi-
Automatic Signboard Localization 11
ARi / ASi 71 104 129 418
2.37 : 1 168.3 : 71 246.5 : 104 305.8 : 129 990.7 : 418
2.46 : 1 174.7 : 71 255.8 : 104 317.4 : 129 1028.3 : 418
3.26 : 1 231.5 : 71 339 : 104 420.5 : 129 1362.7 : 418
4.70 : 1 333.7 : 71 488.8 : 104 606.3 : 129 1964.6 : 418
Fig. 9. Proposal box sizes and shapes according to anchor ratios (AR) and anchor
scales (AS), which are generated from ARAS algorithm.
CNN RPN
VGG16 + BN (ARAS)
Pretrain - SB_PreCNN Pretrain - PreRCNN
Fast R-CNN
Pretrain - PreRCNN
Output
Input
Fig. 10. Unified architecture of our proposed segmentation algorithm.
tecture, where, Batch Normalization (BN) has been added between each convo-
lution and activation layer. BN reduces the hidden layer unit value covariance
shift and it resists overfitting of the model. Besides, it normalizes the previous
layer’s output and accelerates the model performance [26]. We have improved
RPN’s anchor box generation performance by tweaking Anchor Ratios and An-
chor Scales using ARAS algorithms. Finally, during our model construction, we
have fine tuned CNN backbone and RPN & Fast R-CNN detection network
based on SB PreCNN and PreRCNN pretraining techniques, respectively.
3 Results and Discussion
We have compared the detection performance of our proposed algorithm with
baseline methods based on mAP (mean average precision) score. Calculation of
Intersection Over Union (IoU ), P recision and Recall are required to determine
the mAP score. We consider a predicted signboard bounding box to be True
Positive (TP) only if IoU value of that box with a ground truth bounding box
is greater than or equal to 0.7. Otherwise, we consider the prediction as False12 Toaha et al.
Positive (FP). Here, P recision is the ratio of TP and the total number of pre-
dicted positives (TP+FP), while Recall is defined as the ratio of TP and total
number of ground truth bounding boxes (TP+FN).
TP
P recision =
TP + FP
TP
Recall =
TP + FN
So the mAP is mean of Average Precision (AP) over N object classes and the
AP is calculated from the area under the P recision vs Recall curve.
PN
i=1 APi
mAP =
N
All experiments have been performed using 80-20 training-validation split.
We start with the default hyperparameters (D Param.) of originally proposed
Faster R-CNN [20] which are as follows: 9 anchor boxes with anchor scales of
(128, 256, 512) and anchor ratios of (1:1, 1:2, 2:1), IoU threshold of 0.7 for NMS
and maximum box suppression of 300 for NMS output. We also initially use Im-
ageNet pretrained CNN backbone fine tuning like most relevant researches. We
show step by step evaluation and comparison starting from this baseline in order
to display the effectiveness of our proposed approach in signboard localization.
Initially, we experiment with different set of processed images of SVSO
dataset using default hyperparameters. In this regard, three different variations
of images have been prepared - (i) RGB image data have been resized using
OPENCV INTER AREA method, (ii) GRAY is a gray scale image obtained
using OPENCV BGR2GRAY method and (iii) PIL RGB has been resized using
PIL ANTIALIAS method [2]. We have achieved best performance on PIL RGB
image dataset. Generally, resizing images using PIL ANTIALIAS process retains
most of the important features of the original image, although it has greater run
time. We choose PIL RGB formation of SVSO dataset for further experiments.
Relevant performances are provided in Table 1.
Table 1. Faster R-CNN performance on validation set for application of
different image preprocessing techniques. VGG16 has been used as CNN
backbone.
Dataset Variant mAP
GRAY 0.65
RGB 0.70
PIL RGB 0.73Automatic Signboard Localization 13
In the second phase, we evaluate different CNN architectures [7, 9, 13, 28].
VGG16 architecture has shown comparatively better performance than Incep-
tionV4, Resent50, Densenet121 and Densenet201. Depth of VGG16 architecture
and its simple sequential nature prove to act as effective feature extractor for
signboard localization. We use VGG16 in all further experiments as our Faster
R-CNN backbone architecture. The results for CNN architecture experiments
are shown in Table 2.
Table 2. Experimental results of different CNN backbones (fine tuned from
ImageNet pretraining) while using default hyperparameters and PIL RGB
image processing technique.
CNN Backbone mAP
InceptionV4 0.56
Resnet50 0.58
Densenet121 0.61
Densenet201 0.64
VGG16 0.73
Table 3. Performance comparison of our proposed final model with baseline
methods on SVSO validation set in terms of mAP score
Backbone CNN Pre- RPN & Fast R- Anchor Ratio & mAP
CNN training CNN Pretraining Anchor Scale
VGG16 - - D Param. 0.69
VGG16 ImageNet - D Param. 0.73
VGG16 SB PreCNN - D Param. 0.78
VGG16+BN SB PreCNN - D Param. 0.81
VGG16+BN SB PreCNN PreRCNN D Param. 0.85
VGG16+BN SB PreCNN PreRCNN ARAS Algorithm 0.91
In the third stage, we experiment on CNN backbone pretraining technique.
Our proposed pretraining technique SB PreCNN (training based on signboard
and non-signboard image classification) showed improved performance on se-
lected VGG16 architecture. Figure 11 shows training and validation loss &
accuracy graph of CNN backbone pretrained model on the signboard and non-
signboard classification dataset. The 1st row of Table 3 shows the experiment
result of training from random state. The Results of pretraining experiments of
ImageNet and SB PreCNN are shown in 2nd and 3rd row of Table 3, respec-14 Toaha et al.
tively. The reason behind achieving better result using SB PreCNN pretraining
is that it helps the CNN backbone to learn distinguishing features between sign-
board and non-signboard object before start of end to end training. It is to
note that ImageNet dataset does not contain any class matching signboard type
objects.
Log-loss (cost function) accuracy
1.000
0.04
0.998
0.03
0.996
0.02 training 0.994 training
validation validation
0.992
0.01
0.990
0.00 0.988
10 20 30 40 50 60 10 20 30 40 50 60
epoch epoch
Fig. 11. Training and validation loss-accuracy graph of VGG16 CNN model pretraining
used later as CNN backbone of Faster R-CNN
In the fourth step, we add batch normalization (BN) between each convo-
lution and activation layer of VGG16 architecture used as CNN backbone. The
4th row of Table 3 shows the improved performance after this addition. Batch
normalization helps to prevent overfitting of the model and to increases training
stability.
Training Loss
Loss
epoch
Fig. 12. Training loss graph of the RPN & Fast R-CNN layer’s pretrained model.
In phase number five, we add PreRCNN pretraining scheme which has geared
up the training performance of our model shown in the 5th row of Table 3.
PreRCNN is our proposed pretraining technique for RPN & Fast R-CNN layer.
Figure 12 shows training loss graph of this pretraining. Isolated pretrainingAutomatic Signboard Localization 15
of the mentioned layers help them get an idea of appropriate region proposal
and localization independent of CNN backbone feature extraction quality, which
helps faster convergence during end to end training.
Finally, we use the anchor ratios (2.37:1, 2.46:1, 3.26:1, 4.70:1) and anchor
scales (71, 104, 129, 418) generated by our proposed ARAS algorithm instead
of default values. Choice of these hyperparameters have provided us with sub-
stantial validation performance improvement shown in the 6th row of Table
3. ARAS algorithm helps provide near optimal RoI proposals in accordance to
the dataset. We thus finish our experiments with an impressive validation mAP
score of 0.91. Figure 13 depicts the validation loss and mAP score graph of our
final model.
Validation Loss Validation mAP
3.5
0.90
3.0
0.88
2.5
0.86
Loss
mAP
2.0
0.84
1.5
0.82
1.0
0.80
0 20 40 60 80 100 0 20 40 60 80 100
epoch epoch
Fig. 13. Validation loss and mAP score graph of proposed model.
In Figure 14, we have shown number of training epochs vs validation mAP
score curves of our applied pretraining techniques and our final proposed model
that combines our proposed techniques. We can see clear improvement in terms of
performance and convergence of our proposed final model from this comparison
plot.
In summary, our final model includes the following modifications:
– Batch normalized VGG16 as CNN backbone
– Proposed SB PreCNN pretraining technique applied on the CNN backbone
– Proposed PreRCNN isolation pretraining applied on RPN and Fast R-CNN
layers
– Anchor ratios and anchor scales generated by implementing ARAS algorithm
We have tested our final model on an independent test set containing 200 natural
scene images from six diverse places of different countries such as - Bangladesh,
Malaysia, Bhutan, Srilanka, Myanmar and and Thailand. The mAP score for our
test set is 0.90. Such result proves the generalization ability of our final model
in terms of signboard detection and localization of densely populated developing16 Toaha et al.
Imagenet
90
SB PreCNN
SB PreCNN + PreRCNN
85 Final Model
80
mAP 75
70
65
0 20 40 60 80 100 120
Epoch
Fig. 14. Validation mAP score vs training epoch number curves: comparison after
inclusion of various pretraining methods and the final proposed model
city streets. We show signboard detection result of our proposed model on two
sample test images in Figure 15.
Limitation Case
Banner
(a) (b)
Fig. 15. Detection result of final model on sample images: (a): signboards detected
and localized accurately (b): a banner has been wrongly classified as signboard.
Banners and billboards degrade the signboard detection performance of our
proposed model when they show resemblance to signboards with same texture,
colour and shapes. Figure 15b shows such a case. Here, a white banner has
been mistakenly detected as signboard. Giving special attention to this special
case degrades general case performance. So, we leave banner distinction as future
research. Our proposed signboard detection and localization system can be used
with any signboard related dataset. The proposed training methods are expected
to be effective in any Faster R-CNN based localization task. The constructed
dataset can be helpful for the scientific community conducting researches in
similar area.Automatic Signboard Localization 17
4 Conclusion
In this research, we have developed an automatic signboard detection and lo-
calization system for developing cities. In order to tackle challenges such as
multiple signboard detection, heterogeneous background, variation in signboard
shapes and sizes, we introduce a robust end to end trainable Faster R-CNN
based model integrating new pretraining schemes and hyperparamater selection
method. We have constructed a suitable signboard dataset for this research which
we have made available for further research in similar domains. This research is
expected to facilitate automatic establishment annotation useful for modern web
based location services. Future research may aim at information retrieval task
from signboard images, where image resolution is low and signboards contain
multiple colour variations. This problem is challenging especially in the context
of densely populated developing city streets.
References
1. Bochkarev, K., Smirnov, E.: Detecting advertising on building façades with com-
puter vision. Procedia Computer Science 156, 338–346 (2019)
2. Bradski, G.: The opencv library. Dr. Dobb’s Journal of Software Tools (2000)
3. Crescenzi, V., Mecca, G.: Automatic information extraction from large websites.
Journal of the ACM 51(5), 731–779 (2004)
4. Glover, I., Xu, Z., Hardaker, G.: Online annotation – research and practices. The
Journal of Asian Studies 49(4), 1308–1320 (2007)
5. Gonzalez, A.L., Izidoro, D., Willrich, R., Santos, C.A.S.: Ourmap: Representing
crowdsourced annotations on geospatial coordinates as linked open data. In: An-
tunes, P., Gerosa, M.A., Sylvester, A., Vassileva, J., de Vreede, G.J. (eds.) Lecture
Notes in Computer Science (LNCS, vol 8224). pp. 77–93 (2013)
6. He, K., Girshick, R.B., Dollár, P.: Rethinking imagenet pre-training. In: 2019
IEEE/CVF International Conference on Computer Vision (ICCV). pp. 4917–4926
(2019)
7. He, K., Zhang, X., Ren, S., Sun, J.: Deep residual learning for image recognition.
In: 2016 IEEE Conference on Computer Vision and Pattern Recognition (CVPR).
pp. 770–778 (2016)
8. Huang, C., Li, H., Li, W., Wu, Q., Xu, L.: Store classification using text-exemplar-
similarity and hypotheses-weighted-cnn. Journal of Visual Communication and
Image Representation 44, 21–28 (2017)
9. Huang, G., Liu, Z., Van Der Maaten, L., Weinberger, K.Q.: Densely connected con-
volutional networks. In: 2017 IEEE Conference on Computer Vision and Pattern
Recognition (CVPR). pp. 2261–2269 (2017)
10. Huang, Y., Qiu, C., Wang, X., Wang, S., Yuan, K.: A compact convolutional neural
network for surface defect inspection. Sensors 20(7), 1974 (2020)
11. Kang, Y., Zhang, F., Gao, S., Lin, H., Liu, Y.: A review of urban physical envi-
ronment sensing using street view imagery in public health studies. Annals of GIS
26(3), 261–275 (2020)
12. Lim, D., Kim, Y., Park, I., Seung, J., Chong, K.: Robust detection of roi of sign-
boards in a noisy environment. International Journal of Signal Processing, Image
Processing and Pattern Recognition 10, 73–84 (2017)18 Toaha et al.
13. Liu, S., Deng, W.: Very deep convolutional neural network based image classifi-
cation using small training sample size. In: 2015 3rd IAPR Asian Conference on
Pattern Recognition (ACPR). pp. 730–734 (2015)
14. Mei, J., Jiang, X., Cai, J.: Learning local feature representation from matching,
clustering and spatial transform. Journal of Visual Communication and Image
Representation 63, 102601 (2019)
15. Panhwar, M., Ali, K., Abro, A., Zhongliang, D., Ali Khuhro, S., Memon, S.: Sign-
board detection and text recognition using artificial neural networks. In: 2019 IEEE
9th International Conference on Electronics Information and Emergency Commu-
nication (ICEIEC). pp. 16–19 (2019)
16. Park, J., Lee, G., Kim, E., Lim, J., Kim, S., Yang, H., Lee, M., Hwang, S.: Au-
tomatic detection and recognition of korean text in outdoor signboard images.
Pattern Recognition Letters 31, 1728–1739 (2010)
17. Quintanilla-Domı́nguez, J., Ojeda-Magaña, B., Marcano-Cedeño, A., Cortina-
Januchs, M.G., Vega-Corona, A., Andina, D.: Improvement for detection of mi-
crocalcifications through clustering algorithms and artificial neural networks.
EURASIP Journal on Advances in Signal Processing 2011(1), 91 (2011)
18. Rahman, C.R., Arko, P.S., Ali, M.E., Khan, M.A.I., Apon, S.H., Nowrin, F., Wasif,
A.: Identification and recognition of rice diseases and pests using convolutional
neural networks. Biosystems Engineering 194, 112–120 (2020)
19. Redmon, J., Divvala, S.K., Girshick, R.B., Farhadi, A.: You only look once: Unified,
real-time object detection. 2016 IEEE Conference on Computer Vision and Pattern
Recognition (CVPR) abs/1506.02640, 779–788 (2016)
20. Ren, S., He, K., Girshick, R.B., Sun, J.: Faster r-cnn: Towards real-time object
detection with region proposal networks. IEEE Transactions on Pattern Analysis
and Machine Intelligence 39, 1137–1149 (2015)
21. Russakovsky, O., Deng, J., Su, H., Krause, J., Satheesh, S., Ma, S., Huang, Z.,
Karpathy, A., Khosla, A., Bernstein, M., Berg, A.C., Fei-Fei, L.: Imagenet large
scale visual recognition challenge. International Journal of Computer Vision 115,
211–252 (2015)
22. Salih, A.Q.M.: Towards from manual to automatic semantic annotation: Based
on ontology elements and relationships. International journal of Web & Semantic
Technology 4(2), 21–36 (2013)
23. Shao, F., Wang, X., Meng, F., Zhu, J., Wang, D., Dai, J.: Improved faster r-cnn
traffic sign detection based on a second region of interest and highly possible regions
proposal network. Sensors (Basel, Switzerland) 19, 2288 (2019)
24. Shen, H., Tang, X.: Generic sign board detection in images. In: Proceedings of the
5th ACM SIGMM International Workshop on Multimedia Information Retrieval.
pp. 144–149. MIR ’03 (2003)
25. Silva, S.M., Jung, C.R.: Real-time license plate detection and recognition using
deep convolutional neural networks. Journal of Visual Communication and Image
Representation 71, 102773 (2020)
26. Simon, M., Rodner, E., Denzler, J.: Imagenet pre-trained models with batch nor-
malization. ArXiv abs/1612.01452 (2016)
27. Sokolova, T.: Urban signage design: Problems and prospects. IOP Conference Se-
ries: Materials Science and Engineering 463, 042002 (2018)
28. Szegedy, C., Ioffe, S., Vanhoucke, V., Alemi, A.A.: Inception-v4, inception-resnet
and the impact of residual connections on learning. In: Proceedings of the Thirty-
First AAAI Conference on Artificial Intelligence. p. 4278–4284. AAAI’17, AAAI
Press (2017)Automatic Signboard Localization 19
29. Tabernik, D., Skočaj, D.: Deep learning for large-scale traffic-sign detection and
recognition. IEEE Transactions on Intelligent Transportation Systems 21, 1427–
1440 (2020)
30. Tang, Y., Zhang, C., Gu, R., Li, P., Yang, B.: Vehicle detection and recognition
for intelligent traffic surveillance system. Multimedia Tools and Applications 76,
5817–5832 (2017)
31. Tzutalin: Labelimg (2015), git code
32. Uchida, S.: Text Localization and Recognition in Images and Video, chap. 25, pp.
843–883. Springer London (2014)
33. Wazarkar, S., Keshavamurthy, B.N.: A survey on image data analysis through
clustering techniques for real world applications. Journal of Visual Communication
and Image Representation 55, 596 – 626 (2018)
34. Wu, I.Z., Chang, H.C.: Signboard optical character recognition. Tech. rep., Stan-
ford University (2015)
35. Xu, Z., Yang, W., Meng, A., Lu, N., Huang, H., Ying, C., Huang, L.: Towards
end-to-end license plate detection and recognition: A large dataset and baseline.
In: Proceedings of the European Conference on Computer Vision (ECCV). vol.
11217, pp. 255–271 (2018)
36. Yu, P., Zhao, Y., Zhang, J., Xie, X.: Pedestrian detection using multi-channel visual
feature fusion by learning deep quality model. Journal of Visual Communication
and Image Representation 63, 102579 (2019)
37. Zhang, F., Luan, J., Xu, Z., Chen, W.: Detreco: Object-text detection and recogni-
tion based on deep neural network. Mathematical Problems in Engineering 2020,
1–15 (2020)You can also read