FAKEMIX AUGMENTATION IMPROVES TRANSPARENT OBJECT DETECTION
←
→
Page content transcription
If your browser does not render page correctly, please read the page content below
FakeMix Augmentation Improves Transparent Object Detection

                                                                          Yang Cao1 Zhengqiang Zhang1 Enze Xie2
                                                                       Qibin Hou3 Kai Zhao4 Xiangui Luo1 Jian Tuo1
                                                                        Guangzhou Huya Information Technology Co.,Ltd1
                                                                                  The University of Hong Kong2
                                                                        National University of Singapore3 Tencent Youtu4
arXiv:2103.13279v1 [cs.CV] 24 Mar 2021

                                                                  Abstract
                                             Detecting transparent objects in natural scenes is chal-
                                         lenging due to the low contrast in texture, brightness and
                                         colors. Recent deep-learning-based works reveal that it
                                         is effective to leverage boundaries for transparent ob-
                                         ject detection (TOD). However, these methods usually en-
                                         counter boundary-related imbalance problem, leading to
                                         limited generation capability. Detailly, a kind of bound-
                                         aries in the background, which share the same charac-
                                         teristics with boundaries of transparent objects but have
                                         much smaller amounts, usually hurt the performance. To
                                         conquer the boundary-related imbalance problem, we pro-
                                         pose a novel content-dependent data augmentation method
                                         termed FakeMix. Considering collecting these trouble-
                                         maker boundaries in the background is hard without cor-
                                         responding annotations, we elaborately generate them by
                                         appending the boundaries of transparent objects from other
                                         samples into the current image during training, which ad-
                                         justs the data space and improves the generalization of
                                                                                                              Image            GT           TransLab         Ours
                                         the models. Further, we present AdaptiveASPP, an en-
                                                                                                          Figure 1: Visual result comparisons between TransLab [22]
                                         hanced version of ASPP, that can capture multi-scale and
                                                                                                          and our FANet. In the top two rows, the boundaries, labeled
                                         cross-modality features dynamically. Extensive experiments
                                                                                                          by the pink rectangle, have similar content on their two
                                         demonstrate that our methods clearly outperform the state-
                                                                                                          sides. In the bottom two rows, the boundaries, labeled by
                                         of-the-art methods. We also show that our approach can
                                                                                                          the pink rectangle, have obvious reflection and refraction.
                                         also transfer well on related tasks, in which the model meets
                                                                                                          These boundaries are similar to the boundaries of transpar-
                                         similar troubles, such as mirror detection, glass detection,
                                                                                                          ent objects, leading to false detection labeled by the orange
                                         and camouflaged object detection. Code will be made pub-
                                                                                                          rectangle. Our approach performs better due to FakeMix.
                                         licly available.
                                                                                                          detect for vision systems and even humans. Because trans-
                                                                                                          parent objects are a widespread presence in our lives, they
                                         1. Introduction                                                  also have an influence on other tasks, such as depth estima-
                                            Transparent Object Detection (TOD) [22, 23, 1] aims at        tion [21], segmentation [15], and saliency detection [9, 6].
                                         detecting the transparent objects from the natural scene, e.g.   Therefore, how to accurately detect transparent objects is
                                         windows, utensils, and glass doors, which widely exist in        essential for many vision applications.
                                         natural scenes. It is a relatively new and challenging task         Benefiting from boundary clues, recent deep-learning-
                                         in the vision community. Unlike opaque objects, transpar-        based work [22] have made great achievements in TOD.
                                         ent objects often share similar textures, brightness, and col-   However, deep-learning-based methods usually meet the
                                         ors to the surrounding environments, making them hard to         data imbalance problem, resulting in limited generalization.
When it comes to TOD, existing methods [22] encounter           as mirror detection [25, 13], glass detection [16], and cam-
serious boundary-related imbalance problem. Specifically,       ouflaged object detection [7], showing the robustness of the
the boundary-guided methods pay too much attention to the       proposed methods. Extensive experiments on three corre-
Boundaries of Transparent objects (T-Boundaries). Thus,         sponding real-world datasets demonstrate that our FANet
they prefer to regard the background regions surrounded by      achieves state-of-the-art achievements.
Fake T-Boundaries (sharing the same characteristics with           In summary, our contributions are three-fold:
T-boundaries but belonging to background) as transparent        • We propose a novel content-dependent data augmenta-
objects. For example, the boundaries labeled by the pink          tion method, called FakeMix, for transparent object de-
rectangle in the top two rows of Fig. 1 have similar con-         tection. It balances the data distribution of boundaries
tent on their two sides. In the bottom two rows of Fig. 1,        and weakens the boundary-relate imbalance problem in
the boundaries have obvious refraction or reflection. These       TOD. In detail, we generate Fake T-Boundaries by blend-
boundaries make their surroundings falsely predicted. So          ing background with the T-Boundaries, which improve
how to distinguish T-Boundaries from Fake T-Boundaries            the model’s discrimination of the two kinds of boundaries
is key for addressing the boundary-related imbalance prob-        by scanning the appearances inside as shown in Fig. 4.
lem in TOD.
                                                                • We improved ASPP in an attention manner and propose
    To improve the generation ability of models, some
                                                                  an AdaptiveASPP to extract features adaptively in cross-
data augmentation methods have been proposed in [5, 29,
                                                                  modal and multi-scale levels. Experiments help to vali-
28]. Unfortunately, they are all content-agnostic and ig-
                                                                  date its effectiveness.
nore the boundary clues, leading to weak improvements
for boundary-related imbalance problem. In this paper,          • Without bells and whistles, our model named FANet out-
we propose a novel data augmentation method termed                performs state-of-the-art TOD methods. We further find
FakeMix. FakeMix is content-dependent and could com-              more applications in related “confusing region” detection
bat the boundary-relate imbalance problem by balancing the        tasks, i.e., mirror detection, glass detection and camou-
data distribution of boundaries. Concretely, we increase the      flaged object detection. FANet also gains state-of-the-art
proportion of Fake T-Boundaries in the training set. No-          performances.
tably, it is hard to collect Fake T-Boundaries directly from
the background without corresponding annotations. So we
design a novel and efficient method to generate Fake T-         2. Related Work
Boundaries. Based on our observation, Fake T-boundaries             Data augmentation. To improve the generation and pre-
share the following characteristic with T-boundaries: (1)       vent the models from focusing too much on some regions on
There are similar appearances on both sides and (2) There       input image, some data augmentation methods[5, 29, 28]
are obvious refraction or reflection. And the main differ-      have been proposed. As shown in Fig. 2, Mixup [29] com-
ence between the two kinds of boundaries is the appear-         bines two images by linear interpolation. Cutout [5] ran-
ances surrounded by them. Thus, we generate Fake T-             domly removes some regions of the input image. Cut-
Boundaries by blending background with the T-Boundaries.        Mix [28] randomly replaces some regions with a patch from
As the data distribution is balanced, the model’s capabil-      another image. These methods are simple and effective.
ity of discriminating Fake T-Boundaries and T-Boundaries        However, all of them are content-agnostic and ignore the
can be improved. Actually, as shown in Fig. 4, we find that     boundary clues, resulting in limited improvements for TOD.
FakeMix drives the model to explore the apprearances in-        FakeMix combats the boundary-relate imbalance problem
side, which are the key differences between the above two       by adjusting the data distribution of boundaries.
kinds of boundaries.                                                Transparent object detection. Early work [23] pro-
    Furthermore, we improved ASPP [2] in an attention           posed a model based on LF-linearity and occlusion detec-
manner [10] and obtain the AdaptiveASPP module. It in-          tion from the 4D light-field image. [1] treats transparent ob-
herits the characteristic of ASPP extracting multi-scale fea-   ject matting as the refractive flow estimation problem. Re-
tures, but more importantly, it also benefits from attention    cently, [22] proposed a large-scale dataset for TOD, which
way, dynamically enhancing cross-modality (segmentation         consists of 10428 images. Besides, they also designed
and boundary) features. The exploration indicates adopting      a boundary-aware segmentation method, named TransLab.
the multi-scale and cross-modality features dynamically is      TransLab adopts the boundary clues to improve the segmen-
effective for TOD.                                              tation of transparent regions. Our method, named FANet,
    By adopting both FakeMix and AdaptiveASPP, our              also follows the boundary-aware way. While we found hid-
FANet clearly outperforms the state-of-the-art TOD and se-      den troubles of boundary-aware methods: some boundaries,
mantic segmentation methods. Besides, we verify that our        which are similar to the boundaries of transparent objects,
method also transfers well in relevant detection tasks, such    may hurt the detection. Then we propose a novel data aug-
step 2

                                                                I2                    GB2              GBǯ2              I1
    Image 1            Mixup            CutOut
                                                        step 1                      step 1                          step 3
                                                        RB2 = GB2⊙ I2
                                                        step 2
                                                        GBǯ2 = TD(GB2)                       step 2
                                                        RBǯ2 = TD(RB2)
                                                        step 3
                                                        Iǯ1 = (1-GBǯ2)⊙ I1+RBǯ2
                                                                                     RB2                 RBǯ2           Iǯ1
    Image 2           CutMix           FakeMix
Figure 2: Comparison with other data augmentation methods and pipeline of FakeMix. Best view in color. I1 is the image
where we add the Fake T-Boundaries. I2 is the image where we extract the T-Boundaries. GB2 denotes the boundary label
of I2 . Firstly, as “step 1”, we extract the T-Boundaries from I2 , which is labeled RB2 . Secondly, we translate GB2 and RB2
                                                               0          0                          0     0
randomly to the same position as “step 2”. Then we get GB2 and RB2 . Finally, we combine GB2 , RB2 and I1 to get I1 0 as
“step 3”.

mentation method called FakeMix. Besides, rather than di-            Boundaries) but have a much smaller amount in the nat-
rectly introducing ASPP in [22], we design an AdaptiveA-             ural world. Due to this boundary-related imbalance prob-
SPP to extract features adaptively for the segmentation and          lem, the model prefers to regard the background regions
boundary branches respectively. Besides, some topics that            surrounded by Fake T-Boundaries as transparent regions.
focus on specific region detection are proposed recently,            Thus, we propose a novel content-dependent data augmen-
such as mirror detection [25], glass detection [16] and              tation methods, named FakeMix. Considering that it is hard
camouflaged object detection [7]. Considering boundary               to collect Fake T-boundaries without corresponding anno-
clues are also important for distinguish the mirror, glass           tations, we elaborately manufacture them by appending T-
and camouflaged object, these tasks might meet the simi-             Boundaries from other samples into the current image dur-
lar problem with TOD. We apply our FANet in the three                ing training. As the data distribution is balanced, the dis-
tasks above to measure the potential of our method from              crimination ability of the model between Fake T-Boundaries
more perspectives.                                                   and T-Boundaries is improved during training.
                                                                         Formally, let I ∈ RW ×H×C denotes the input image
3. Methods                                                           during training. GS represents the segmentation label. GB
                                                                     is the boundary label generated from GS as [22]. FakeMix
   Facing the challenge of Transparent Object Detection              combines the input image (I1 , GS1 , GB1 ) with Fake T-
(TOD), we propose a method named FANet, which con-                   Boundaries from another training sample (I2 , GS2 , GB2 )
tains FakeMix and AdaptiveASPP. The data augmentation                which is randomly selected. Firstly, we extract the T-
method named FakeMix is proposed to inspire the model                Boundaries from I2 as:
to exploit appearance clues, which will be introduced in
Sec. 3.1. AdaptiveASPP module is designed to capture fea-                                    RB2 = GB2       I2 ,             (1)
tures of multiple fields-of-view adaptively for the segmenta-        where denotes pixel-wise multiplication. Then we apply
tion branch and boundary branch, respectively. The details           the same affine transformation to the boundary mask GB2
will be formulated in Sec. 3.3.                                      and T-Boundaries RB2 , which translates them to a random
                                                                     location. The formulation can be written as:
3.1. FakeMix
                                                                                      0                  0
                                                                                   RB2 = TD (RB2 ), GB2 = TD (GB2 ),          (2)
   TransLab [22] proposes to exploit boundary clues to
improve transparent detection. However, we observe that              where T is the translation function. D denotes the transla-
some boundaries in the background may hurt the perfor-               tion vector:
mance, including (1) the boundaries with similar contents                                 D = (4x, 4y),                      (3)
on both sides and (2) the boundaries with obvious refrac-
                                                                     4x and 4y are uniformly sampled for every training sam-
tion or reflection. We define these boundaries as Fake
                                                                     ple according to:
T-Boundaries. Fake T-Boundaries share the same char-
acteristics with the boundary of the transparent object (T-                       4x ∼ U(−λw, λw), 4y ∼ U(−λh, λh),           (4)
1×1-1
3×3-6
Stage 1
1/4
3×3-12
Stage 2
1/8
Average
Concat
Pooling
Stage 3
3×3-18
1/16
Stage 4
Pooling
1/16
Image
a×a conv Transform Enhancement Segmentation stream
a×a-b
Backbone Boundary Segmentation Adaptive with dilation function function Boundary stream
Features Features Features ASPP rate of b
Figure 3: Overview architecture of FANet. The AdaptiveASPP modules are plugged at four stages of the backbone, which
capture features of multiple fields-of-view adaptively for the segmentation branch and boundary branch, respectively. Then
the features are integrated from bottom to top in each branch. In the segmentation branch, we follow [22] to fuse boundary
features in the attention way. In the AdaptiveASPP. The transform function generates adaptive enhancement scores for the
segmentation stream and boundary stream, respectively. Then the enhancement function enhances the features by enhance-
ment scores adaptively for the two modalities.
where w and h are the width and height of the correspond- to extract features of multiple fields-of-view for both seg-
ing image. λ is the parameter to control the range of trans- mentation branch and boundary branch.
lation. We conduct ablation studies of λ in Sec. 4.3.3. As shown in Fig. 3, our AdaptiveASPP is plugged at four
According to Eqn. (2), we get the randomly translated stages of the encoder. AdaptiveASPP extracts features for
0 0
boundary mask GB2 and T-Boundaries RB2 . Then we the segmentation and boundary branch, respectively. Let
combine them with the input training sample I1 as: Z (k,p) denotes the features extracted by AdaptiveASPP in
the p-th (p ∈ [1, 4]) stage for branch k (k ∈ {s, b}, s for
0
I1 = (1 − GB2 )
0
I1 + RB2 ,
0
(5) the segmentation branch and b for the boundary branch).
Then the features are integrated from bottom to top in each
Considering the T-Boundaries are separated away from branch. We formulate the features in the p-th stage for
0
the transparent appearances, I1 obtains more Fake T- branch k of the decoder as M (k,p) . The cross-model fea-
Boundaries. ture fusion, which is not the direction we delve, simply fol-
lows [22] to apply boundary information in attention way
Further, we consider the choice of input sample as one as:
bernoulli trial in each training iteration. The trial results in
0
one of two possible outcomes: either I1 or I1 . The proba- F(Z (s,p) + Z (s,p) Z (b,p) ),
p = 4,
bility mass function is:
M (s,p) = (7)
( F(Z (s,p) + Z (s,p) Z (b,p)
Iˆ = I,
p,
+UP(M (s,p+1) )), p ∈ [1, 4),
ˆ
P r(I) = 0 (6)
1 − p, Iˆ = I1 .
where UP(·) means the interpolation method which
ˆ GS1 , GB1 ) by the
Finally, we get the training sample (I, helps to keep the same scale between features from differ-
novel FakeMix data augmentation method. The pipeline ent stages. F(·) denotes a convolutional function. For the
boundary branch, the integration way is:
can be visualized in Fig. 2.
(
3.2. Architecture Overview (b,p) F(Z (b,p) ), p = 4,
M = (8)
F(Z (b,p) + UP(M (b,p+1) )), p ∈ [1, 4).
Following [22], ResNet50 [8] is used as the encoder and
a boundary branch is also included in the decoder to help The segmentation loss and boundary loss supervise the
detect transparent regions. An AdaptiveASPP is designed two branches separately.
3.3. AdaptiveASPP                                                4. Experiments
   To collect the information of multiple fields-of-view,        4.1. Implementation Details
[22] adopts the Atrous Spatial Pyramid Pooling module
(ASPP) [2]. However, as exposed in [14, 32], detecting               The proposed model is implemented by PyTorch [18].
boundary and region focus on different targets and pay           In the encoder, we choose ResNet50 [8] to be the backbone
attention to different characteristics. Thus we argue that       as [22]. In the decoder, the channel numbers of convolu-
richer features of multiple fields-of-view with appropriate      tional layers are set to 256. The convolution type is set to
importances in cross-modal and multi-stage levels will ex-       separable convolution [3] as [22]. The number of dilation
ploit more promotion spaces. Motivated by existing atten-        rate is set to 7 experimentally in AdaptiveASPP. And the
tion mechanism in [10], we carefully design an AdaptiveA-        decoder is randomly initialized.
SPP to capture features of multiple fields-of-view adap-             Training and Testing. During training, we train our
tively for the boundary branch and segmentation branch.          model for 400 epochs. We choose the stochastic gradient
   As shown in Fig. 3, AdaptiveASPP firstly extracts fea-        descent (SGD) optimizer. The momentum and weight de-
tures of multiple fields-of-view by convolution kernels with     cay are set to 0.9 and 0.0005 respectively. The learning rate
different dilation rates, which follows ASPP [2] and can be      is initialized to 0.01. A poly strategy with the power of 0.9
formulated as:                                                   is employed. We use 8 V100 GPUs for our experiments.
                        Y i = Fi (X),                    (9)     Batch size is 4 on every GPU. Random flip for the input
                                                                 image is also conducted during training. Following [22],
   where X means the input backbone features of Adap-            we use dice loss [4, 17, 31] for the boundary branch and
tiveASPP. Fi (·) denotes a convolutional function and the        CrossEntropy loss for the segmentation branch. Besides,
subscript i represents the i-th dilation rate setting. Let the   images are resized to 512 × 512 during training and testing
feature maps extracted by different kernels be denoted by        as [22].
{Y i |i ∈ [0, N )}, where N denotes the number of dilation
rate settings. In Fig. 3, we take N = 5 for example. Given       4.2. Datasets
{Y i |i ∈ [0, N )}, we concatenate them as Y N and conduct           We will introduce the datasets adopted in our ex-
average pooling. Then we have N -dimensional vector y N          periments. The ablation experiments are conducted on
in which y i is calculated as follows:                           Trans10K, which is a challenging Transparent Object De-
                   y i = AveP ool(Y i ).                 (10)    tection (TOD) dataset. When comparing with state-of-the-
                                                                 art, we find more applications of our methods in related top-
   Then two transform functions for the segmentation and
                                                                 ics for specific region detection: mirror detection [25], glass
boundary branch are adopted to generate adaptive impor-
                                                                 detection [16] and camouflaged object detection [7], which
tances. The formulation can be written as:
                                                                 could demonstrate the potential of our method. We keep
             skN = γ(δ(G k (y N ))), k ∈ {s, b} ,        (11)    exactly the same dataset and evaluation metrics setting with
                                                                 the original paper.
where k represents the modalities including boundary(b)
and segmentation(s). G k denotes the FC-ReLU-FC block            4.3. Ablation Study
for corresponding modality. γ(·) indicates the normaliza-
tion function which maps the scores to [0, 1]. δ(·) is the       4.3.1   Alternatives of FakeMix.
activation function. The setting follows [12] as:                We compare our FakeMix with three different kinds of pop-
                 δ(·) = max(T anh(·), 0).                (12)    ular data augmentation method, i.e., Mixup [29], Cutout [5]
                                                                 and CutMix [28] on the latest deep-learning-based TOD
   As we can see in Fig. 3, transform functions (refer to        method TransLab [22]. According to Tab. 1, our FakeMix
Eqn. (11)) generate adaptive importances for boundary and        gains the best performance in all four metrics. FakeMix is
segmentation modalities respectively. Given importance           the only method that take boundaries into consideration and
vectors skN , we adopt the enhancement function as shown         combat the boundary-related imbalance problem, leading to
in Fig. 3 to enhance the features of multiple fields-of-view     stable superiority.
Y N for the two modalities. Then we can get modality-
specific features Z kN as:                                       4.3.2   AdaptiveASPP
           Z kN = Y N × skN + Y N , k ∈ {s, b} ,         (13)
                                                                 As described in Sec. 3.3, AdaptiveASPP could enhance
In Eqn. (13), the residual connection is added to preserve       features adaptively in multiple fields-of-view and double-
the original features Y N in the enhancement function. Fol-      modality levels. Here we delve into the effectiveness and
lowing the enhancement function, a convolutional block is        details of AdaptiveASPP. Specifically, we study (1) the ef-
used to squeeze channel numbers.                                 fect of AdaptiveASPP, (2) positions to adopt AdaptiveA-
Methods Acc↑ mIoU↑ MAE↓ mBer↓
Translab 83.04 72.10 0.166 13.30
Translab+Cutout 80.36 72.27 0.160 13.37
Translab+CutMix 81.32 72.21 0.162 12.94
Translab+Mixup 77.06 72.33 0.158 14.63 Image GT Image GT
Translab+FakeMix 83.07 73.01 0.152 12.76
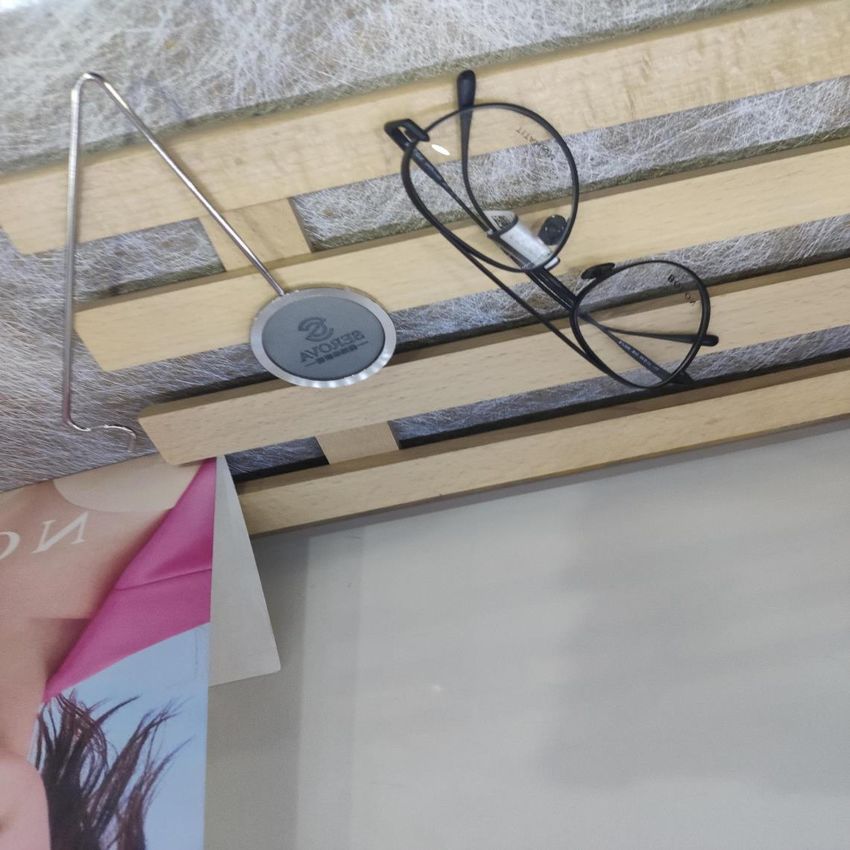
w/o FakeMix
Table 1: Comparison among different data augmentation
methods.
Methods Acc↑ mIoU↑ MAE↓ mBer↓ Feature Prediction Prediction
Feature
Convs 79.32 69.87 0.184 13.42
w/ FakeMix
ASPPs 82.17 70.56 0.170 13.74
AdaptiveASPP 85.81 76.54 0.139 10.59
Table 2: Ablation for the alternative methods of AdaptiveA-
SPP. “Convs” denotes we adopt convolutional layers to re- Feature Prediction Feature Prediction
place AdaptiveASPP. “ASPP” represents replacing Adap- Figure 4: Comparison of features w/o FakeMix and w/
tiveASPP with ASPP. FakeMix. Best view in color and zoom-in. Features and
predictions in the 2nd row labeled “w/o FakeMix” tell that
the model without utilizing FakeMix is confused by the
SPP, (3) the activation function and (4) other specific set- boundaries labeled by the pink rectangle, leading to failed
tings. Due to space constraints, the last three experiments detection labeled by the orange rectangle. Features and pre-
are presented in the supplementary materials. dictions in the 3rd row labeled “w/ FakeMix” show that the
Effectiveness of AdaptiveASPP. To explore the effect model focuses on the appearances of transparent objects,
of AdaptiveASPP, we replace the AdaptiveASPP in Fig. 3 which are the key differences between T-Boundaries and
with two convolutional layers or two ASPPs [2] to gen- Fake T-Boundaries, resulting in better prediction results la-
erate features for the segmentation branch and the bound- beled by the orange rectangle.
ary branch separately. As we can see in Tab. 2, the per-
formance elaborates on the superiority of AdaptiveASPP.
ously, which resulting in failed prediction in nearby regions.
Compared with Convs and ASPPs which treat the features
The features and predictions in the 3rd row are from FANet
with the same importance, our AdaptiveASPP enhances
trained with FakeMix. These features pay more attention
features adaptively, leading to better performances.
to transparent appearances, which are the key differences
between T-Boundaries and Fake T-Boundaries, leading to
4.3.3 Delving into FakeMix. better predictions. Research on human perception of trans-
parent objects [20] elaborates that some optical phenomena
As demonstrated in Sec. 3.1, FakeMix enhances the dis-
in transparent appearances, e.g., the refraction and reflec-
crimination ability of the model during training. Here we
tion, may bring potential clues, which might be utilized by
study the effectiveness and different settings of FakeMix.
our FANet trained with FakeMix.
Specifically, we firstly visualize (1) the features of our
model trained w/o and w/ FakeMix to observe how FakeMix Different settings. We analyze the range of transla-
works on the model. Then we conduct ablation experiments tion, namely λ in Eqn. (4). As shown in Tab. 3, different
on different settings, including (2) the range of translation, settings from the second row to the fourth row all bring
(3) the probability of adding Fake T-Boundaries, (4) the improvements compared with the one without FakeMix,
content of Fake T-Boundaries and (5) the number of Fake which validates the effectiveness and practicability of our
T-Boundaries. FakeMix. Experimentally, we set λ to 1/2. Besides, we
Look deeper into the features. To study how FakeMix study the probabilities of adding Fake T-Boundaries, i.e.,
works, we look deeper into FANet and visualize the fea- the p in Eqn. (6). Results from Tab. 4 demonstrates that us-
tures following the samilar way with [14]. In detail, the ing non-zero probability settings could boost performance.
features visualized are from the first stage of the decoder, We choose p = 1/2.
namely M s,1 in Eqn. (7) in the paper. The max function The content of Fake T-Boundaries. Furthermore, we
is applied along the channel dimension to get the visual- explore the content of Fake T-Boundaries. As shown in
ization features. In Fig. 4, features and predictions in the Tab. 5, the boundary of transparent objects can provide the
2nd row are from FANet trained without FakeMix. As we best performance. This is because the boundaries of trans-
can see, these features notice the Fake T-Boundaries obvi- parent objects have two characteristics: (1) the boundaries
Simple
          λ       Acc↑      mIoU↑      MAE↓       mBer↓
          -      85.81      76.54      0.139      10.59
          0      87.23      76.99      0.129      10.22
         1/3     86.99      76.89      0.130      10.32
                                                               Complex
         1/2     87.36      77.62      0.128       9.93
         2/3     87.14      77.54      0.129      10.20
Table 3: Ablation for the range of translation, namely λ in
Eqn. (4). “-” represents that the model is trained without
FakeMix.

          p       Acc↑      mIoU↑      MAE↓       mBer↓
          0      85.81      76.54      0.139      10.59        Occlusion
         1/3     86.93      77.60      0.126      10.03
         1/2     87.36      77.62      0.128      9.93
         2/3     86.98      77.40      0.129      10.17
Table 4: Ablation for the probability of adding Fake T-
Boundaries, namely p in Eqn. (6). “0” represents that the
model is trained without FakeMix.
                                                               Small
         RB2        Acc↑      mIoU↑      MAE↓       mBer↓
            -       85.81      76.54      0.139      10.59
          zero      86.80      76.71      0.130      10.21
         mean       86.75      77.08      0.132      10.23
        random      86.22      76.62      0.132      10.33
       boundary     87.36      77.62      0.128       9.93
Table 5: Ablation for the content of Fake T-Boundaries,
namely RB2 in Eqn. (1). “-” represents that the model is         Input       GT       Ours    TransLab DeepLabv3+ UNet
trained without FakeMix. “zero” denotes that the values of             Figure 5: Visual comparison on Trans10K [22].
Fake T-Boundaries are set to 0. “mean” denotes that the
values of Fake T-Boundaries are set to the mean value of
Trans10K. “random” represents that the values of Fake T-           The number of Fake T-Boundaries. we try different
Boundaries are set to the random region of images. “bound-     numbers of Fake T-Boundaries in FakeMix. As shown in
ary” means the values are set to the content of the boundary   Tab. 6, we found that the performances, when the number
from transparent objects as computed in Eqn. (1).              is greater than 0, become generally better than the model
                                                               trained without without FakeMix.
       Numbers      Acc↑      mIoU↑      MAE↓       mBer↓
           0        85.81     76.54      0.139      10.59      4.4. Compare with the State-of-the-art.
           1        87.12     78.00      0.127      9.96
           2        87.14     77.71      0.126      9.99           This section compares our FANet with alternative meth-
           3        87.36     77.62      0.128      9.93       ods on the large-scale transparent object detection dataset
           4        86.61     77.87      0.127      10.21      Trans10K. Besides, we apply our FANet in related confus-
Table 6: Ablation for the number of Fake T-Boundaries we       ing region detection tasks, i.e., mirror detection, glass de-
put on the input image. To gain “n” Fake T-Boundaries, we      tection and camouflaged object detection to measure the po-
repeat the progress described in Sec.3.3 of our paper “n”      tential of our method in more topics. Noted that we retrain
times.                                                         and evaluate our model respectively following the same
                                                               train/test setting with the original papers for the fair com-
                                                               parison. The comparison on mirror detection, glass detec-
with similar appearances on their two sides; (2) the bound-    tion and camouflaged object detection could be found in
aries with obvious refraction or reflection. These bound-      the supplementary materials.
aries are most likely to cause failed detection. Considering       We compare our FANet with state-of-the-art methods
choosing the boundaries of transparent objects as the con-     named TransLab [22] and main-stream semantic segmen-
tent of Fake T-Boundaries will help models to distinguish      tation methods on TOD dataset Trans10K. Tab. 7 reports
these boundaries, the “boundary” in Tab. 5 achieves better     the quantitative results of four metrics in both easy/hard
performance.                                                   set. Tab. 8 reports the quantitative results in things/stuff
IoU ↑              BER ↓              Computation
                    Method             ACC ↑       MAE ↓
                                                               Stuff Things        Stuff Things       Params/M FLOPs/G
                  ICNet [30]            52.65      0.244    47.38        53.90     29.46     19.78     8.46        10.66
                 BiSeNet [26]           77.92      0.140    70.46        77.39     17.04     10.86     13.30        19.95
                DenseASPP [24]          81.22      0.114    74.41        81.79     15.31      9.07     29.09        36.31
                   FCN [15]             83.79      0.108    74.92        84.40     13.36      7.30     34.99        42.35
                   UNet[19]             51.07      0.234    52.96        54.99     25.69     27.04     13.39       124.62
                  OCNet [27]            80.85      0.122    73.15        80.55     16.38      8.91     35.91        43.43
                  DUNet [11]            77.84      0.140    69.00        79.10     15.84     10.53     31.21       123.35
                 PSPNet [31]            86.25      0.093    78.42        86.13     12.75      6.68     50.99       187.27
                DeepLabv3+ [3]          89.54      0.081    81.16        87.90     10.25      5.31     28.74        37.98
                TransLab [22]           92.69      0.063    84.39        90.87     7.28      3.63      40.15          61.27
           TransLab [22] + FakeMix      93.14      0.057    85.62        91.91     6.68      3.28      40.15          61.27
                   FANet                94.00      0.052    87.01        92.75     6.08      2.65      35.39          77.57
               FANet + FakeMix          94.93      0.046    88.29        93.42     5.43      2.36      35.39          77.57
Table 7: Comparison between stuff set and thing set of Trans10K. Note that FLOPs is computed with one 512 × 512 image.

                                     mIoU ↑                      Acc ↑                       MAE ↓                     mBER ↓
          Method
                             Hard     Easy       All    Hard     Easy       All      Hard     Easy     All     Hard     Easy      All
       ICNet [30]            33.44   55.48      50.65   35.01    58.31     52.65     0.408    0.200   0.244    35.24     21.71   24.63
      BiSeNet [26]           56.37   78.74      73.93   62.72    82.79     77.92     0.282    0.102   0.140    24.85     10.83   13.96
     DenseASPP [24]          60.38   83.11      78.11   66.55    86.25     81.22     0.247    0.078   0.114    23.71      8.85   12.19
        FCN [15]             62.51   84.53      79.67   68.93    88.55     83.79     0.239    0.073   0.108    20.47      7.36   10.33
        UNet[19]             37.08   58.60      53.98   37.44    55.44     51.07     0.398    0.191   0.234    36.80     23.40   26.37
       OCNet [27]            59.75   81.53      76.85   65.96    85.63     80.85     0.253    0.087   0.122    23.69      9.43   12.65
       DUNet [11]            55.53   79.19      74.06   60.50    83.41     77.84     0.289    0.100   0.140    25.01      9.93   13.19
      PSPNet [31]            66.35   86.79      82.38   73.28    90.41     86.25     0.211    0.062   0.093    20.08      6.67    9.72
     DeepLabv3+ [3]          69.04   89.09      84.54   78.07    93.22     89.54     0.194    0.050   0.081    17.27      4.91    7.78
      TransLab [22]          72.10   92.23      87.63   83.04    95.77     92.69     0.166    0.036   0.063    13.30     3.12    5.46
 TransLab [22] + FakeMix     73.01   93.19      88.76   83.07    96.37     93.14     0.152    0.032   0.057    12.76     2.71    4.98
         FANet               76.54   93.77      89.88   85.81    96.62     94.00     0.139    0.029   0.052    10.59     2.43    4.37
     FANet + FakeMix         77.62   94.70      90.86   87.36    97.36     94.93     0.128    0.024   0.046     9.93     2.03    3.89
                              Table 8: Comparison between hard set and easy set of Trans10K.
set. As we can see, benefitting from our FakeMix and                 of multiple fields-of-view for segmentation and boundary
AdaptiveASPP, FANet outperform alternative methods sig-              branches adaptively, our model locates the small transpar-
nificantly. Furthermore, we compare the qualitative results          ent objects well and segments them finely.
of TOD methods. Especially, we summarize several chal-
lenging scenes in TOD: the complex scene, the scene with
occlusion, and the scene with small objects. More hard
                                                                     5. Conclusion
scenes, i.e., the scene with multi-category objects and the              In this paper, we proposed a novel content-dependent
scene with unnoticeable objects, are shown in the supple-            data augmentation method termed FakeMix. FakeMix
mentary materials. As shown in Fig. 5, the 1st row shows a           weakens the boundary-related imbalance problem in the
simple example in which most methods perform well. In the            natural word and strengthens the discrimination ability of
2nd-3rd rows, we sample some images in which the scenes              the model for Fake T-Boundaries and T-Boundaries. Be-
are complex. The scenes with occlusion are shown in the              sides, we design an AdaptiveASPP module to capture fea-
4th-5th rows. As we can see, in complex and occlusion                tures of multiple fields-of-view adaptively for the segmen-
scenes, our model avoids bad influences of the boundaries            tation and boundary branches, respectively. Benefiting from
from non-transparent regions and gain more complete re-              FakeMix and AdaptiveASPP, our FANet surpasses state-of-
sults with better details, benefiting from our FakeMix. Then         the-art TOD methods significantly. Further, FANet also
we show other challenging situations in which the transpar-          gains state-of-the-art performance in related confusing re-
ent objects are small. As we can see in the last three rows of       gion detection tasks, i.e., mirror detection, glass detection
Fig. 5, considering AdaptiveASPP could capture features              and camouflaged object detection.
References                                                           network for retinal vessel segmentation. Knowledge-
                                                                     Based Systems, 178:149–162, 2019. 8
 [1] Guanying Chen, Kai Han, and Kwan-Yee K Wong.
     Tom-net: Learning transparent object matting from a        [12] Yanwei Li, Lin Song, Yukang Chen, Zeming Li, Xi-
     single image. In Proceedings of the IEEE Conference             angyu Zhang, Xingang Wang, and Jian Sun. Learn-
     on Computer Vision and Pattern Recognition, pages               ing dynamic routing for semantic segmentation. In
     9233–9241, 2018. 1, 2                                           Proceedings of the IEEE/CVF Conference on Com-
                                                                     puter Vision and Pattern Recognition, pages 8553–
 [2] Liang-Chieh Chen, George Papandreou, Florian
                                                                     8562, 2020. 5
     Schroff, and Hartwig Adam. Rethinking atrous con-
     volution for semantic image segmentation. arXiv            [13] Jiaying Lin, Guodong Wang, and Rynson WH Lau.
     preprint arXiv:1706.05587, 2017. 2, 5, 6                        Progressive mirror detection. In Proceedings of the
 [3] Liang-Chieh Chen, Yukun Zhu, George Papandreou,                 IEEE/CVF Conference on Computer Vision and Pat-
     Florian Schroff, and Hartwig Adam. Encoder-decoder              tern Recognition, pages 3697–3705, 2020. 2
     with atrous separable convolution for semantic image       [14] Jiang-Jiang Liu, Qibin Hou, and Ming-Ming Cheng.
     segmentation. In Proceedings of the European con-               Dynamic feature integration for simultaneous detec-
     ference on computer vision (ECCV), pages 801–818,               tion of salient object, edge and skeleton. arXiv
     2018. 5, 8                                                      preprint arXiv:2004.08595, 2020. 5, 6
 [4] Ruoxi Deng, Chunhua Shen, Shengjun Liu, Huibing            [15] Jonathan Long, Evan Shelhamer, and Trevor Darrell.
     Wang, and Xinru Liu. Learning to predict crisp bound-           Fully convolutional networks for semantic segmen-
     aries. In Proceedings of the European Conference on             tation. In Proceedings of the IEEE conference on
     Computer Vision (ECCV), pages 562–578, 2018. 5                  computer vision and pattern recognition, pages 3431–
 [5] Terrance DeVries and Graham W Taylor. Improved                  3440, 2015. 1, 8
     regularization of convolutional neural networks with       [16] Haiyang Mei, Xin Yang, Yang Wang, Yuanyuan Liu,
     cutout. arXiv preprint arXiv:1708.04552, 2017. 2, 5             Shengfeng He, Qiang Zhang, Xiaopeng Wei, and Ryn-
 [6] Deng-Ping Fan, Ming-Ming Cheng, Jiang-Jiang Liu,                son WH Lau. Don’t hit me! glass detection in real-
     Shang-Hua Gao, Qibin Hou, and Ali Borji. Salient                world scenes. In Proceedings of the IEEE/CVF Con-
     objects in clutter: Bringing salient object detection to        ference on Computer Vision and Pattern Recognition,
     the foreground. In Proceedings of the European con-             pages 3687–3696, 2020. 2, 3, 5
     ference on computer vision (ECCV), pages 186–202,          [17] Fausto Milletari, Nassir Navab, and Seyed-Ahmad
     2018. 1                                                         Ahmadi. V-net: Fully convolutional neural networks
 [7] Deng-Ping Fan, Ge-Peng Ji, Guolei Sun, Ming-Ming                for volumetric medical image segmentation. In 2016
     Cheng, Jianbing Shen, and Ling Shao. Camouflaged                fourth international conference on 3D vision (3DV),
     object detection. In Proceedings of the IEEE/CVF                pages 565–571. IEEE, 2016. 5
     Conference on Computer Vision and Pattern Recog-
                                                                [18] Adam Paszke, Sam Gross, Soumith Chintala, Gregory
     nition, pages 2777–2787, 2020. 2, 3, 5
                                                                     Chanan, Edward Yang, Zachary DeVito, Zeming Lin,
 [8] Kaiming He, Xiangyu Zhang, Shaoqing Ren, and Jian               Alban Desmaison, Luca Antiga, and Adam Lerer. Au-
     Sun. Deep residual learning for image recognition.              tomatic differentiation in pytorch. 2017. 5
     In Proceedings of the IEEE conference on computer
     vision and pattern recognition, pages 770–778, 2016.       [19] Olaf Ronneberger, Philipp Fischer, and Thomas Brox.
     4, 5                                                            U-net: Convolutional networks for biomedical image
                                                                     segmentation. In International Conference on Medical
 [9] Qibin Hou, Ming-Ming Cheng, Xiaowei Hu, Ali
                                                                     image computing and computer-assisted intervention,
     Borji, Zhuowen Tu, and Philip HS Torr. Deeply su-
                                                                     pages 234–241. Springer, 2015. 8
     pervised salient object detection with short connec-
     tions. In Proceedings of the IEEE Conference on Com-       [20] Nick Schlüter and Franz Faul. Visual shape perception
     puter Vision and Pattern Recognition, pages 3203–               in the case of transparent objects. Journal of vision,
     3212, 2017. 1                                                   19(4):24–24, 2019. 6
[10] Jie Hu, Li Shen, and Gang Sun. Squeeze-and-                [21] Nathan Silberman, Derek Hoiem, Pushmeet Kohli,
     excitation networks. In Proceedings of the IEEE con-            and Rob Fergus. Indoor segmentation and support in-
     ference on computer vision and pattern recognition,             ference from rgbd images. In European conference on
     pages 7132–7141, 2018. 2, 5                                     computer vision, pages 746–760. Springer, 2012. 1
[11] Qiangguo Jin, Zhaopeng Meng, Tuan D Pham, Qi               [22] Enze Xie, Wenjia Wang, Wenhai Wang, Mingyu Ding,
     Chen, Leyi Wei, and Ran Su. Dunet: A deformable                 Chunhua Shen, and Ping Luo. Segmenting transparent
objects in the wild. arXiv preprint arXiv:2003.13948,     References
     2020. 1, 2, 3, 4, 5, 7, 8
                                                                [1] Guanying Chen, Kai Han, and Kwan-Yee K Wong.
[23] Yichao Xu, Hajime Nagahara, Atsushi Shimada, and               Tom-net: Learning transparent object matting from a
     Rin-ichiro Taniguchi. Transcut: Transparent object             single image. In Proceedings of the IEEE Conference
     segmentation from a light-field image. In Proceedings          on Computer Vision and Pattern Recognition, pages
     of the IEEE International Conference on Computer Vi-           9233–9241, 2018. 1, 2
     sion, pages 3442–3450, 2015. 1, 2                          [2] Liang-Chieh Chen, George Papandreou, Florian
[24] Maoke Yang, Kun Yu, Chi Zhang, Zhiwei Li, and                  Schroff, and Hartwig Adam. Rethinking atrous con-
     Kuiyuan Yang. Denseaspp for semantic segmentation              volution for semantic image segmentation. arXiv
     in street scenes. In Proceedings of the IEEE Con-              preprint arXiv:1706.05587, 2017. 2, 5, 6
     ference on Computer Vision and Pattern Recognition,        [3] Liang-Chieh Chen, Yukun Zhu, George Papandreou,
     pages 3684–3692, 2018. 8                                       Florian Schroff, and Hartwig Adam. Encoder-decoder
[25] Xin Yang, Haiyang Mei, Ke Xu, Xiaopeng Wei, Bao-               with atrous separable convolution for semantic image
     cai Yin, and Rynson WH Lau. Where is my mirror?                segmentation. In Proceedings of the European con-
     In Proceedings of the IEEE International Conference            ference on computer vision (ECCV), pages 801–818,
     on Computer Vision, pages 8809–8818, 2019. 2, 3, 5             2018. 5, 8
                                                                [4] Ruoxi Deng, Chunhua Shen, Shengjun Liu, Huibing
[26] Changqian Yu, Jingbo Wang, Chao Peng, Changxin                 Wang, and Xinru Liu. Learning to predict crisp bound-
     Gao, Gang Yu, and Nong Sang. Bisenet: Bilateral                aries. In Proceedings of the European Conference on
     segmentation network for real-time semantic segmen-            Computer Vision (ECCV), pages 562–578, 2018. 5
     tation. In Proceedings of the European conference on
                                                                [5] Terrance DeVries and Graham W Taylor. Improved
     computer vision (ECCV), pages 325–341, 2018. 8
                                                                    regularization of convolutional neural networks with
[27] Yuhui Yuan and Jingdong Wang. Ocnet: Object                    cutout. arXiv preprint arXiv:1708.04552, 2017. 2, 5
     context network for scene parsing. arXiv preprint          [6] Deng-Ping Fan, Ming-Ming Cheng, Jiang-Jiang Liu,
     arXiv:1809.00916, 2018. 8                                      Shang-Hua Gao, Qibin Hou, and Ali Borji. Salient
[28] Sangdoo Yun, Dongyoon Han, Seong Joon Oh,                      objects in clutter: Bringing salient object detection to
     Sanghyuk Chun, Junsuk Choe, and Youngjoon Yoo.                 the foreground. In Proceedings of the European con-
     Cutmix: Regularization strategy to train strong classi-        ference on computer vision (ECCV), pages 186–202,
     fiers with localizable features. In Proceedings of the         2018. 1
     IEEE/CVF International Conference on Computer Vi-          [7] Deng-Ping Fan, Ge-Peng Ji, Guolei Sun, Ming-Ming
     sion, pages 6023–6032, 2019. 2, 5                              Cheng, Jianbing Shen, and Ling Shao. Camouflaged
                                                                    object detection. In Proceedings of the IEEE/CVF
[29] Hongyi Zhang, Moustapha Cisse, Yann N Dauphin,
                                                                    Conference on Computer Vision and Pattern Recog-
     and David Lopez-Paz. mixup: Beyond empirical
                                                                    nition, pages 2777–2787, 2020. 2, 3, 5
     risk minimization. arXiv preprint arXiv:1710.09412,
     2017. 2, 5                                                 [8] Kaiming He, Xiangyu Zhang, Shaoqing Ren, and Jian
                                                                    Sun. Deep residual learning for image recognition.
[30] Hengshuang Zhao, Xiaojuan Qi, Xiaoyong Shen, Jian-             In Proceedings of the IEEE conference on computer
     ping Shi, and Jiaya Jia. Icnet for real-time semantic          vision and pattern recognition, pages 770–778, 2016.
     segmentation on high-resolution images. In Proceed-            4, 5
     ings of the European Conference on Computer Vision
                                                                [9] Qibin Hou, Ming-Ming Cheng, Xiaowei Hu, Ali
     (ECCV), pages 405–420, 2018. 8
                                                                    Borji, Zhuowen Tu, and Philip HS Torr. Deeply su-
[31] Hengshuang Zhao, Jianping Shi, Xiaojuan Qi, Xiao-              pervised salient object detection with short connec-
     gang Wang, and Jiaya Jia. Pyramid scene parsing                tions. In Proceedings of the IEEE Conference on Com-
     network. In Proceedings of the IEEE conference on              puter Vision and Pattern Recognition, pages 3203–
     computer vision and pattern recognition, pages 2881–           3212, 2017. 1
     2890, 2017. 5, 8                                          [10] Jie Hu, Li Shen, and Gang Sun. Squeeze-and-
[32] Jia-Xing Zhao, Jiang-Jiang Liu, Deng-Ping Fan, Yang            excitation networks. In Proceedings of the IEEE con-
     Cao, Jufeng Yang, and Ming-Ming Cheng. Egnet:                  ference on computer vision and pattern recognition,
     Edge guidance network for salient object detection. In         pages 7132–7141, 2018. 2, 5
     Proceedings of the IEEE International Conference on       [11] Qiangguo Jin, Zhaopeng Meng, Tuan D Pham, Qi
     Computer Vision, pages 8779–8788, 2019. 5                      Chen, Leyi Wei, and Ran Su. Dunet: A deformable
network for retinal vessel segmentation. Knowledge- objects in the wild. arXiv preprint arXiv:2003.13948,
Based Systems, 178:149–162, 2019. 8 2020. 1, 2, 3, 4, 5, 7, 8
[12] Yanwei Li, Lin Song, Yukang Chen, Zeming Li, Xi- [23] Yichao Xu, Hajime Nagahara, Atsushi Shimada, and
angyu Zhang, Xingang Wang, and Jian Sun. Learn- Rin-ichiro Taniguchi. Transcut: Transparent object
ing dynamic routing for semantic segmentation. In segmentation from a light-field image. In Proceedings
Proceedings of the IEEE/CVF Conference on Com- of the IEEE International Conference on Computer Vi-
puter Vision and Pattern Recognition, pages 8553– sion, pages 3442–3450, 2015. 1, 2
8562, 2020. 5 [24] Maoke Yang, Kun Yu, Chi Zhang, Zhiwei Li, and
[13] Jiaying Lin, Guodong Wang, and Rynson WH Lau. Kuiyuan Yang. Denseaspp for semantic segmentation
Progressive mirror detection. In Proceedings of the in street scenes. In Proceedings of the IEEE Con-
IEEE/CVF Conference on Computer Vision and Pat- ference on Computer Vision and Pattern Recognition,
tern Recognition, pages 3697–3705, 2020. 2 pages 3684–3692, 2018. 8
[14] Jiang-Jiang Liu, Qibin Hou, and Ming-Ming Cheng. [25] Xin Yang, Haiyang Mei, Ke Xu, Xiaopeng Wei, Bao-
Dynamic feature integration for simultaneous detec- cai Yin, and Rynson WH Lau. Where is my mirror?
tion of salient object, edge and skeleton. arXiv In Proceedings of the IEEE International Conference
preprint arXiv:2004.08595, 2020. 5, 6 on Computer Vision, pages 8809–8818, 2019. 2, 3, 5
[15] Jonathan Long, Evan Shelhamer, and Trevor Darrell. [26] Changqian Yu, Jingbo Wang, Chao Peng, Changxin
Fully convolutional networks for semantic segmen- Gao, Gang Yu, and Nong Sang. Bisenet: Bilateral
tation. In Proceedings of the IEEE conference on segmentation network for real-time semantic segmen-
computer vision and pattern recognition, pages 3431– tation. In Proceedings of the European conference on
3440, 2015. 1, 8 computer vision (ECCV), pages 325–341, 2018. 8
[16] Haiyang Mei, Xin Yang, Yang Wang, Yuanyuan Liu, [27] Yuhui Yuan and Jingdong Wang. Ocnet: Object
Shengfeng He, Qiang Zhang, Xiaopeng Wei, and Ryn- context network for scene parsing. arXiv preprint
son WH Lau. Don’t hit me! glass detection in real- arXiv:1809.00916, 2018. 8
world scenes. In Proceedings of the IEEE/CVF Con- [28] Sangdoo Yun, Dongyoon Han, Seong Joon Oh,
ference on Computer Vision and Pattern Recognition, Sanghyuk Chun, Junsuk Choe, and Youngjoon Yoo.
pages 3687–3696, 2020. 2, 3, 5 Cutmix: Regularization strategy to train strong classi-
fiers with localizable features. In Proceedings of the
[17] Fausto Milletari, Nassir Navab, and Seyed-Ahmad
IEEE/CVF International Conference on Computer Vi-
Ahmadi. V-net: Fully convolutional neural networks
sion, pages 6023–6032, 2019. 2, 5
for volumetric medical image segmentation. In 2016
fourth international conference on 3D vision (3DV), [29] Hongyi Zhang, Moustapha Cisse, Yann N Dauphin,
pages 565–571. IEEE, 2016. 5 and David Lopez-Paz. mixup: Beyond empirical
risk minimization. arXiv preprint arXiv:1710.09412,
[18] Adam Paszke, Sam Gross, Soumith Chintala, Gregory
2017. 2, 5
Chanan, Edward Yang, Zachary DeVito, Zeming Lin,
Alban Desmaison, Luca Antiga, and Adam Lerer. Au- [30] Hengshuang Zhao, Xiaojuan Qi, Xiaoyong Shen, Jian-
tomatic differentiation in pytorch. 2017. 5 ping Shi, and Jiaya Jia. Icnet for real-time semantic
segmentation on high-resolution images. In Proceed-
[19] Olaf Ronneberger, Philipp Fischer, and Thomas Brox. ings of the European Conference on Computer Vision
U-net: Convolutional networks for biomedical image (ECCV), pages 405–420, 2018. 8
segmentation. In International Conference on Medical
image computing and computer-assisted intervention, [31] Hengshuang Zhao, Jianping Shi, Xiaojuan Qi, Xiao-
pages 234–241. Springer, 2015. 8 gang Wang, and Jiaya Jia. Pyramid scene parsing
network. In Proceedings of the IEEE conference on
[20] Nick Schlüter and Franz Faul. Visual shape perception computer vision and pattern recognition, pages 2881–
in the case of transparent objects. Journal of vision, 2890, 2017. 5, 8
19(4):24–24, 2019. 6
[32] Jia-Xing Zhao, Jiang-Jiang Liu, Deng-Ping Fan, Yang
[21] Nathan Silberman, Derek Hoiem, Pushmeet Kohli, Cao, Jufeng Yang, and Ming-Ming Cheng. Egnet:
and Rob Fergus. Indoor segmentation and support in- Edge guidance network for salient object detection. In
ference from rgbd images. In European conference on Proceedings of the IEEE International Conference on
computer vision, pages 746–760. Springer, 2012. 1 Computer Vision, pages 8779–8788, 2019. 5
[22] Enze Xie, Wenjia Wang, Wenhai Wang, Mingyu Ding,
Chunhua Shen, and Ping Luo. Segmenting transparentYou can also read