Creating Summaries from User Videos
←
→
Page content transcription
If your browser does not render page correctly, please read the page content below

Creating Summaries from User Videos

 Michael Gygli1,2 , Helmut Grabner1,2 , Hayko Riemenschneider1 , and Luc Van
                                   Gool1,3
             1
                  Computer Vision Laboratory, ETH Zurich, Switzerland
                         2
                           upicto GmbH, Zurich, Switzerland
                               3
                                 K.U. Leuven, Belgium
                 {gygli,grabner,hayko,vangool}@vision.ee.ethz.ch

      Abstract. This paper proposes a novel approach and a new benchmark
      for video summarization. Thereby we focus on user videos, which are raw
      videos containing a set of interesting events. Our method starts by seg-
      menting the video by using a novel “superframe” segmentation, tailored
      to raw videos. Then, we estimate visual interestingness per superframe
      using a set of low-, mid- and high-level features. Based on this scoring,
      we select an optimal subset of superframes to create an informative and
      interesting summary. The introduced benchmark comes with multiple
      human created summaries, which were acquired in a controlled psycho-
      logical experiment. This data paves the way to evaluate summarization
      methods objectively and to get new insights in video summarization.
      When evaluating our method, we find that it generates high-quality re-
      sults, comparable to manual, human-created summaries.

Keywords: Video analysis, video summarization, temporal segmentation

1   Introduction
With the omnipresence of mobile phones and other consumer oriented camera
devices, more and more video data is captured and stored. To find and access rel-
evant videos then quickly becomes a challenge. Moreover, the easier and cheaper
video acquisition becomes, the more casual and sloppy the average quality typ-
ically gets. The automated production of good video summaries, that capture
the important information and are nice to watch, can mitigate both issues.
    One way of coping with the search challenge is visual indexing, where keyframes
are selected such that they best summarize the video [28, 5, 1, 13, 18, 15, 16].
Keyframes are typically extracted using change detection [5] or clustering based
on low-level features [1] or objects [18]. Others resort to web priors to find im-
portant frames within a video [15, 16, 20]. While keyframes are a helpful way of
indexing videos, they are limited in that all motion information is lost. That lim-
its their use for certain retrieval tasks (e.g. when looking for a nice panning shot
from the top of the Eiffel tower), but renders them even less useful for improving
the viewing experience. Therefore, video skimming, i.e. replacing the video by a
shorter compilation of its fragments, seems better suited for such goals. This is
2                 Michael Gygli, Helmut Grabner, Hayko Riemenschneider, Luc Van Gool

                                                                                       Raw User
Input

                                                                                        Video
                  Superframe segmentation                   Interest prediction
Our approach

                                                                                       Summary
                Select
                  &
               Combine

Fig. 1: Overview of our approach. First, we segment the video into superframes
(cuttable segments). Then, we predict the interestingness (using low-level features and
face/person, landmark detectors and motion features) for each superframe. From these,
we select an optimal subset.

however a challenging task, especially for user videos, as they are unstructured,
range over a wide variety of content and what is important often depends on a
semantic interpretation.
    Early work on the summarization of edited videos, such as tv news, is by
Smith and Kanade [26], who detect camera motion, shot boundaries and faces,
among other things, to create an automatic summary. Liu et al. [21] proposed
a framework to summarize BBC rushes based on low-level cues, that clusters
frames and uses image saliency and the visual differences between frames to
score them. Ejaz et al. [5] follow a very similar approach to score frames, but
use a non-linear fusion scheme. Several approaches target video summarization
on a semantic level [22, 19, 18, 9], but as the reliable detection of high-level in-
formation, such as objects, is still an open research problem, many of them take
user annotations (e.g. object bounding boxes) as input [19, 22, 9].
    Probably the most related work to ours are the recent works done at UT
Austin [18, 22]. They summarize long, raw, egocentric videos into keyframes [18]
or skims [22], using an object-centered approach. In order to find important
objects in a video, [18] uses object segmentations and a set of object-centered
features, while [22] analyzes how objects link a set of events in a story. The
usefulness of their approach was confirmed in a human study, were subjects
were asked to compare the proposed summaries to several baselines.
    In contrast to [18, 22] we introduce a more generic algorithm that summarizes
any type of video (static, egocentric or moving), while taking into account cine-
matographic rules. Thereby we focus on user videos, which we define as unedited
video data, that was taken with a purpose. Such video data often contains a set
of interesting events, but is raw and therefore often long, redundant and contains
parts of bad quality. Our goal is therefore different from [18, 22], who summarize
video from wearable cameras, which often run for hours. Since user videos con-
Creating Summaries from User Videos       3

tain a wide range of content, solely relying on object-centric features, as in [18],
is insufficient in our case. Therefore we propose new features better suited for
the task of summarizing user videos.
    Rather than manually evaluating the produced summaries, as [18, 22], we
introduce a new benchmark of user videos ranging over different categories. We
evaluate our method using multiple ‘ground truth’ summaries per video, which
we acquired in a study in collaboration with perception psychologists. This data
allows to assess the performance of any summarization algorithm in a fast and
repeatable manner.
We make the following contributions:
  i) Superframes. A novel approach for motion-based video over-segmentation
     using insights from editing theory (Sec. 3). As these superfames have their
     boundaries aligned with positions appropriate for a cut, they create an aes-
     thetic summary when combined.
 ii) Summarization of user videos. A new method to estimate the inter-
     estingness of superframes and selecting a summary from them using a 0/1-
     knapsack optimization. With this formulation the interestingness contained
     in the final summary is maximized, while remaining within a desired time
     budget (Sec. 5).
iii) The SumMe benchmark. A new, publicly available dataset of user videos
     that allows for an objective and repeatable evaluation of video summariza-
     tion methods. To the best of our knowledge, it is the first that is annotated
     with human scores for video segments rather than keyframes and that allows
     for an automatic evaluation of different methods4 (Sec. 6).

2     Overview
An overview of our approach to create an automatic summary is shown in Fig. 1.
We start by over-segmenting a video V into superframes S (Sec. 3). Superframes
are sets of consecutive frames where start and end are aligned with positions of
a video that are appropriate for a cut. Therefore, an arbitrary order-preserving
subset can be selected from them to create an automatic summary. Inspired by a
recent work on human interest in images [11], we then predict an interestingness
score I(Sj ) for each superframe (Sec. 4). For this purpose, we use a combination
of low-level image features, motion features, as well as face/person and landmark
detectors. Finally, we select an optimal subset of S, such that the interestingness
in the final summary is maximized (Sec. 5).

3     Superframe Segmentation
Traditional video summarization methods are focused on edited videos, such as
news stories, sport broadcasts or movies. As these videos are edited, they consist
4
    Dataset and evaluation code are available on:
      www.vision.ee.ethz.ch/~gyglim/vsum/
4       Michael Gygli, Helmut Grabner, Hayko Riemenschneider, Luc Van Gool

Fig. 2: Superframe segmentation illustration. Superframes are initialized with a
uniform length and then iteratively adapted to the motion. This leads to segments
which have boundaries with less motion and often enclose a distinct event.

of a set of short shots. In order to segment such a video, it is sufficient to use
shot detection, e.g. based on changes in the color histogram [26]. As we focus
on largely unedited user videos, which often only contain one single shot, such
an approach cannot be used in our case. This problem was also targeted earlier
by [22], who proposed to classify frames from egocentric videos into static, in
transit or head movement, in order to segment a video into shots. This method
is however only applicable for egocentric videos and leads to shots of about 15
seconds, which is much longer than what people typically choose to summarize a
video (see Fig. 3). A more general option would be to cut the video into segments
of fixed length, but such arbitrarily cut shots would not correspond to logical
units of the videos. In addition, this would lead to disrupting cuts, as humans
are irritated by abrupt motion changes caused by cuts [24, p. 161].
    As a remedy, editing guidelines propose to cut when there is no motion (or
else, the motion speed and direction of two neighboring shots is matched) [24, p.
158-161]. We design a subshot segmentation that incorporates this idea. We term
these segments superframes, in analogy to superpixels, and propose an approach
inspired by recent work in image segmentation [2].
    We define an energy function E(Sj ) that is a measure of quality of a super-
frame Sj as
                                        1
                        E(Sj ) =                  · Pl (|Sj |),                (1)
                                  1 + γCcut (Sj )
where Ccut is the cut cost and Pl is a length prior for the superframes. |·| denotes
the length of a superframe. The parameter γ controls the influence between the
cut cost and the length prior, where a lower γ leads to more uniform superframes.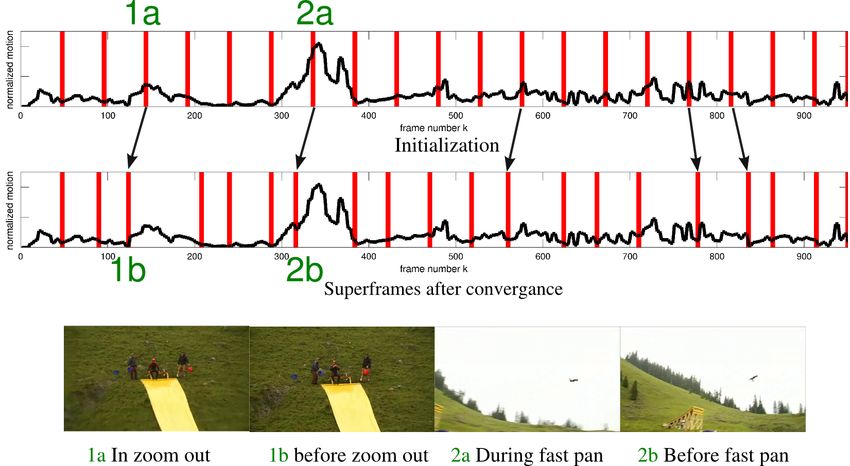
Creating Summaries from User Videos           5

The cut cost is defined as
                            Ccut (Sj ) = min (Sj ) + mout (Sj )                      (2)
where min (Sj ) and mout (Sj ) are the estimated motion magnitude in the first and
last frame of the superframe. We compute min (Sj ) and mout (Sj ) by taking the
mean magnitude of the translation, which we estimate by tracking points in the
video using KLT. This cost is lower for superframes that have their boundaries
aligned with frames containing little or no motion.
     The length prior Pl is learnt by
fitting a log-normal distribution to a                 Segment length prior
                                             0.02
histogram of segment lengths of the                      Empirical Distribution
human created summary selections                         Fitted log−normal distribution
                                            0.015
(cf. Sec. 6). In Fig. 3 we show the

                                             Pl (|Sj |)
prior learnt on the complete dataset.        0.01

The prior serves as a regularization
                                            0.005
of the superframes, similar to the
shape term in [2].                              0
     We optimize the energy of Eq. (1)           0   5    10          15      20       25
                                                                |Sj |
locally by hill-climbing optimiza- Fig. 3: Distribution of segment lengths.
tion. First, the superframes are We show the distribution of segment lengths
initialized evenly distributed over as selected by the study subjects and the
the video/shot, using the segment fitted log-normal distribution. On the whole
length |Sj | = arg max(Pl ). Then, dataset we find arg max    l
                                                                  (Pl ) = 1.85.
                        l
we iteratively update the boundaries
between two superframes to opti-
mize Eq. (1), which leads to segments that have their boundaries aligned to
positions suitable for a cut. This optimization is done in a coarse to fine manner,
where a boundary movement by δ frames is proposed. The movement is ac-
cepted, if it increases the mean score of Eq. (1), of the two affected superframes.
We start from an initial δ and iteratively update until the algorithm converges.
Then, δ is decreased by one frame and the optimization is re-executed. Fig. 2
illustrates this process. As this optimization is local, only a few iterations are
needed until it converges (typically less than 10).

4    Per-frame Interestingness
We compute an interestingness score ik for each frame vk , as a weighted sum of
features that have been found to be related to interestingness [11, 18]. Thereby we
combine low-level information, such as the aesthetic quality (contrast, etc.) and
spatio-temperal saliency, with high-level features such as, motion classification
and person and landmark detection.
    Attention. We use the approach of [5] to predict a human attention score
based on spatial [12] and temporal saliency (temporal gradients). As [5] we com-
bine the scores with a non-linear fusion scheme and take the attention score as
a single feature in our approach.
6      Michael Gygli, Helmut Grabner, Hayko Riemenschneider, Luc Van Gool

    Aesthetics/Quality. To predict the aesthetic quality of a frame we compute
colorfulness [3], contrast [14] and the distribution of edges [14].
    Presence of landmarks. Landmarks are often of high interest [11]. This
is particularly true in holiday videos and has already been exploited in [20]
to predict the interestingness of video frames. We follow this idea and use the
framework of [8] to classify the scene in a frame as famous or non-famous, based
on the presence of famous buildings.
    Faces/Persons. As previous works [26, 18], we detect prominent faces or
persons in a frame and use them as features for summarization. We detect faces
using the algorithm of [27] and persons using [6]. Given a detection, we take the
relative area of the bounding box w.r.t. to the frame size as a feature score.
    Follow object. Similar to [18] we observe that moving cameras contain
implicit information on an objects/events interestingness. A typical pattern in
user videos is that an object of interest is tracked by the camera (the movie
makers keep it roughly in the center of the video). In order to classify such a
motion pattern, we build on recent work in motion segmentation. We separate
a set of sparse motion tracks into segments using [4]. Thereby the number of
motion segments is automatically determined. From a given segmentation, we
find the foreground segment by assuming that it is approximately
                                                            P       centered in the
frame and spatially compact. Specifically, we take arg min k(µoi −c)σoi k as the
                                                                 O
foreground segment, where O is the set of motion segments and the sum is taken
over the set of frames a segment is visible. µoi and σoi are the mean and standard
deviation of the x- and y-coordinates of the points in segment oi and c is the
center point of the frame. The background is taken to be the largest remaining
motion segment. Given this separation, we estimate a translational motion model
for foreground and background. We annotated a set of videos containing 32
follow object motion patterns and computed background and foreground motion
magnitude mb , mf . From these, we use kernel density estimation over vectors x =
[mb , mb − mf ] in order to estimate P (x|y = follow object), P (y = follow object)
and P (x). Using Bayes theorem we compute then P (y = follow object|x) and
use this probability as a feature.

Combination of features. We combine the above features with a linear model,
where we regress the weights w. A frame vk has an interestingness score ik
                               N
                               X                 N X
                                                 X N
                   ik = w0 +         wi · ui +               wi,j · ui uj ,    (3)
                               i=1               i=1 j=i+1

where ui is the score of feature i. We use unary and pairwise terms as [18], since
such a model is able to capture interactions between features, while it remains
sufficiently simple to avoid overfitting and allows for fast training.
    We estimate w using least-squares and the annotated dataset from Sec. 6.
As training ground truth we use a score computed by taking the fraction of
selections over views for each frame (examples of such scores are shown in of
Fig. 7 as ’human selection’). We randomly sample 100 frames from each training
Creating Summaries from User Videos         7

video and concatenate them. This way, all videos have the same importance in
the learning process. As we randomly sample frames, we repeat this process 50
times and average the resulting weight vectors.
    The interestingness score of a superframe Si is simply a sum over the inter-
estingness of its frames:
                                          Xm
                                 I(Si ) =    ik ,                            (4)
                                                 k=n
where n and m are start and end frame of superframe Si . We also tried other
scoring methods, such as taking the maximum or including cluster size, but
found this simple sum to work best.

5     Selecting an Optimal Summary
Given the set of superframes S, we want to find a subset with a length be-
low a specified maximum Ls , such that the sum of the interestingness scores is
maximized. Formally, we want to solve the following optimization problem:
                                           n
                                           X
                              maximize           xi I(Si )
                                   x
                                           i=1
                                            n
                                                                                 (5)
                                           X
                              subject to         xi |Si | ≤ Ls ,
                                           i=1

where xi ∈ {0, 1} and xi = 1 indicates that a superframe is selected. Under
the assumption of independence between the scores I(Si ), this maximization is
a standard 0/1-knapsack problem, where I(Si ) is the value of an item and its
length |Si | its weight. This problem can be solved globally optimal with dynamic
programming in pseudo-polynomial time O(nLs ) [10], with n = |S|.
    In this optimization, we do not explicitly account for the possibility that
superframes contain redundant information. We also ran experiments where we
clustered the superframes beforehand and used an uncorrelated subset of su-
perframes in the optimization to explicitly enforce diversity for the final sum-
mary. This however led to no significant improvement, suggesting that study par-
ticipants choose interesting over representative parts. Furthermore user videos
rarely contain multiple interesting, but redundant events (i.e. from our experi-
ence it is not necessary to explicitly filter out duplicates).

6     The SumMe Benchmark
We introduce a benchmark that allows for the automatic evaluation of video
summarization methods. Previous approaches generated video summaries and
then let humans assess their quality, in one of the following ways:
    i) Based on a set of predefined criteria [25]. The criteria may range from count-
       ing the inclusion of predefined important content, the degree of redundancy,
       summary duration, etc.
8           Michael Gygli, Helmut Grabner, Hayko Riemenschneider, Luc Van Gool

Table 1: The videos in the SumMe dataset. We show consistency and the distribution
of segment lengths for each video. The analysis of the consistency (Sec. 6.2) shows that
there are certain individual differences but humans still generally agree on what parts
of a video are interesting.
                                                       # of Summary            Segments      human consistency
    Name                      Camera            Length subj. length [%]   avg. # avg. length f-measure Cronb. α
    Base jumping              egocentric        2m39s   18    13.8±2.0    5.7±2.2   4.5s       0.26     0.77
    Bike Polo                 egocentric        1m43s   15    12.3±3.4    3.9±1.4   3.8s       0.32     0.83
    Scuba                     egocentric        1m14s   17    13.2±2.0    3.5±1.3   3.4s       0.22     0.70
    Valparaiso Downhill       egocentric        2m53s   15    13.6±1.9    7.7±4.0   4.2s       0.27     0.80
    Bearpark climbing         moving            2m14s   15    14.4±1.0    5.1±2.2   4.7s       0.21     0.61
    Bus in Rock Tunnel        moving            2m51s   15    12.8±3.3    5.7±2.7   4.7s       0.20     0.57
    Car railcrossing          moving            2m49s   16    13.2±2.0    4.9±2.0   5.4s       0.36     0.78
    Cockpit Landing           moving            5m2s    15    12.8±2.6    7.3±2.9   6.7s       0.28     0.84
    Cooking                   moving            1m27s   17    13.8±1.3    3.2±1.1   4.3s       0.38     0.91
    Eiffel Tower              moving            3m20s   15    11.8±2.9    5.5±2.3   4.6s       0.31     0.80
    Excavators river cross.   moving            6m29s   15    14.0±1.2    9.9±4.7   6.9s       0.30     0.63
    Jumps                     moving            0m39s   15    14.4±1.0    2.9±1.1   2.4s       0.48     0.87
    Kids playing in leaves    moving            1m46s   15    13.2±2.4    4.2±2.5   4.6s       0.29     0.59
    Playing on water slide    moving            1m42s   15    12.6±2.8    5.2±3.2   3.2s       0.20     0.56
    Saving dolphines          moving            3m43s   15    13.9±1.3    6.9±2.9   6.6s       0.19     0.21
    St Maarten Landing        moving            1m10s   17    13.9±1.1    2.8±1.6   4.8s       0.50     0.94
    Statue of Liberty         moving            2m36s   17    10.7±3.5    3.1±2.4   7.5s       0.18     0.56
    Uncut Evening Flight      moving            5m23s   15    12.1±2.5    6.3±3.1   7.6s       0.35     0.85
    paluma jump               moving            1m26s   15    12.9±1.9    3.1±1.2   4.6s       0.51     0.91
    playing ball              moving            1m44s   16    13.9±1.7    4.7±2.5   4.3s       0.27     0.68
    Notre Dame                moving            3m12s   15    12.9±2.0    7.6±3.8   4.1s       0.23     0.63
    Air Force One             static            2m60s   15    14.0±1.5    5.3±3.0   6.2s       0.33     0.85
    Fire Domino               static            0m55s   15    14.0±1.7    4.0±2.0   2.2s       0.39     0.85
    car over camera           static (mostly)   2m26s   15    12.4±2.5    4.7±2.7   5.0s       0.35     0.84
    Paintball                 static (mostly)   4m16s   17    11.5±3.3    5.2±2.2   6.6s       0.40     0.87
    Mean                                        2m40s   16    13.1±2.4    5.1±3.0   4.9s       0.31     0.74

    ii) Humans are shown two different summaries and are asked to select the
        better one [18, 22]. Typically, the summaries are compared to some baseline
        such as uniform sampling or k-means clustering.
These evaluation methods are problematic, as they are expensive and time con-
suming as they rely on human judges for each evaluation. The evaluation of the
method of [22], for example, required one full week of human labor. Both ap-
proaches are discriminative, i.e. they help to tell which summary is better than
another, but fail to show what a good summary should look like.
    Rather than using the above approaches, we let a set of study subjects gen-
erate their own summaries. This was done in a controlled psychological experi-
ment, as described in the next section. We collected multiple summaries for each
videos, as there is no true answer for a correct summarization, but rather multi-
ple possible ways. With these human summaries, referred to as human selections,
we can compare any method that creates an automatic summary in a repeat-
able and efficient way. Such automatic vs. human comparison has already been
used successfully for keyframes [1, 15]. Khosla et al. [15] showed that compar-
ing automatic keyframe summaries to human keyframe selections yields ratings
comparable to letting humans directly judge the automatic summaries.

6.1        Setup
The SumMe dataset consists of 25 videos covering holidays, events and sports.
They are raw or minimally edited user videos, i.e. they have a high compress-
ibility compared to already edited videos. The length of the videos ranges from
about 1 to 6 minutes (Overview in Tab. 1).
Creating Summaries from User Videos                  9

           (a)                    (b)       (a) Catching fire         (b) The tower falls

Fig. 4: Consistency of human selections. We show the human selections for the
video “Fire Domino”, a typical video from our dataset. The selection of a frame is
marked in black. As one can see, there is a high consistency among the study partici-
pants. They consistently selected the two main events (a) and (b) of the video.

   Given a video, the study subjects were asked to produce a summary that
contains most of its important content, i.e. that best summarizes the input
video. They could use a simple interface that allows to watch, cut and edit a
video. We required the summary length Ls to be 5% ≤ Ls ≤ 15% to ensure
that the input video is indeed summarized rather than being slightly shortened.
The videos were shown in random order and the audio track was not included to
ensure that the subjects chose based on visual stimuli. A total of 19 male and 22
female subjects, with varying educational background, participated in the study.
Ages were ranging from 19 to 39 and all had normal or corrected vision. Each
video was summarized by 15 to 18 different people. The total user time of the
study amounts to over 40 hours.
   An example from our dataset is shown in Fig. 4. The complete experimental
data including verbatim instructions, user interface and the human selections
can be found in the supplementary material.

6.2   Human consistency
In this section we analyze the human selection results in terms of the consistency
among the participants.
    To assert the consistency of human selections, we propose the use of the pair-
wise f-measure between them. We will use same consistency measure to evaluate
the performance of automatic summaries in Sec. 7. For a human selection i, it
is defined as follows:
                                           N
                                    1      X             pij rij
                          F̄i =                     2             ,                         (6)
                                  N −1                  pij + rij
                                         j=1,j6=i

where N is the number of human subjects, pij is the precision and rij the recall
of human selection i using selection j as ground truth. We compute recall and
precision on a per-frame basis. This procedure of averaging pairwise comparisons
accounts for individual differences in the way humans select segments and was
also successfully used in the Berkeley Segmentation Dataset [23]. The dataset
has a mean of F̄ = 0.31 (min. 0.18, max. 0.51). Additionally we computed
10     Michael Gygli, Helmut Grabner, Hayko Riemenschneider, Luc Van Gool

the Cronbach alpha, which is a standard measure to assess the reliability of a
                                           N r̄
psychometric test. It is defined as α = 1+(N −1)r̄ , where r̄ is the mean pairwise
correlation between all human selections. The dataset has a mean of α = 0.74
(min. 0.21, max. 0.94). Ideally α is around 0.9, while α > 0.7 is the minimum
for a good test [17, p. 11, 13].
    To summarize, we showed that the most of the videos have a good consis-
tency and it is thus appropriate to train and evaluate computational models
on them. This is particularly true, since we use pairwise scores rather than
one single reference summary. Generally, we observe the consistency depends on
the diversity within a video. Videos that do not have a set of clearly separable
events have lower consistency than videos with a set of visually and semantically
dissimilar events.

7     Experiments

We evaluate our method using the new benchmark and the f-measure defined in
Eq. (6). We compare our method to a random, uniform and clustering baseline,
as well as a recent method based on visual attention [5]. Further, we compare to
the individual human summaries. Ideally, a computer generated summary is as
consistent as the best human summary selection. In addition, we also investigate
the influence on the performance of the main steps in our pipeline. The results
described here are summarized in Tab. 2.

Implementation details. We kept all parameters fixed for all results. When
estimating Pl and w we used leave-one training. In the superframe segmentation,
we set the initial delta δ = 0.25s and the γ = 1 for all videos. For the inter-
estingness estimation, we computed all image features sparsely every 5th frame,
but processed all frames for motion features. We normalized the feature scores
per video to zero mean and unit variance. For the Follow object feature, we used
a Gaussian kernel with a window size h = 10 in the kernel density estimation.

7.1   Dataset scores

We characterize the dataset by computing random scores and the upper bound
(Tab. 2). The upper bound is defined as the highest reachable score for this
dataset, given the human selection and the pairwise f-measure. It would only be
1.0, if all humans summary selection would be exactly the same.
    Additionally, we measure the “human performance”, which is the average
f-measure of one humans to all the others. We show the worst, average and best
scores of the human selections in Tab. 2. The “worst human“ score is computed
using the summary which is the least similar to the rest of the summaries. The
more similar a human selection is to all the others, the higher the score. The
best human score is the mean f-measure of the most similar summary w.r.t. all
the others, i.e. it mostly contains parts that were selected by many humans.
Creating Summaries from User Videos 11
Table 2: Quantitative results. We show f-measures at 15% summary length for
our approach, the baselines and the human selections. We highlight the best and
second best computational method. Our method consistently shows a high performance
scoring higher than the worst human per video.
Dataset Humans Computational methods
Videoname Random Upper bound Worst Mean Best Uniform Cluster. Att.[5] Ours
Base jumping 0.144 0.398 0.113 0.257 0.396 0.168 0.109 0.194 0.121
ego.
Bike Polo 0.134 0.503 0.190 0.322 0.436 0.058 0.130 0.076 0.356
Scuba 0.138 0.387 0.109 0.217 0.302 0.162 0.135 0.200 0.184
Valparaiso Downhill 0.142 0.427 0.148 0.272 0.400 0.154 0.154 0.231 0.242
Bearpark climbing 0.147 0.330 0.129 0.208 0.267 0.152 0.158 0.227 0.118
Bus in Rock Tunnel 0.135 0.359 0.126 0.198 0.270 0.124 0.102 0.112 0.135
Car railcrossing 0.140 0.515 0.245 0.357 0.454 0.146 0.146 0.064 0.362
Cockpit Landing 0.136 0.443 0.110 0.279 0.366 0.129 0.156 0.116 0.172
Cooking 0.145 0.528 0.273 0.379 0.496 0.171 0.139 0.118 0.321
Eiffel Tower 0.130 0.467 0.233 0.312 0.426 0.166 0.179 0.136 0.295
Excavators river crossing 0.144 0.411 0.108 0.303 0.397 0.131 0.163 0.041 0.189
moving
Jumps 0.149 0.611 0.214 0.483 0.569 0.052 0.298 0.243 0.427
Kids playing in leaves 0.139 0.394 0.141 0.289 0.416 0.209 0.165 0.084 0.089
Playing on water slide 0.134 0.340 0.139 0.195 0.284 0.186 0.141 0.124 0.200
Saving dolphines 0.144 0.313 0.095 0.188 0.242 0.165 0.214 0.154 0.145
St Maarten Landing 0.143 0.624 0.365 0.496 0.606 0.092 0.096 0.419 0.313
Statue of Liberty 0.122 0.332 0.096 0.184 0.280 0.143 0.125 0.083 0.192
Uncut Evening Flight 0.131 0.506 0.206 0.350 0.421 0.122 0.098 0.299 0.271
paluma jump 0.139 0.662 0.346 0.509 0.642 0.132 0.072 0.028 0.181
playing ball 0.145 0.403 0.190 0.271 0.364 0.179 0.176 0.140 0.174
Notre Dame 0.137 0.360 0.179 0.231 0.287 0.124 0.141 0.138 0.235
static
Air Force One 0.144 0.490 0.185 0.332 0.457 0.161 0.143 0.215 0.318
Fire Domino 0.145 0.514 0.170 0.394 0.517 0.233 0.349 0.252 0.130
car over camera 0.134 0.490 0.214 0.346 0.418 0.099 0.296 0.201 0.372
Paintball 0.127 0.550 0.145 0.399 0.503 0.109 0.198 0.281 0.320
mean 0.139 0.454 0.179 0.311 0.409 0.143 0.163 0.167 0.234
relative to upper bound 31 % 100 % 39 % 68 % 90 % 31 % 36 % 37 % 52 %
relative to average human 45 % 146 % 58 % 100 % 131 % 46 % 53 % 54 % 75 %
7.2 Baselines
We compare our approach to the following baselines:
Uniform sampling. We uniformly select K segments of length arg max(Pl ),
l
such that the final summary length is ≤ Ls (15% of the input).
Clustering. We computed color histograms with 163 dimensions for each
frame and averaged these per superframe. Then, we clustered the superframes
with [7], using the affinity of [18]. Given this clustering, we use the cluster centers
as candidates for the final summary and select a subset using Eq. (5).
Visual Attention. Recently [5] proposed an approach for keyframe selection
based on the principles of human attention (cf. Sec. 4). As this method produces
keyframes, we selected K segments of length arg max(Pl ) around the highest
l
scored frames, such that the final summary is of length Ls (15% of the input
video).
7.3 Results
As can be see from Tab. 2, our method outperforms all baselines. Our method
has an average performance of 52%, while the strongest baseline reaches 37%,
relative to the upper bound. If we compare to the human consistency (the human
’performance’), we can see that our method even outperforms, on average, the
worst human of each video. Furthermore it reaches a performance comparable
to the average human summary in many cases. Our method is able to find the12 Michael Gygli, Helmut Grabner, Hayko Riemenschneider, Luc Van Gool
important segments of a video and to produce an informative summary from
them. The proposed features capture the central aspects of a video.
The highest average performance is achieved on static cameras. This is not
surprising as in such a setting simple features are often sufficient to find an
event of interest (e.g. temporal gradients). While our method performs well in
all settings (static, moving and egocentric), it has a low performance for certain
videos, e.g. the video “Base jumping”. This video contains fast motion and
subtle semantics that define important events of the video, such as opening the
parachute or the landing. These are difficult to capture based on the used image
and motion features, which leads to a low performance for this video.
In Fig. 5 we show the quantitative performance over the whole video for
different summarization ratios and a visualization of a few automatic summaries
in Fig. 7. We refer the reader to the supplementary material for quantitative and
especially qualitative results on all videos.
Fig. 5: Quantitative results. We
compare our method (red) to
the visual attention [5] base-
line (black) and the average hu-
man performance (green) over the
entire dataset. Automatic sum-
maries are computed for lengths
≤ 5%, 10% and 15%.
7.4 Performance of the individual components
Interestingness. We investigate the importance and reliability of the individual
interestingness features. In Fig. 6a we show the performance gain by adding a
feature to the set of used features (the difference in performance of (not) using
a feature). As could be expected, general features perform best, as they can
potentially help on all videos. Somewhat surprisingly, a feature as simple as
colorfulness leads to a high performance gain. Additionally, we observe a large
improvement by using the detection of landmarks and a camera that follows a
moving object. This is despite the fact, that only a fraction of videos contains
either of these. However, if e.g. a landmark appears in the video, this is a strong
indicator that such a part should be selected for a summary. When combining
the individual features , they can predict what parts of a video should be selected
for the automatic summary (see performance in Tab. 6b). However, the features
cannot capture what is interesting in all cases. Lacking a temporal smoothing
the scores are often noisy and, when selecting frames based on this score, create
disruptive segments. We target these problems by temporal smoothing, as we
discuss in the following.
Superframes. We analyze the performance gain by using temporal segmenta-
tion (Tab. 6b). Instead of using per-frame interestingness scores, we compute a
score per temporal window. We compare the proposed superframes to segmentsCreating Summaries from User Videos 13
mean f-measure
Attention
Colorful Segmentation per frame per segment
Landmark
Edges Single frame 0.217 (70%) 0.035 (10%)
Persons area
Follow object Fixed length 0.222 (72%) 0.151 (44%)
Faces area Clustering 0.228 (73%) 0.155 (45%)
Contrast
-6 0 6 12 18 Superframes 0.234 (75%) 0.170 (49%)
F-measure increase [%]
Temporal segmentation: We report the
Feature performance. We show the performance of different temporal segmenta-
increase in performance by adding a tions. Percent scores are relative to the av-
feature to the set of used features. erage human.
Fig. 6: Weights and performance of the individual steps in the pipeline (See text).
of fixed length, where we set the length to the optimal value according to the
length prior Pl . As an additional baseline we use clustering to select keyframes
(k-means) and use these as centers to create segments, which partition the video
into shots (with segment boundaries in the middle between two keyframes).
Each segment is scored according to Eq. (4) and the summary is optimized us-
ing Eq. (5), such that the final summary length maximally 15% of the initial
video. As we want to analyze the quality of the created segments, we report f-
measure on the per-frame and also on the segment level. To compute recall and
precision of segments, we compute the intersection over union of the segments
and threshold it at 0.25.
As expected, smoothing over a temporal neighborhood leads to an increased
performance, especially on the segment level. While the main aim of the su-
perframes is to produce aesthetically pleasing summaries, we can observe that
using these motion aligned segments yields a better performance. This indicates
that using such a grouping is indeed more semantically logical. For qualitative
differences in the produced summaries, we refer the reader to the videos in the
supplementary material or on our website.
8 Conclusion
In this work we proposed a novel temporal superframe segmentation for user
videos and a method to produce informative summaries from them. To score the
superframes we proposed a set of interestingness features and showed that they
capture what is important well. With the use of a 0/1-knapsack formulation,
we optimized the interestingness of the final summary, while remaining within a
given time budget.
The evaluation of our method shows that it is generally able to create good
automatic summaries, often reaching the performance of humans. Nonetheless,
video summarization is still in its beginnings. The contribution of our benchmark
with multiple human summaries per video makes it possible to gain additional
insights into what humans rate as important. This will help develop new features
and methods in the future.14 Michael Gygli, Helmut Grabner, Hayko Riemenschneider, Luc Van Gool
Interestingness
human automatic
selection summary
highest scored
events
Taking position in the goal Receiving a shot Passing another player Track player jumping Closely crossing
into position another player
Video “Bike Polo”
human automatic
selection summary
highest scored
events
Cooking meat Stacking up a cone (start) Stacking up a cone (end) Filling the cone Setting it on fire
Video “Cooking”
human automatic
selection summary
highest scored
events
Preparing the slide Overview and slide down Flying People appear to congratulate Discussing
Video “Jumps”
Fig. 7: Example summaries. For each video we show the predicted interestingness
score (black) and the selected segments (green) on top. In the middle we show the
human scores (red). The human score is computed as the ratio of selections over views,
per frame. Peaks in the human score indicate that this part was often selected by
humans, while a peak in the interestingness score indicates a high prediction for
this part. Our method correctly selects the most important events and produces a
compact and interesting summary from them. The superframe segementation ensures
that the cuts between the segments are smooth. Best viewed in color. All generated
summaries are given in the supplementary material.
Acknowledgements. We thank Michel Druey and the Varcity team for fruitful dis-
cussions and help. This work was supported by the European Research Council (ERC)
under the project VarCity (#273940) and the Swiss CTI under project no. 15769.1.Creating Summaries from User Videos 15
References
1. de Avila, S.E.F., Lopes, A.P.B., da Luz Jr., A., de A. Arajo, A.: VSUMM: a
mechanism designed to produce static video summaries and a novel evaluation
method. Pattern Recognition Letters (2011)
2. Van den Bergh, M., Boix, X., Roig, G., de Capitani, B., Van Gool, L.: SEEDS:
superpixels extracted via energy-driven sampling. ECCV (2012)
3. Datta, R., Joshi, D., Li, J., Wang, J.Z.: Studying aesthetics in photographic images
using a computational approach. ECCV (2006)
4. Dragon, R., Ostermann, J., Van Gool, L.: Robust Realtime Motion-Split-And-
Merge for Motion Segmentation. GCPR (2013)
5. Ejaz, N., Mehmood, I., Wook Baik, S.: Efficient visual attention based framework
for extracting key frames from videos. Signal Processing: Image Communication
(2013)
6. Felzenszwalb, P.F., Girshick, R.B., McAllester, D., Ramanan, D.: Object detection
with discriminatively trained part based models. PAMI (2010)
7. Frey, B.J., Dueck, D.: Clustering by passing messages between data points. Science
(2007)
8. Gammeter, S., Bossard, L., Quack, T., Van Gool, L.: I know what you did last
summer: object-level auto-annotation of holiday snaps. ICCV (2009)
9. Goldman, D., Curless, B.: Schematic storyboarding for video visualization and
editing. ACM Trans. on Graphics (2006)
10. Goodrich, M.T., Tamassia, R.: Algorithm Design: Foundation, Analysis and Inter-
net Examples. John Wiley & Sons (2006)
11. Gygli, M., Grabner, H., Riemenschneider, H., Nater, F., Van Gool, L.: The inter-
estingness of images. ICCV (2013)
12. Hou, X., Harel, J., Koch, C.: Image signature: Highlighting sparse salient regions.
PAMI (2012)
13. Huang, T., Mehrotra, S.: Adaptive key frame extraction using unsupervised clus-
tering. Proc. Image Processing (1998)
14. Ke, Y., Tang, X., Jing, F.: The design of high-level features for photo quality
assessment. CVPR (2006)
15. Khosla, A., Hamid, R., Lin, C., Sundaresan, N.: Large-Scale Video Summarization
Using Web-Image Priors. CVPR (2013)
16. Kim, G., Sigal, L., Xing, E.P.: Joint Summarization of Large-scale Collections of
Web Images and Videos for Storyline Reconstruction. CVPR (2014)
17. Kline, P.: The handbook of psychological testing. Psychology Press (2000)
18. Lee, Y.J., Ghosh, J., Grauman, K.: Discovering important people and objects for
egocentric video summarization. CVPR (2012)
19. Liu, D., Hua, G., Chen, T.: A hierarchical visual model for video object summa-
rization. PAMI (2010)
20. Liu, F., Niu, Y., Gleicher, M.: Using Web Photos for Measuring Video Frame
Interestingness. IJCAI (2009)
21. Liu, Z., Zavesky, E., Shahraray, B.: Brief and high-interest video summary gen-
eration: evaluating the AT&T labs rushes summarizations. ACM WS on Video
summarization (2008)
22. Lu, Z., Grauman, K.: Story-Driven Summarization for Egocentric Video. CVPR
(2013)
23. Martin, D., Fowlkes, C., Tal, D., Malik, J.: A database of human segmented natural
images and its application to evaluating segmentation algorithms and measuring
ecological statistics. ICCV (2001)16 Michael Gygli, Helmut Grabner, Hayko Riemenschneider, Luc Van Gool
24. Mascelli, J.V.: The five C’s of cinematography. Cine/Grafic Publications (1965)
25. Over, P., Smeaton, A.F., Awad, G.: The TRECVID 2008 BBC rushes summariza-
tion evaluation. Proc. ACM WS on Video summarization (2008)
26. Smith, M., Kanade, T.: Video skimming and characterization through the combi-
nation of image and language understanding. Proc. on Content-Based Access of
Image and Video Database (1998)
27. Viola, P., Jones, M.: Robust real-time face detection. IJCV (2004)
28. Wolf, W.: Key frame selection by motion analysis. Acoustics, Speech, and Signal
Processing (1996)You can also read