Town of Orleans - Community Resilience Building Workshop Summary of Findings May 2019 - DRAFT
←
→
Page content transcription
If your browser does not render page correctly, please read the page content below
Town of Orleans

Community Resilience Building
Workshop Summary of Findings
      May 2019 - DRAFT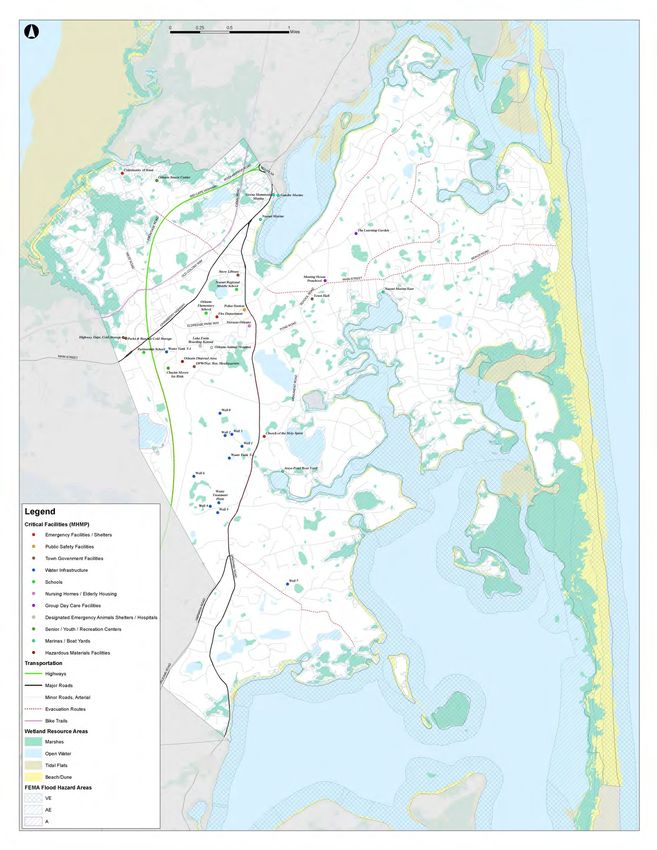
Contents

Overview: ..........................................................................................................................................1
Top Hazards and Vulnerable Areas .....................................................................................................3
   Top Hazards ...................................................................................................................................3
   Vulnerable Areas ............................................................................................................................4
Current Concerns and Challenges Presented by Hazards......................................................................5
Specific Categories of Concerns and Challenges ..................................................................................6
Current Strengths and Assets .............................................................................................................8
Top Recommendations to Improve Resilience.....................................................................................9
CRB Workshop Participants ..............................................................................................................13
Recommended Citation....................................................................................................................14
CRB Workshop Project Team ............................................................................................................14
Acknowledgements..........................................................................................................................14

Appendix A: Workshop Base Map................................................................................................... A-1
Appendix B: Participatory Mapping Results .................................................................................... B-1
Appendix C: Orleans Risk Maps Used During Workshop .................................................................. C-1
Appendix D: Massachusetts Updated Climate Projections ............................................................... D-1
Appendix E: Listening Session Public Comments ..............................................................................E-1
Town of Orleans
                 Community Resilience Building Workshop
                         Summary of Findings

Overview:
The need for municipalities, regional planning organizations, states and federal agencies to increase
resilience and adapt to extreme weather events and mounting natural hazards is strikingly evident
amongst the communities of coastal Massachusetts. Recent events such as successive March 2018
nor’easters, and heavy rain and wind events during the summer of 2018 have reinforced this urgency
and compelled communities like the Town of Orleans to proactively plan and mitigate potential risks
through a community driven process. Ultimately, these efforts will reduce the vulnerability of Orleans’
citizens, facilities and ecosystems, and serve as a model for other Massachusetts communities.

In the fall of 2018, with funding from the Executive Office of Energy and Environmental Affairs
Massachusetts Municipal Vulnerability Preparedness Program, the Town of Orleans contracted with the
Woods Hole Group to implement the Community Resilience Building (CRB) process while also using
components of the CRB process to update the Town’s Multi-Hazard Mitigation Plan. A municipal-based
core team was established to organize and implement an 8-hour CRB Workshop on February 8, 2019.
The goal of this workshop was to engage and educate community stakeholders to facilitate the
development, planning and ultimately, the implementation of priority adaptation actions. The list of
workshop invitees and workshop content was guided by input from the municipal core team and
consultants from Woods Hole Group. The Workshop’s central objectives were to:
   •    Define top local natural and climate-related hazards of concern;
   •    Identify existing and future strengths and vulnerabilities;
   •    Develop prioritized actions for the Community; and
   •    Identify immediate opportunities to collaboratively advance actions to increase resilience.

Community Resilience Building Workshop, Summary of Findings, Orleans                                 1
Twenty-nine (29) participants from town departments/committees/boards, community organizations,
local businesses, and regional transportation and energy companies were in attendance for the
workshop, which employed a community-driven workshop process following the Community Resilience
Building (CRB) framework (www.CommunityResilienceBuilding.com). The CRB’s Risk Matrix format,
large-scale maps of Town (Appendix A & B), and various datasets on natural hazards (Appendix C & D)
were integrated into the workshop process to provide both decision support and risk visualization for
workshop participants. The workshop included a combination of large group presentations and small
group discussions. The large group presentations outlined the workshop process and goals, presented
relevant hazard and community data, and shared example actions. Participants also had an opportunity
to work together in small groups consisting of 7 to 8 people with different roles, responsibilities and
expertise to foster an exchange of ideas and perspectives. Spokespersons from the small groups then
reported their findings back to the larger group. This workshop process, rich with information and
experiences shared amongst the participants, produced the findings detailed in this summary report.
This report provides an overview of the top hazards, current concerns and challenges, strengths and
vulnerabilities, and recommended actions to improve the Town of Orleans’ resilience to natural and
climate-related hazards today and in the future.

Workshop participants and other interested stakeholders are encouraged to provide comments,
corrections and updates on the summary of findings described in this report. The Town of Orleans’
ongoing community resilience will benefit from the participation of all those concerned.

Community Resilience Building Workshop, Summary of Findings, Orleans                                 2
Top Hazards and Vulnerable Areas
Prior to the Community Resilience Building Workshop held on February 8, 2019, invited workshop
participants were asked to identify the top natural hazards for the Town of Orleans as part of a pre-
workshop online survey. Nor’easters, hurricanes and tropical storms, flooding, and coastal erosion were
identified as the hazards of greatest concern. Severe winter weather and high winds were also identified
as major concerns for the Town. Although these hazards were not specifically addressed as “top
hazards” during the CRB Workshop process, the impacts from these hazards overlap with hazards that
were specifically addressed (i.e., Nor’easters and Hurricanes and Tropical Storms).

Top Hazards
   •     Nor’easters
   •     Hurricanes & Tropical Storms
   •     Flooding
   •     Coastal Erosion

                         Flooding
                  Coastal erosion
                         Shoaling
                    Sea-level rise
   Hurricanes & Tropical Storms
           Severe winter weather
                      Nor’easters
                 Lightning storms
                         Drought
        Higher temps/heat waves
       Extreme cold temperatures
                      High winds
                       Tornadoes
                        Wildfires
             Dam / culvert failure
                      Earthquake
                         Tsunami
                           Other:

                                     0    5          10           15            20     25          30
                                                          Number of Responses

Community Resilience Building Workshop, Summary of Findings, Orleans                                    3
Vulnerable Areas
   Populations and Neighborhoods: Areas of subsidizing and public housing (Rock Harbor Village,
   Tonset Woods, etc.), concentrations of elderly populations (nursing home, senior housing, etc.),
   other vulnerable populations (mobility impaired, health risks, homeless, etc.), and neighborhoods
   that can be isolated during a flood event (Rock Harbor Village, Mayflower Point).

   Ecosystems: Nauset Beach, which has been experiencing severe erosion, Skaket Beach, large
   estuaries in Town (Nauset Estuary and Pleasant Bay), shoaling that is occurring near the inlets and
   within the estuaries, mature trees resulting in large limbs overhanging powerlines, and aquaculture
   and shellfish beds.

   Infrastructure and Transportation: Low-lying coastal roadways (Herring Brook Way, Main Street,
   River Road, Rock Harbor Road, Bridge Road, Quanset Road and Route 28 along Pleasant Bay),
   Orleans/Eastham rotary, septic systems, the electrical distribution system, including overhead
   electricity and utility wires, inadequate stormwater drainage systems and boat landings (Mill Pond
   Road and Sparrowhawk Road landings) and marine fuel storage depots (Arey’s Boat Yard, Goose
   Hummock, Rock Harbor, Paw Wah).

   Facilities: Snow Library, Community of Jesus, Senior Center, the schools (Orleans Elementary and
   Middle School), and the lack of local emergency shelter.

Community Resilience Building Workshop, Summary of Findings, Orleans                                4
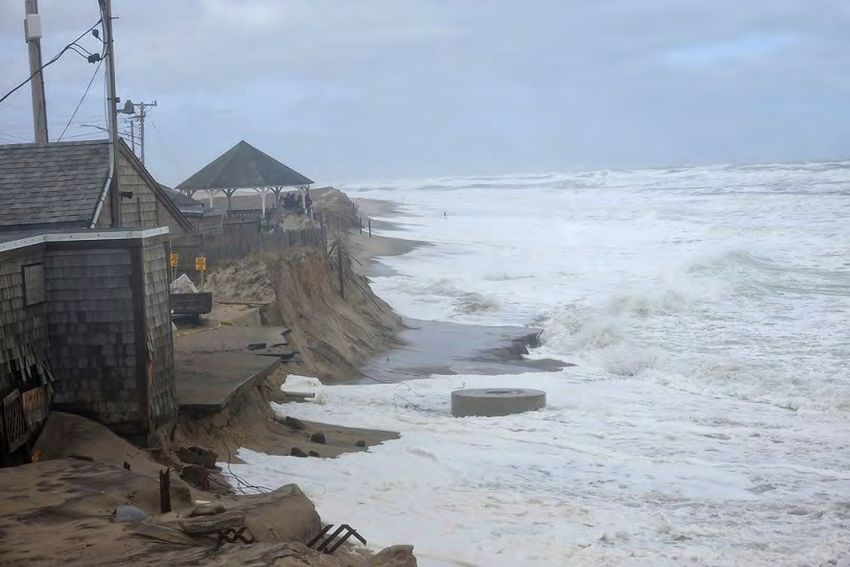
Current Concerns and Challenges Presented by Hazards
The Town of Orleans has many concerns and faces multiple challenges related to the impacts of natural
hazards. In recent years, Orleans has experienced a series of highly disruptive and damaging weather
events, including three successive nor’easters in March 2018, as well as significant rainfall events, such
as the >4 inches of rain that fell within a few hours in August 2018. The impacts from recent nor’easters
included significant coastal erosion at Nauset Beach, resulting in the loss of more than 50 feet of coastal
dune and irreparable damage to Liam’s snack shack, as well as coastal flooding and high winds resulting
in many downed trees blocking roads
and disrupting the electrical supply to
many areas of Town. The frequency
of these storms in March 2018
exacerbated the impacts, as the
Town was still recovering from the
last storm when the next one arrived.
The magnitude and severity of the
impacts of these storms produced a
heightened level of awareness in
Town and provided additional
motivation      to    comprehensively
improve resilience and reduce local
vulnerabilities to natural hazards.

This series of extreme weather events highlighted that impacts from hazards are felt differently across
the Town from the low-lying coastal areas to the forested uplands to the more developed downtown
area. The barrier beaches separating Pleasant Bay and Nauset Estuary from the Atlantic Ocean are
exposed to the full force of wave action, storm surge and high winds. During a major storm event, these
barrier systems experience significant erosion, areas of over wash, shifting inlets, and excessive shoaling
in the estuaries. The forested inland areas experience the effects of tree damage from wind, snow and
ice, as well as hazards from inland flooding along roads due to poor drainage. The combination of these
issues presents a challenge to emergency preparedness and response, and requires comprehensive yet
tailored actions for establishing mitigation priorities for different areas of Town.

The workshop participants were generally in agreement that the Town of Orleans is experiencing more
intense and frequent storms. The impacts, particularly during the series of March 2018 nor’easters,
affected the daily activities of every resident. Low lying coastal roads are experiencing greater impact
from major storms, and increases in severe rain events are resulting in routine flooding of certain major
roadways where stormwater systems are inadequate to effectively divert rainwater. Additionally, there
was a general concern that a long-range plan needed to be developed for how to manage the marine
fuel depots, to minimize the risk of spills and pollution during flood and storm events.

Community Resilience Building Workshop, Summary of Findings, Orleans                                     5
Specific Categories of Concerns and Challenges

Vulnerability of Marine Fuel Depots and Landings
One of the primary concerns expressed by participants was the vulnerability of marine fuel storage
facilities at various marinas and landings. Given the increasing hazards presented by flooding, sea-level
rise and storm surge, participants felt that action should be taken to mitigate risk from these potential
pollution sources. Concern was also expressed about the extremely low elevation and ongoing erosion
occurring at some of the landings, specifically Mill Pond Road and Sparrowhawk Road Landings.

Utility (Electrical and Water) Distribution Systems
Electric service outages can be caused by a number of different natural hazard types, but most notably
by high winds and heavy snow. The power distribution system was cited as one of the most critical
pieces of infrastructure in Town, which can impact all residents regardless of where they live. Mature
trees and overhanging limbs along roadways are a primary culprit because they can bring down power
lines if they are toppled by high winds. Power interruptions due to storms can cause outages to heating
or cooling systems, prohibit proper food storage and refrigeration, and generally disrupt daily life.
Workshop participants identified elderly populations, the mobility impaired and low income residents as
being particularly at risk during electric service outages.

The Town has a large watershed management area, which contains a wellfield that provides residents in
the Town with drinking water. There was a concern from multiple groups about the longevity and
security of these wells as a source of drinking water given the threat of salt water intrusion as sea-level
rises. Participants also expressed concerns about access to the Town wells during storms due to downed
trees or fire, and the fact that private wells do not function without electricity.

Roadway Flooding
Coastal flooding (e.g., standing flood waters, storm surge, and resulting erosion) presents a major threat
to the Town’s low-lying coastal roadways, including Herring Brook Way, Main Street, River Road, Rock
Harbor Road, Bridge Road, Quanset Road and Route 28 along Pleasant Bay. Recent flooding events
prompted participants to consider the future impact of coastal flooding if the extent or frequency of this
hazard were exacerbated by sea-level rise, and to consider mitigation actions that would allow usable
transportation corridors during flood events. Of particular concern is that coastal flooding has and will
continue to inundate roads and neighborhoods, isolating certain areas from the rest of Town, and
making it difficult for first responders and other services to access those areas during emergencies.

In addition to coastal flooding, key roadway areas in Town also experience significant flooding during
heavy rainfall events. Stormwater systems are currently inadequate to handle the volume of
precipitation produced by these large rain events, resulting in impassible roadways, inaccessible parking
lots and businesses, and stranded vehicles.

Beach and Coastal Erosion

Community Resilience Building Workshop, Summary of Findings, Orleans                                     6

All small working groups also identified ongoing erosion along Orleans’ Atlantic coastline as a point of
concern. Nauset Beach, the Town’s only ocean-facing public beach, was noted as a location of particular
concern. Orleans’ coastline is not only vital to the character of the Town, but this barrier beach system
also provides valuable tourism and recreation benefits, vital habitat for threatened and endangered
species, such as piping plovers and other nesting shorebirds, and provides the first line of defense for
the Town against coastal storms, flooding, wave action and storm surge. Participants expressed concern
about the ongoing erosion occurring at Skaket Beach along Cape Cod Bay and at a number of the smaller
landings (e.g., Mill Pond Road) as well.

Lack of a Local Shelter
Should the need arise, residents of Orleans are currently directed to the regional emergency shelter
located at Nauset High School in Eastham. There was a general concern expressed by the participants
about the lack of an overnight shelter facility located within Orleans itself. This concern revolved around
the uncertainty about whether roadways to Eastham would be passable and/or if the regional shelter
would be have adequate capacity in the case of a severe event.

Community Resilience Building Workshop, Summary of Findings, Orleans                                     7
Current Strengths and Assets
As a result of Orleans’ recent experiences with extreme weather, the Town is well acquainted with its
existing strengths. Reinforcing and expanding these supportive practices and assets will improve
resilience against future storms, with greater frequencies and intensities. Additional planning will help
the Town address anticipated increases in storm surge, sea-level rise and precipitation.

    •   Orleans’ first responders and emergency personnel have proven to be key assets during recent
        natural hazards. Participants highlighted effective interdepartmental coordination as a key
        strength. Responsive and committed Town leadership and staff are an important asset to
        Orleans, both in day-to-day operations, as well as during and immediately following a natural
        hazard or an emergency event.
    •   Piers and landings were considered a strength. In a Town that includes so much coastline along
        various waterbodies and embayments, multiple piers and landings are important to provide
        emergency responders with ready access to various locations.
    •   The Town’s solar farm is a key strength by allowing the Town to draw from renewable energy
        sources, reduce its carbon footprint and move towards energy independence.
    •   Town well field is a local, reliable source of drinking water.
    •   Barrier beaches, marshes and estuaries along Orleans’ coasts were recognized as an important
        buffer, offering the first line of defense against storms through storm surge attenuation and
        reduction of wave energy. Without these natural resources in place, the Town’s coastal and
        inland infrastructure and homes would suffer greater damage during storm events.
    •   The presence of the Cape Cod National Seashore in portions of Orleans, means that the natural
        resources have been well protected and are therefore more resilient to be able to respond to
        natural hazards and climate change impacts. In addition, the National Seashore can provide aid
        to Orleans during an emergency, including federal staff and equipment resources.
    •   Key facilities in Town have proven to be important strengths. The Council on Aging, Snow
        Library, the Community of Jesus can all serve as gathering places during a natural hazard event.

Community Resilience Building Workshop, Summary of Findings, Orleans                                   8
Top Recommendations to Improve Resilience
A common thread throughout the Workshop discussions was the recognition that the Town and
residents need to be better prepared through longer-term, community-based, contingency planning
across key areas of concern. This and additional core highlights are addressed below. The following were
the top five actions selected by workshop participants.
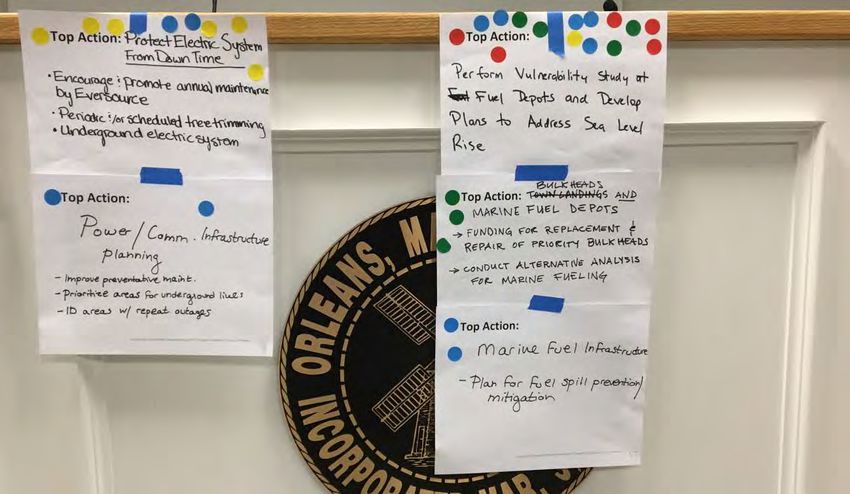
1. Vulnerability Assessment of Coastal Fuel Depots & Implement Spill Prevention Measures:
Conduct a vulnerability assessment of fuel depots, town landings, and hazardous materials
storage facilities in coastal areas. This may include an alternatives assessment for the best
marine fueling and storage options to minimize spill and pollution risks. Based on the results of
the assessment, develop and implement plans to address storm surge and wave impacts, sea-
level rise, and potential spill risks. The Town has already identified the most vulnerable
bulkheads. Actions may include replacement and repair of priority bulkheads (i.e., bulk heads
found to be essential to the safe storage of marine fuel depots).
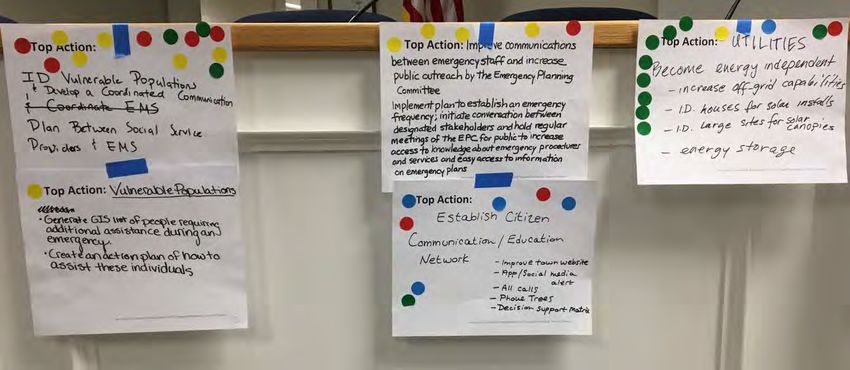
2. Identify Vulnerable Populations to Aid in Emergency Response:
Generate a spatial database of people requiring additional assistance during an emergency,
including contact information, details on potential needs and restrictions, as well as an action
plan for how to assist these individuals. This may involve the development of a coordinated
communication and action plan between social service providers and emergency responders.
3. Become Energy Independent:
Orleans should work towards increasing its off-grid capabilities. Actions could include identifying
houses that would be suitable for solar installations and large sites that would be suitable for
solar canopies, as well as developing energy storage capabilities for existing solar facilities.
4. Improve Public Outreach and Communication:
This could include the establishment of a citizen communication and/or education network,
improvements to the Town website, development and posting of social media alerts, all calls,
phone trees and/or a decision support matrix. The Emergency Planning Committee (EPC) could
take the lead on public outreach related to emergency response. Dissemination of information
could be initiated from the EPC to designated stakeholders. EPC meetings could also be held
with more frequency and be open to the public to increase general knowledge about emergency
procedures and services, as well as what emergency plans are already in place.
5. Evaluate and Address Flood Risks to Low Lying Roads:
Conduct a coastal roads vulnerability assessment to determine the risks from flooding and wave
impacts and to identify priority areas. Design and implement (perhaps using a phased approach)
flood mitigation measures. Solutions may include updates or repairs to culverts, installation of
tide gates, or elevation of roadways. Roadways of particular concern include Skaket Beach Rd,
Mayflower Pt, Rock Harbor Rd, Quanset Rd, Jeremiah’s Gutter, and the Intersection of Rt 28 and
Tar Kiln Rd. The Town should also seek outside funding for implementing these actions.
Community Resilience Building Workshop, Summary of Findings, Orleans 9Community Resilience Building Workshop, Summary of Findings, Orleans 10
In addition to the top five priority actions chosen by the workshop participants, the participants also
developed a larger series of recommended actions, which they prioritized into “high”, “medium” and
“low” priority actions:

Other high priority actions:

    •   Implement the Phased Nauset Beach Retreat Plan, evaluating and updating the plan as needed
        to incorporate updated data. Implementation of the plan may include, but is not limited to,
        dune nourishment, land acquisition for future parking and facilities locations, design, permitting
        and construction of various aspects of the project, and generally enhancing the overall resiliency
        of the barrier system.
    •   Develop a local sheltering network and plan, which may include identifying potential facilities
        and the necessary services that would need to be provided, and formalizing the “shelter-in-
        place” plan.
    •   Protect utility infrastructure. This may take the form of preventative maintenance to the utility
        infrastructure itself, which would involve additional communication with Eversource to
        encourage and promote annual maintenance, periodic and/or scheduled tree pruning,
        prioritizing areas for moving powerlines underground, and/or identifying areas of Town with
        repeat power outages. The Town could request annual reporting from Eversource to improve
        understanding of what actions they have taken in the past year and what actions they are
        planning to take in the coming year.
    •   Address the flood risk in the vicinity of the Orleans-Eastham Rotary. The rotary, and the main
        roads connecting to the rotary, not only serve as regional transportation corridors and
        evacuation routes, but also provide vital access to major commercial areas. A flood vulnerability
        assessment should be performed for the rotary and the nearby drainage areas known as
        Jeremiah’s Gutter. Solutions should address a regional approach and raise awareness of the
        risks, with the goal of providing a reliable evacuation route, even during a flood event, and the
        increased likelihood of this risk in the future given climate change and sea-level rise.
    •   Address inadequate stormwater handling resulting in roadway flooding. Design and install an
        adequate drainage system to remediate stormwater flooding that currently results in impassible
        roadways and inaccessible parking areas.
    •   Work on getting generators for areas of concentration housing. Create provisions for generator
        installation for densely concentrated neighborhoods and/or areas of public housing. Target
        areas could include RH Village, Tonset Woods and Old Colony.
    •   Create a Personal Care Center that could serve as a charging station, warming center, and
        provide key amenities (i.e., a place to cook, shower, etc.) that residents can go to during the day
        when a natural hazard event results in power outages.
    •   Revisit the countywide EMS plan to address sub-regional needs, including standardized
        communications and instituting a post-storm action report.
    •   Conduct a tree inventory, which would identify at risk trees and recommend where to plant new
        ones. This may require the purchase of a new inventory mapping software.
    •   Monitor the potential of salt water intrusion to Well #7.

Community Resilience Building Workshop, Summary of Findings, Orleans                                    11
• Address flooding and coastal erosion at town landings. Ongoing coastal erosion at Mill Pond
Road landing is currently undermining the roadway, water main and other infrastructure.
Additionally, the low existing elevations at Mill Pond Road and Sparrowhawk Road landings
result in frequent flooding of these assets, prohibiting use during certain tides.
Other medium priority actions:
• Revise local building and design standards to provide increased resiliency under future SLR
scenarios.
• Ensure continued service at key businesses (i.e., grocery stores, hardware stores, etc.) during a
hazard event. Access to vital resources allows neighborhoods to provide for themselves if access
out of Town is blocked, and allows for faster recovery. Food security was raised as an important
concern.
• Assess the need for backup power sources (i.e., generators) at municipal facilities that serve the
public (i.e. schools, library, etc.).
• Identify coastal areas that could serve as zones of transition around Pleasant Bay and Nauset
Estuary and to manage those areas to increase resiliency of the salt marsh and estuarine
ecosystem to sea-level rise.
• Obtain permits for dredging in Pleasant Bay and Nauset Estuary, and implement dredging work.
Emphasis should be placed on beneficial reuse within the system as appropriate.
Other low priority actions:
• Build a Town of Orleans Community Center. The Town currently lacks a centralized location for
community engagement, youth and adult recreational programs, and, most for a local
emergency shelter location. There are existing locations in Town that could serve as warming or
charging stations during the day in the event of an emergency, but due to the extensive Red
Cross requirements to establish a full overnight emergency shelter facility, the Town would need
to establish an entirely new site to serve as a local emergency shelter. When not in use during
an emergency, it could serve the community in other ways listed above.
• Conduct thorough site plan reviews during redevelopment, reduce construction of impervious
surfaces, and initiate guidelines for new development and redesigns.
Community Resilience Building Workshop, Summary of Findings, Orleans 12CRB Workshop Participants
Below is a table of workshop participants.
Name Department/Affiliation
Lynn Bruneau Orleans Finance Committee
Bob Rich Orleans Water & Sewer Commissioner
Lee Andre Community of Jesus
Len Short Orleans Water & Sewer Board
Mefford Runyon Orleans Board of Selectmen
Kevin Higgins Orleans Police Department
Lauren McKean Cape Cod National Seashore
David Light Agricultural Advisory Committee
Tony Pike Orleans Fire Department
George Meservey Orleans Planning Department
Kristen Boyd Cape Cod Regional Transit Authority
John Kennedy Cape Cod Regional Transit Authority
Jeffrey Soares Senator Julian Cyr’s Office
Kevin Galligan Orleans Board of Selectmen
Mike Brink Orleans Conservation Commission
Geof Deering Orleans Fire Department
Brian Junkins Friends Market
John Jannell Orleans Conservation Department
Nate Sears Orleans Natural Resources Department / DPW
Terri Smith Center for Coastal Studies
Brenda Halliday The Learning Garden
Bill Ciucca National Grid
Mon Cochran Friends of Pleasant Bay / Orleans Open Space Committee
Bob Canning Orleans Health Department
Tavi Prugno Orleans Snow Library
Judi Wilson Orleans Council on Aging
Alan McClennen Orleans Board of Selectmen
Sims McGrath Orleans Board of Health
Andrea Reed Orleans Planning Board
Below is a table of additional entities that were invited but were unable to attend.
Department/Affiliation Department/Affiliation
Town Administrator's Office Eversource
Orleans Building Department Verizon
Orleans School Department Comcast
Orleans Water Department MassDOT
Orleans Historical Commission Orleans Inn
Orleans Housing Authority Snows Home & Garden
Pleasant Bay Resource Management Alliance Nauset Marine
Orleans Conservation Trust Arey’s Pond Boat Yard
Orleans Pond Coalition Goose Hummock Marina
Terraces Orleans
Community Resilience Building Workshop, Summary of Findings, Orleans 13Recommended Citation
Town of Orleans (2019) Community Resilience Building Workshop Summary of Findings. Coastal
Resiliency Action Committee, Woods Hole Group. Orleans, Massachusetts.
CRB Workshop Project Team
Town of Orleans:
George Meservey, Planning Department Director (Project Lead – Principal Contact)
Nate Sears, Department of Natural Resources (Core Team Member)
John Jannel, Conservation Department (Core Team Member)
Tom Daley, DPW (Core Team Member)
Sue Brown, Water Department (Core Team Member)
Scott MacDonald, Police Department (Core Team Member)
Tony Pike, Fire Department (Core Team Member)
Woods Hole Group:
Elise Leduc (Lead Facilitator)
Leslie Fields (Small Group Facilitator)
Adam Finkle (Small Group Facilitator)
Brittany Hoffnagle (Small Group Facilitator)
Kalinda Roberts (Small Group Facilitator)
Acknowledgements
Special thanks to the Town of Orleans for their willingness to embrace this process and engage a good
cross section of workshop participants, in particular George Meservey and the rest of the municipal staff
that comprised the core team. This project was made possible through funding from the Executive
Office of Energy and Environmental Affairs’ Municipal Vulnerability Preparedness (MVP) Grant Program.
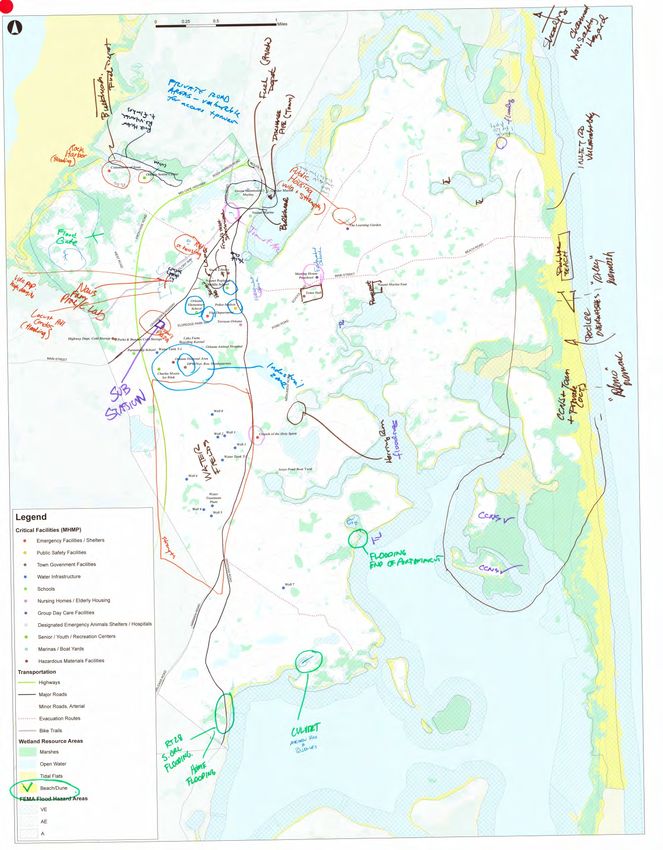
Community Resilience Building Workshop, Summary of Findings, Orleans 14Appendix A: Workshop Base Map Community Resilience Building Workshop, Summary of Findings, Orleans A-1
Community Resilience Building Workshop, Summary of Findings, Orleans A-2
Appendix B: Participatory Mapping Results

Community Resilience Building Workshop, Summary of Findings, Orleans   B-1
Community Resilience Building Workshop, Summary of Findings, Orleans B-2
Community Resilience Building Workshop, Summary of Findings, Orleans B-3
Community Resilience Building Workshop, Summary of Findings, Orleans B-4
Community Resilience Building Workshop, Summary of Findings, Orleans B-5
Appendix C: Orleans Risk Maps Used During Workshop
(Given as workshop handouts)

Community Resilience Building Workshop, Summary of Findings, Orleans   C-1
Community Resilience Building Workshop, Summary of Findings, Orleans C-2
Community Resilience Building Workshop, Summary of Findings, Orleans C-3
Community Resilience Building Workshop, Summary of Findings, Orleans C-4
Community Resilience Building Workshop, Summary of Findings, Orleans C-5
Community Resilience Building Workshop, Summary of Findings, Orleans C-6
Community Resilience Building Workshop, Summary of Findings, Orleans C-7
Community Resilience Building Workshop, Summary of Findings, Orleans C-8
Community Resilience Building Workshop, Summary of Findings, Orleans C-9
Community Resilience Building Workshop, Summary of Findings, Orleans C-10
Community Resilience Building Workshop, Summary of Findings, Orleans C-11
Appendix D: Massachusetts Updated Climate Projections
(Given as workshop handouts)

Community Resilience Building Workshop, Summary of Findings, Orleans   D-1
CAPE COD BASIN

MUNICIPALITIES WITHIN CAPE COD BASIN:
Barnstable, Bourne, Brewster, Chatham, Dennis, Eastham, Falmouth, Harwich, Mashpee,
Orleans, Provincetown, Sandwich, Truro, Wellfleet, Yarmouth

Many municipalities fall within more than one basin, so it is advised to use the climate
projections for the basin that contains the majority of the land area of the municipality.
CAPE COD BASIN
Observed Mid-Century End of Century
Cape Cod Basin Baseline
1971-2000 Projected Change in Projected Change in Projected Change in Projected Change in
(°F) 2030s (°F) 2050s (°F) 2070s (°F) 2090s (°F)
Annual 49.92 +1.78 to +3.41 +2.41 to +5.39 +2.74 to +7.78 +3.11 to +9.52
Winter 31.92 +1.76 to +3.72 +2.50 to +5.70 +3.07 to +7.69 +3.35 to +9.20
Average
Spring 45.98 +1.73 to +3.23 +2.16 to +5.04 +2.59 to +6.74 +2.94 to +7.69
Temperature
Summer 68.15 +1.50 to +3.62 +2.08 to +5.66 +2.45 to +8.58 +3.03 to +10.43
Fall 53.32 +1.92 to +3.83 +3.03 to +5.86 +2.85 to +8.29 +3.35 to +10.06
Annual 57.74 +1.63 to +3.38 +2.19 to +5.23 +2.43 to +7.73 +2.82 to +9.26
Winter 39.76 +1.52 to +3.60 +2.10 to +5.27 +2.60 to +7.27 +3.01 to +8.65
Maximum
Spring 53.74 +1.44 to +3.11 +1.92 to +4.80 +2.30 to +6.54 +2.62 to +7.55
Temperature
Summer 75.95 +1.35 to +3.48 +1.95 to +5.60 +2.29 to +8.47 +2.68 to +10.27
Fall 61.24 +1.84 to +3.80 +2.81 to +5.83 +2.76 to +8.00 +3.08 to +9.97
Annual 42.09 +1.92 to +3.53 +2.67 to +5.50 +3.06 to +7.84 +3.42 to +9.67
Winter 24.08 +2.06 to +3.97 +2.90 to +6.16 +3.53 to +8.34 +3.81 to +9.85
Minimum
Spring 38.23 +1.74 to +3.47 +2.51 to +5.28 +2.71 to +6.93 +3.19 to +7.83
Temperature
Summer 60.35 +1.65 to +3.75 +2.23 to +5.72 +2.61 to +8.66 +3.32 to +10.64
Fall 45.41 +1.92 to +4.01 +3.14 to +5.88 +2.96 to +8.49 +3.63 to +10.28
The Cape Cod basin is expected to experience increased average temperatures throughout the
21st century. Maximum and minimum temperatures are also expected to increase throughout
the end of the century. These increased temperature trends are expected for annual and
seasonal projections.
Seasonally, maximum summer and fall temperatures are expected to see the highest projected
increase throughout the 21st century.
o Summer mid-century increase of 2 °F to 5.6 °F (3-7% increase); end of century increase
of 2.7 °F to 10.3 °F (4-14% increase).
o Fall mid-century increase of 2.8°F to 5.8°F (5-10% increase); end of century increase by
and 2.8 °F to 5.8 °F (5-16% increase).
Seasonally, minimum winter and fall temperatures are expected to see increases throughout the
21st century.
o Winter mid-century increase of 2.9 °F to 6.2 °F (12-26% increase); end of century
increase by 3.8 °F to 9.9 °F (16-41% increase).
o Fall mid-century of 3.1 °F to 5.9 °F (7-13% increase); end of century increase of 3.6 °F to
10.3 °F (8-23% increase).CAPE COD BASIN
Observed Mid-Century End of Century
Cape Cod Basin Baseline
1971-2000 Projected Change in Projected Change in Projected Change in Projected Change in
(Days) 2030s (Days) 2050s (Days) 2070s (Days) 2090s (Days)
Days with Annual 0.76 +1.17 to +3.89 +1.93 to +9.25 +2.46 to +21.33 +3.23 to +33.89
Maximum Winter 0.00 +0.00 to +0.00 +0.00 to +0.00 +0.00 to +0.00 +0.00 to +0.00
Temperature Spring 0.01 -0.02 to +0.09 -0.02 to +0.13 +0.00 to +0.20 +0.00 to +0.29
Over 90°F Summer 0.73 +1.06 to +3.58 +1.79 to +8.62 +2.34 to +19.96 +3.04 to +31.61
Fall 0.01 +0.06 to +0.28 +0.10 to +0.68 +0.13 to +1.26 +0.19 to +2.26
Days with Annual 0.06 +0.08 to +0.63 +0.19 to +1.88 +0.25 to +4.51 +0.26 to +9.49
Maximum Winter 0.00 +0.00 to +0.00 +0.00 to +0.00 +0.00 to +0.00 +0.00 to +0.00
Temperature Spring 0.00 +0.00 to +0.01 -0.00 to +0.02 +0.00 to +0.05 +0.00 to +0.08
Over 95°F Summer 0.06 +0.07 to +0.61 +0.18 to +1.85 +0.25 to +4.32 +0.26 to +9.11
Fall 0.00 +0.00 to +0.03 +0.00 to +0.06 +0.00 to +0.17 +0.00 to +0.42
Days with Annual 0.00 +0.00 to +0.07 +0.00 to +0.31 +0.01 to +0.80 +0.03 to +1.71
Maximum Winter 0.00 +0.00 to +0.00 +0.00 to +0.00 +0.00 to +0.00 +0.00 to +0.00
Temperature Spring 0.00 +0.00 to +0.00 +0.00 to +0.00 +0.00 to +0.00 +0.00 to +0.01
Over 100°F Summer 0.00 +0.00 to +0.07 +0.00 to +0.31 +0.01 to +0.80 +0.02 to +1.69
Fall 0.00 +0.00 to +0.00 +0.00 to +0.00 +0.00 to +0.01 +0.00 to +0.04
Due to projected increases in average and maximum temperatures throughout the end of the
century, the Cape Cod basin is also expected to experience an increase in days with daily
maximum temperatures over 90 °F, 95 °F, and 100 °F.
o Annually, the Cape Cod basin is expected to see days with daily maximum temperatures
over 90 °F increase by 2 to 9 more days by mid-century, and 3 to 34 more days by the
end of the century.
o Seasonally, summer is expected to see an increase of 2 to 9 more days with daily
maximums over 90 °F by mid-century.
o By end of century, the Cape Cod basin is expected to have 3 to 32 more days.CAPE COD BASIN
Observed Mid-Century End of Century
Baseline
Cape Cod Basin 1971-2000 Projected Change in Projected Change in Projected Change in Projected Change in
(Days) 2030s (Days) 2050s (Days) 2070s (Days) 2090s (Days)
Days with Annual 0.79 -0.08 to -0.37 -0.09 to -0.39 -0.14 to -0.4 -0.15 to -0.4
Minimum Winter 0.79 -0.08 to -0.37 -0.09 to -0.39 -0.14 to -0.4 -0.15 to -0.4
Temperature Spring 0.00 -0.01 to -0.00 -0.01 to -0.00 -0.01 to -0.00 -0.01 to -0.00
Below 0°F Summer 0.00 -0.00 to -0.00 -0.00 to -0.00 -0.00 to -0.00 -0.00 to -0.00
Fall 0.00 -0.00 to -0.00 -0.00 to -0.00 -0.00 to -0.00 -0.00 to -0.00
Days with Annual 104.75 -13.60 to -27.72 -19.29 to -41.91 -23.29 to -54.38 -24.54 to -66.71
Minimum Winter 70.7 -5.68 to -12.20 -7.00 to -20.22 -10.21 to -29.71 -11.46 to -38.36
Temperature Spring 23.8 -5.16 to -11.14 -7.22 to -14.64 -7.87 to -17.32 -9.50 to -18.96
Below 32°F Summer 0.00 -0.05 to -0.00 -0.04 to -0.00 -0.04 to -0.00 -0.05 to -0.00
Fall 10.16 -3.40 to -6.37 -4.69 to -8.2 -5.09 to -9.62 -5.34 to -10.71
Due to projected increases in average and minimum temperatures throughout the end of the
century, the Cape Cod basin is expected to experience a decrease in days with daily minimum
temperatures below 32 °F and 0 °F.
Seasonally, winter, spring and fall are expected to see the largest decreases in days with daily
minimum temperatures below 32 °F.
o Winter is expected to have 7 to 20 fewer days by mid-century, and 11 to 38 fewer days
by end of century.
o Spring is expected to have 7 to 15 fewer days by mid-century, and 10 to 19 fewer days
by end of century.
o Fall is expected to have 5 to 8 fewer days by mid-century, and 5 to 11 fewer days by end
of century.CAPE COD BASIN
Observed Mid-Century End of Century
Cape Cod Basin Baseline
1971-2000
(Degree- Projected Change in Projected Change in Projected Change in Projected Change in
Days) 2030s (Degree-Days) 2050s (Degree-Days) 2070s (Degree-Days) 2090s (Degree-Days)
Annual 5956.64 -475.48 to -913.39 -685.90 to -1374.26 -773.67 to -1828.23 -854.04 to -2171.56
Heating Winter 2996.33 -164.51 to -347.77 -220.16 to -520.87 -277.06 to -697.53 -304.13 to -831.96
Degree-Days Spring 1753.89 -152.01 to -285.19 -190.19 to -444.68 -229.91 to -584.74 -267.48 to -649.94
(Base 65°F)
Summer 94.49 -30.02 to -57.56 -41.95 to -69.89 -44.65 to -80.65 -44.99 to -85.45
Fall 1105.61 -131.82 to -268.87 -226.73 to -393.30 -215.14 to -547.22 -242.01 to -619.87
Annual 435.71 +144.74 to +364.43 +224.26 to +601.17 +250.48 to +965.18 +314.49 to +1226.21
Cooling
Winter nan +0.13 to +1.43 +0.38 to +3.50 +0.92 to +3.19 -0.34 to +3.91
Degree-Days
Spring 7.08 +3.48 to +9.44 +4.94 to +20.08 +5.86 to +34.34 +7.02 to +52.03
(Base 65°F)
Summer 384.03 +107.28 to +279.41 +148.81 to +457.16 +184.27 to +701.82 +229.32 to +875.35
Fall 43.77 +30.85 to +80.41 +41.77 to +138.18 +48.96 to +224.33 +71.67 to +296.72
Annual 2421.38 +343.19 to +690.79 +460.30 to +1078.12 +519.05 to +1678.13 +617.96 to +2104.38
Growing Winter 4.84 +0.24 to +9.74 +0.28 to +15.26 +2.10 to +25.74 +4.23 to +35.89
Degree-Days Spring 197.63 +50.56 to +105.22 +69.23 to +195.43 +77.64 to +277.13 +77.88 to +342.92
(Base 50°F)
Summer 1669.64 +137.95 to +332.36 +190.73 to +520.48 +224.93 to +789.31 +278.12 to +958.80
Fall 546.41 +107.92 to +248.13 +174.67 to +396.65 +168.86 to +571.84 +215.05 to +716.85
Due to projected increases in average, maximum, and minimum temperatures throughout the
end of the century, the Cape Cod basin is expected to experience a decrease in heating degree-
days, and increases in both cooling degree-days and growing degree-days.
Seasonally, winter historically exhibits the highest number of heating degree-days and is
expected to see the largest decrease of any season, but spring and fall are also expected to see
significant change.
o The winter season is expected to see a decrease of 220-521 degree-days by mid-century
(a decrease of 7-17%), and a decrease of 304-832 degree-days by the end of century (a
decrease of 10-28%).
o The spring season is expected to decrease in heating degree-days by 11-25% (190-445
degree-days) by mid-century, and by 15-37% (267-650 degree-days) by the end of
century.
o The fall season is expected to decreases in heating degree-days by 21-36% (227-393
degree-days) by mid-century, and by and 22-56% (242-620 degree-days) by the end of
century.
Conversely, due to projected increasing temperatures, summer cooling degree-days are
expected to increase by 39-119% (149-457 degree-days) by mid-century, and by 60-228% (229-
875 degree-days) by end of century. Seasonally, summer historically exhibits the highest number of growing degree-days and is
expected to see the largest decrease of any season, but the shoulder seasons of spring and fall
are also expected to see an increase in growing degree-days.
o The summer season is projected to increase by 11-31% (190.73-520.48 degree-days) by
mid-century, and by 17-57% (278-959 degree-days) by end of century.
o Spring is expected to see an increase by 35-99% (69-195 degree-days) by mid-century
and 39-174% (78-343 degree-days) by end of century.
o Fall is expected to see an increase by 32-73% (175-397 degree-days) by mid-century and
39-131% (215-717 degree-days) by end of century.
CAPE COD BASIN
Mid-Century End of Century
Observed
Cape Cod Basin Baseline
1971-2000 Projected Change in Projected Change in Projected Change in Projected Change in
(Days) 2030s (Days) 2050s (Days) 2070s (Days) 2090s (Days)
Annual 7.02 +0.16 to +1.76 +0.66 to +2.66 +0.45 to +2.92 +0.55 to +3.41
Days with
Winter 1.45 -0.10 to +0.62 +0.08 to +0.67 +0.02 to +1.04 +0.09 to +1.35
Precipitation
Spring 1.65 +0.08 to +0.65 +0.08 to +0.90 +0.22 to +1.05 +0.29 to +1.20
Over 1”
Summer 1.92 -0.18 to +0.55 -0.13 to +0.78 -0.40 to +0.66 -0.46 to +0.58
Fall 2.01 -0.23 to +0.62 -0.13 to +0.85 -0.31 to +0.94 -0.35 to +1.11
Annual 0.75 -0.04 to +0.43 +0.07 to +0.52 +0.08 to +0.71 +0.05 to +0.74
Days with
Winter 0.09 -0.05 to +0.16 -0.02 to +0.15 -0.02 to +0.20 -0.02 to +0.27
Precipitation
Spring 0.05 -0.03 to +0.13 +0.01 to +0.18 +0.02 to +0.19 -0.01 to +0.25
Over 2”
Summer 0.33 -0.07 to +0.15 -0.05 to +0.23 -0.05 to +0.20 -0.05 to +0.22
Fall 0.28 -0.04 to +0.13 -0.01 to +0.20 -0.01 to +0.23 -0.07 to +0.31
Annual 0.01 +0.00 to +0.03 +0.00 to +0.03 -0.01 to +0.05 -0.01 to +0.05
Days with
Winter 0.00 +0.00 to +0.00 +0.00 to +0.01 -0.00 to +0.00 +0.00 to +0.00
Precipitation
Spring 0.00 +0.00 to +0.01 +0.00 to +0.00 +0.00 to +0.01 +0.00 to +0.00
Over 4”
Summer 0.00 -0.01 to +0.02 -0.01 to +0.02 -0.01 to +0.03 -0.01 to +0.03
Fall 0.01 -0.00 to +0.02 +0.00 to +0.01 +0.00 to +0.02 +0.00 to +0.03
The projections for expected number of days receiving precipitation over one inch are variable
for the Cape Cod basin, fluctuating between loss and gain of days.
o Seasonally, the winter season is generally expected to see the highest projected
increase.
o The winter season is expected to see an increase in days with precipitation over one
inch of 0-1 days by mid-century, and by 0-1 days by the end of century.
o The spring season is expected to see an increase in days with precipitation over one inch
of 0-1 days by mid-century, and by 0-1 days by the end of century.CAPE COD BASIN
Observed Mid-Century End of Century
Baseline
Cape Cod Basin 1971-2000 Projected Change in Projected Change in Projected Change in Projected Change in
(Inches) 2030s (Inches) 2050s (Inches) 2070s (Inches) 2090s (Inches)
Annual 44.94 -1.08 to +3.47 -0.38 to +4.54 -0.78 to +5.79 -0.83 to +5.45
Winter 11.63 -0.40 to +1.24 -0.22 to +1.59 -0.05 to +2.10 -0.04 to +3.13
Total
Precipitation Spring 11.51 -0.04 to +1.48 -0.26 to +1.67 -0.21 to +2.08 +0.08 to +2.45
Summer 10.24 -0.95 to +1.19 -1.05 to +1.73 -1.64 to +2.00 -2.22 to +1.66
Fall 11.62 -0.96 to +0.90 -0.99 to +1.09 -1.40 to +1.64 -1.52 to +1.26
Similar to projections for number of days receiving precipitation over a specified threshold,
seasonal projections for total precipitation are also variable for the Cape Cod basin.
o The winter season is expected to experience the greatest change with a decrease of 2%
to an increase of 14% by mid-century, and an increase of 0-27% by end of century.
o Projections for the summer and fall seasons are more variable, and could see either a
drop or increase in total precipitation throughout the 21st century.
The summer season projections for the Cape Cod or basin could see a decrease
of 1.1 to an increase of 1.7 inches by mid-century (decrease of 10% to increase
of 17%), and a decrease of 2.2 to an increase of 1.7 inches by the end of the
century (decrease of 22% to increase of 16%).
The fall season projections for the Cape Cod basin could see a decrease of -1 to
an increase of 1.1 inches by mid-century (decrease of 9% to increase of 9%), and
a decrease of 1.5 to an increase of 1.3 inches by the end of the century
(decrease of 13% to increase of 11%).
Observed Mid-Century End of Century
Baseline
Cape Cod Basin 1971-2000 Projected Change in Projected Change in Projected Change in Projected Change in
(Days) 2030s (Days) 2050s (Days) 2070s (Days) 2090s (Days)
Annual 18.72 -1.06 to +1.99 -0.56 to +2.62 -0.34 to +3.63 -0.26 to +4.65
Winter 10.19 -0.52 to +1.53 -0.44 to +1.46 -0.31 to +1.83 -0.94 to +1.97
Consecutive
Dry Days Spring 11.59 -0.99 to +1.21 -0.86 to +1.50 -1.00 to +1.48 -1.34 to +1.58
Summer 15.38 -1.00 to +2.02 -0.83 to +2.61 -0.89 to +4.38 -1.03 to +5.26
Fall 13.05 -0.57 to +2.45 -0.04 to +2.29 +0.17 to +2.82 +0.04 to +3.45
Annual and seasonal projections for consecutive dry days, or for a given period, the largest
number of consecutive days with precipitation less than 1 mm (~0.04 inches), are variable
throughout the 21st century.
o For all the temporal parameters, the Cape Cod basin is expected to see a slight decrease
to an increase in consecutive dry days throughout this century.
o Seasonally, the fall and summer seasons are expected to continue to experience the
highest number of consecutive dry days.
The summer season is expected to experience a decrease of 1 day to an
increase of 5 days in consecutive dry days by the end of the century.Appendix E: Listening Session Public Comments Community Resilience Building Workshop, Summary of Findings, Orleans E-1
You can also read