Point-In-Time Count 2021 - Joint Albuquerque and Balance of State Report - New Mexico Coalition to End ...
←
→
Page content transcription
If your browser does not render page correctly, please read the page content below

2021
     Point-In-Time Count
Joint Albuquerque and Balance of State Report
Table of Contents
(1) Introduction                                                                                         4

   New Mexico Coalition to End Homelessness                                                              6

(2) Questions and Limitations                                                                            7

   Is the PIT count conducted every year?                                                                7

   Does this report reflect statewide data?                                                              7

   Are these numbers representative of the exact number of people experiencing homelessness?             7

   Are individual’s data shared with law enforcement or other government entities?                       7

   Is it ethical to “count the homeless”?                                                                7

   Do most people experiencing homelessness in Albuquerque come from outside of Albuquerque?             8

   Do most people experiencing homelessness in New Mexico come from outside of New Mexico?               8

   Do most people experiencing homelessness have mental illness or substance abuse issues?               8

   How is “homeless” defined?                                                                            8

   Why is Hispanic/Latino not classified as a race?                                                      9

   Limitations of the PIT count                                                                          9

(3) 2021 Point-In-Time Count Methodology                                                                10

   Summary of COVID-19 Considerations                                                                   10

   Data Sources                                                                                         10

       PIT unsheltered survey                                                                           10

            Additional questions                                                                        10

            Locations                                                                                   10

       HMIS Shelter and Transitional Housing data                                                       11

       Non-HMIS participating Emergency Shelters and Transitional Housing                               11

   Data Entry and Cleaning                                                                              11

   Unsheltered Survey Determinations                                                                    12

(4) Albuquerque CoC Results                                                                             13

   Overall Numbers                                                                                      13

                                                                                               Page 2 of 44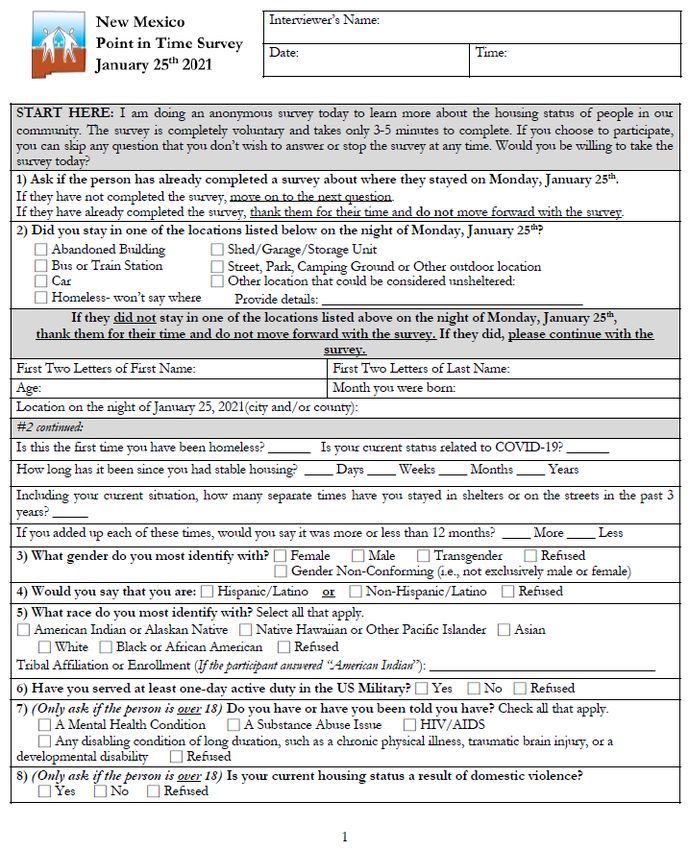
Unsheltered Data Breakdown                                                     14

       What you need to know about Albuquerque’s 2021 Unsheltered Data            17

       Other Findings of Note                                                     18

   Albuquerque Sheltered Data Breakdown - Emergency Shelter                       20

   Albuquerque Sheltered Data Breakdown - Transitional Housing                    22

   Albuquerque Sheltered Count Totals Overtime                                    24

       What you need to know about Albuquerque’s 2021 Sheltered data              25

           Emergency Shelter                                                      25

           Transitional Housing                                                   25

(5) Results - Balance of State CoC                                                26

   Overall Numbers                                                                26

   Unsheltered Data Breakdown                                                     27

   Balance of State Unsheltered Data Breakdown - by County                        30

   What you need to know about the 2021 BoS Unsheltered data                      31

       Other Findings of Note                                                     32

   Balance of State Sheltered Data Breakdown - Emergency Shelter                  34

   Balance of State Sheltered Data Breakdown - Transitional Housing               37

   What you need to know about the 2021 Sheltered data                            40

       Emergency Shelter                                                          40

       Transitional Housing                                                       40

(6) Acknowledgments                                                               41

(7) Resources                                                                     42

   HUD Requirements & definitions                                                 42

   Previous Balance of State and Albuquerque Data                                 42

   2021 Unsheltered Point-In-Time Count Survey                                    43

                                                                         Page 3 of 44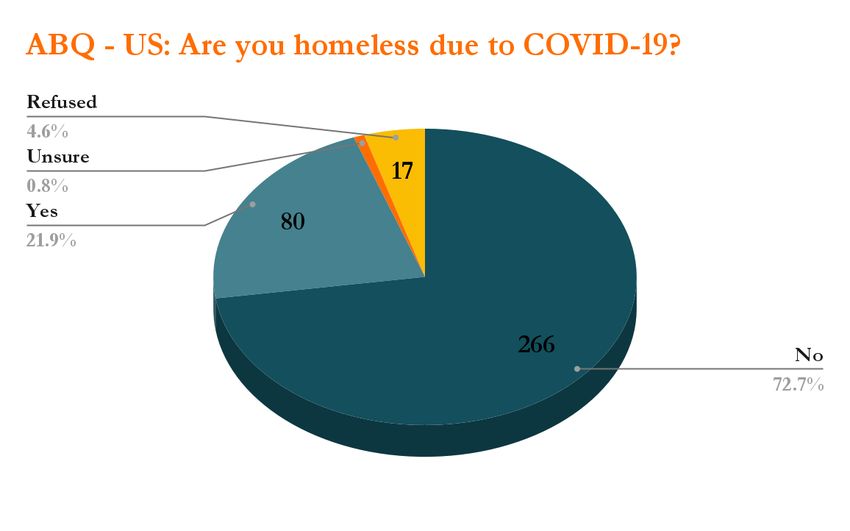
(1) Introduction
The Point-In-Time (PIT) count is a nationwide count of individuals and families experiencing homelessness within a community
on a given night, as outlined and defined by the U.S. Housing and Urban Development Department (HUD)1. HUD requires that
any community receiving funding from the McKinney-Vento Homeless Assistance Grants, which includes both the Continuum
of Care (CoC) and Emergency Solutions Grant (ESG) funding, conduct an annual Sheltered and a biennial Unsheltered PIT
Count. The City of Albuquerque receives funding from both streams for the Albuquerque area. The New Mexico Mortgage
Finance Authority receives ESG funding to distribute across the state. The New Mexico Coalition to End Homelessness receives
CoC funding for the Balance of State (the state outside of Albuquerque). Both CoCs and their memberships have identified that
communities benefit greatly from this engagement with our community members to better understand the trends, issues, gaps
and demographics of our fellow residents experiencing homelessness. By engaging in the annual count, we hope to provide better
information to service providers, governmental entities and everyday residents of New Mexico to work together on developing
effective and solution-based interventions in addressing homelessness across the state.

This year, 2021, the night of the PIT count took place on Monday, January 25th. In order to most accurately and safely count the
number of people experiencing homelessness in New Mexico on January 25th, NMCEH coordinated activities for the PIT count
that lasted up to seven days immediately following the night of the PIT, January 26th - February 1st. In Albuquerque, NMCEH
coordinated the unsheltered PIT in partnership with the City of Albuquerque and numerous homeless service providers across
the City. For the Balance of State, NMCEH coordinated the PIT with various partner agencies and entities in communities across
the state of New Mexico, with larger organizational hubs in Las Cruces, Farmington, Gallup, and Santa Fe. During this we, we
had a number of street outreach teams, and volunteers from agencies across the state canvassing neighborhoods, alleys, parks,
high-traffic areas, known encampments and points of congregation, meal service sites, and general service sites to engage and
survey people who identified as being in a homeless situation on the night of January 25th. This change from street outreach
teams and volunteers to only street outreach teams and volunteers from partner agencies was needed as a precaution during the
COVID-19 Pandemic as it ensured there was accurate access to limited PPE and staff with training in COVID-19 precautions
were being utilized to limit any potential furthering of community spread. The purpose of the survey conducted was to collect
demographic data, information about the person’s experience of homelessness, and data that could be used to better fill in the
community’s knowledge of systemic gaps in services for people experiencing homelessness.

People residing in Emergency Shelters (ES) and Transitional Housing (TH), known for the purposes of this count as Sheltered,
were counted by a combination of information from our statewide Homeless Management Information System (HMIS) and a
survey for programs that do not participate in HMIS (usually domestic violence, youth or non-federally funded providers). HMIS
stores enrollment and demographic data for homeless individuals and families staying in ES or TH. People residing in TH or ES
on the night of the count were not given the same survey as Unsheltered persons experiencing homelessness as the data for the
Sheltered population was collected through the program survey or HMIS data.

The combination of the Sheltered and Unsheltered count provides a snapshot of the homeless population in New Mexico on one
winter night. The snapshot is then shared with the community in this biennial report. The report serves both as a way to meet the
federal reporting requirement for the PIT, but also to explain the data and to provide context to the community about people
experiencing homeless in New Mexico.

1
    https://www.hudexchange.info/programs/hdx/guides/pit-hic/#2021-pit-count-and-hic-guidance-and-training

                                                                                                                     Page 4 of 44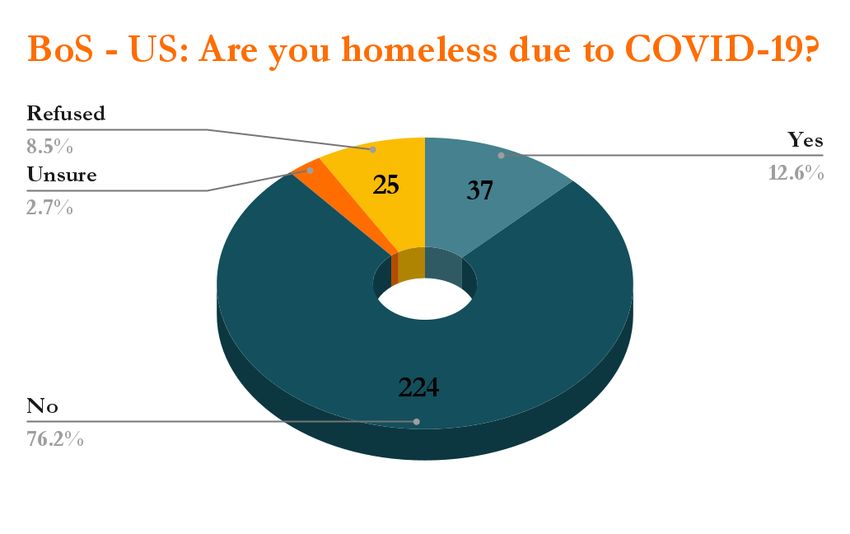
While the PIT count is currently the most widely-used methodology for enumerating people experiencing homeless, it is not an
exact count and has a margin of error. The margin of error is due to the fact that the numbers are greatly affected by the level of
community engagement, methodology, weather, incorrect data submissions, data being largely self-reported, etc. Numbers in this
report should be taken to indicate trends rather than exact, unwavering figures. Conducting the PIT count during a year in which
there was a global pandemic, with a variety of restrictions to protect all citizens, has created a rather different look to any data
gathered, as it was more difficult than in past years to gather more accurate information on the amount of people experiencing
homelessness due to lack of community volunteers, limited geography and time frames, closure of regular services due to
restrictions, and a population experiencing homelessness that was potentially being moved constantly and rapidly from former
points of congregation.

                                                                                                                            Page 5 of 44
New Mexico Coalition to End Homelessness
The New Mexico Coalition to End Homelessness (NMCEH) is a statewide nonprofit committed to the planning, coordination,
awareness, and advocacy of reducing and bringing an end to homelessness across the state. To ensure inclusivity of diverse
stakeholders throughout the state, NMCEH membership is comprised of numerous organizations, people and entities that are
committed to ending homelessness in New Mexico, such as: nonprofit homeless service providers, government entities, private
businesses, community advocates, public housing agencies, hospitals, universities, affordable housing developers, and people who
have lived experience of homelessness. NMCEH develops recommendations for communities to create resolutions for people
experiencing homelessness through programs and services that fill needs within the community.
NMCEH is contracted by the City of Albuquerque to coordinate the activities of the Albuquerque Continuum of Care (CoC).
For the rest of the state, known as the Balance of State (BoS) CoC, NMCEH serves as the Continuum of Care. A CoC is
composed of organizational representatives including, but not limited to: nonprofit homeless service providers, victim service
providers, faith-based organizations, governments, businesses, advocates, public housing agencies, school districts, social service
providers, mental health agencies, hospitals, universities, affordable housing developers, law enforcement, organizations that serve
homeless and formerly homeless veterans, and people who have lived experience of homelessness. The CoC is more than just a
funding source for housing, it is also a level of community collaboration that supports gaining access to housing and supportive
services for everyone experiencing homelessness.
As the lead for the Continuums of Care, NMCEH coordinates the Point-in-Time counts for communities across the State of
New Mexico. The following report goes on to explain the efforts that the Albuquerque and Balance of State CoCs took to
conduct the Unsheltered and Sheltered Point-In-Time Count in 2021.
Page 6 of 44(2) Questions and Limitations
Is the PIT count conducted every year?
The PIT count is conducted every year. However, HUD only requires that communities include an Unsheltered count biennially
(every other year). NMCEH publishes this report on years in which the Unsheltered count is conducted. Due to the increased
need to understand accurate data on people experiencing homelessness, NMCEH, with community support, intends to begin
conducting the unsheltered PIT count yearly beginning in 2022, on a trial basis to ascertain how it will impact providers,
volunteers, and the community beyond collecting more accurate and yearly data points.
Does this report reflect statewide data?
The state of New Mexico has two Continuums of Care (CoC): Albuquerque CoC and the Balance of State CoC. Each CoC
conducts separate counts for their respective geographical coverage area. Though counts are conducted separately for each CoC,
this report will include data for both Albuquerque and the Balance of State, divided into separate sections. The combination of
the two CoC’s provides geographic coverage of the entire state.
Are these numbers representative of the exact numberof people experiencing
homelessness?
These numbers should be reviewed to understand trends over time instead of taken as exact figures. Hundreds of hours were
spent collecting, entering, and validating this data, however, PIT count numbers were submitted or collected by different
community members, service providers, and individuals currently experiencing homelessness. The reliability of this count can be
influenced by many factors, such as: number of enumerators, community engagement, understanding of training, location and
time of the survey, and weather. Additionally, most of this data is self-reported directly from people experiencing homelessness.
As there were community and HUD enforced restrictions in place for the 2021 count, the numbers reflected may be drastically
lower than in previous years or show an inaccurate trending in data.
Are individual’s data shared with law enforcement or other government entities?
Data is shared only in aggregate form and is distributed equally to all community members. The unsheltered survey does not
collect names and only collects enough information to de-duplicate surveys; there is never enough information provided, or asked
for, to identify an individual person.
Is it ethical to “count the homeless”?
The PIT count is a federal requirement. It is implemented with training for the enumerators, who are directed in various forms of
compassionate outreach. We seek to count how many people there are experiencing homelessness to understand the causes of
their experience, to develop new interventions, and to connect them to services. We count people experiencing homelessness
because we do not want them to become invisible. We also understand that the language of “counting” and “counting the
homeless” is problematic, and are always looking for ways to refine HUD’s language with respect and acknowledgement for
people experiencing homelessness.
Page 7 of 44Do most people experiencing homelessness in Albuquerque come from outside of
Albuquerque?
According to the data collected from the unsheltered survey, most people experiencing unsheltered homelessness in Albuquerque
were residents of Albuquerque prior to becoming homeless.
Do most people experiencing homelessness in New Mexico come from outside of New
Mexico?
According to the data collected from the unsheltered survey, the majority of people experiencing homelessness within New
Mexico came from communities (or Indigenous lands) within the geographic confines of the state of New Mexico or the Navajo
Nation.
Do most people experiencing homelessness have mental illness or substance abuse issues?
Our report showed that in Albuquerque, 30.19% of the surveyed adults experiencing homelessness self-reported having a serious
mental illness (SMI) and in the Balance of State, 37.92%. Regarding substance use disorder (SUD), 25.5% of surveyed adults in
Albuquerque self-reported having one, while the Balance of State totaled at 68.3%.
How is “homeless” defined?
For this report, the HUD definition of homeless was used to determine living situation2. This does not include people who are
doubled up with family or friends, couch surfing, unstable living conditions, or residing in substandard living conditions nor does
it include additional federal or local definitions of homelessness. NMCEH notes the differences in definitions and that this may
create differences between datasets using other definitions of homelessness, or create a viewpoint of persons experiencing
homelessness that the community may believe looks different based on how homelessness is defined outside of HUD funded
programs. The PIT counts two types of living situations: those residing in an unsheltered situation and those residing in a
sheltered situation on the night of January 25th, 2021.
Sheltered Homeless: are those who, on the night of the count, are residing in an emergency shelter, motel paid through a provider,
or transitional housing program.
Unsheltered Homeless: are those that are sleeping in places not meant for human habitation, including: streets, parks, alleys, the
Bosque, underpasses, transfer stations, all night commercial establishments (e.g., waiting rooms, laundromats, restaurants),
abandoned buildings, building roofs or stairwells, caves, campgrounds, vehicles, and other similar places.
Why is Hispanic/Latino not classified as a race?
This is an example of how Federal terminology does not always line up with how people actually identify. For reporting, HUD
uses the federal definition of Hispanic or Latino3 as an ethnicity that refers to a person of Cuban, Mexican, Puerto Rican, Central
or South American, or other Spanish culture or origin and states that Hispanics or Latinos can be of any race. Though this does
not always mean that people of any race from any potential Spanish origin may identify as Hispanic or Latino.
2
https://files.hudexchange.info/resources/documents/HEARTH_HomelessDefinition_FinalRule.pdf
3
https://en.wikipedia.org/wiki/Hispanic_and_Latino_Americans & https://www.doi.gov/pmb/eeo/directives/race-data
Page 8 of 44Limitations of the PIT count
(please see Summary of COVID-19 considerations for changes to these)
A. Multi-day count
NMCEH coordinates the PIT count over multiple days. This practice introduces many variables that are difficult to control
during data entry and clean-up. The multiple-day count increases the likelihood of duplicated surveys. It also relies on people
retroactively self-reporting that they were homeless on the night of the count, up to a week after the night in question. It is
possible that persons who found temporary or permanent shelter/housing in the following days after the night of the count,
using this method those persons would not end up included in the count. Additionally, through this method surveyors are out
conducting the count during the day, when many people could be traveling, indoors with friends and family, or visiting a day
program that may not be covered by the efforts.
B. Refusals
Feedback from people conducting the PIT count indicated that it is difficult to discern what may count as a full refusal to answer
a question or participate entirely, as not all participants may blatantly refuse, but rather avoid answering. These circumstances can
be hard to navigate and are common. People experiencing homelessness are often concerned about participation in surveys for
various reasons.
C. Missing data
Some surveys are returned with incomplete data. Data on other household members is the most sparsely collected. Because names
are not collected for children, it was not possible to reliably "de-duplicate" this population. For example, if they were staying with
other youth or adults according to the survey, it is likely, though not guaranteed, that the others were surveyed as well.
D. HUD racial/ethnicity categories
People do not always answer these questions in the way HUD intended, and people who are multi-racial are required to be
grouped into the two-or-more race category even if they do not identify as such. This greatly obscures individuals with diverse
racial backgrounds, and may especially disproportionally reduce the Hispanic/Latino count. Surveyors at times find the Federal
racial/ethnic distinctions confusing as well, and this creates difficulty in helping respondents to understand the distinction in the
survey.
Page 9 of 44(3) 2021 Point-In-Time Count Methodology
Summary of COVID-19 Considerations
HUD placed several considerations on communities for conducting the unsheltered Point in Time count during the COVID-19
Pandemic. In order to slow community spread, HUD asked that community volunteers not be used, unless they were under 55,
had training in COVID safe engagement practices and there was enough PPE. Due to the status of the pandemic in New Mexico
at the time of the count, it was determined that there was not capacity to recruit and provide adequate PPE for a large number of
volunteers to support the count. This put the bulk of the work of surveying on the shoulders of street outreach and other staff of
homeless service agencies. The removal of volunteers lowered the capacity to survey large amounts of geography in multiple
communities and also limited times of surveying due to the capacity of agencies. Though the time to survey community members
was increased for a full week following the night of the count on January 25, 2021, limitations still existed in terms of the amount
and ability of surveyors, and geographic areas able to be covered. Due to these considerations for COVID-19, a decrease in
numbers was anticipated, as was an increase in higher rates of duplicate surveys.
Data Sources
PIT unsheltered survey
The survey used a 10-question survey (with 6 additional questions at the end) developed through collaboration with NMCEH
and the community partners across the state who expressed interest in supporting. Completed surveys were entered into an online
form which could collate the information into a spreadsheet to organize all responses for further data cleaning. The survey used
by both CoCs is included at the end of this report for reference.
Additional questions
Additional questions were added to the unsheltered survey that were not captured for the sheltered count through HMIS data or
the Non-HMIS agency survey. These questions are used to understand trends of people residing in an unsheltered living
situation. The following questions were added:
- How long have you lived here (City/Town/Village)?
- What is the last city or state you resided in before coming here?
- What brought you here?
- Were you homeless when you came here?
- Are you attending school?
- Are you employed?
Locations
A. Site-based
Outreach teams and site-based staff conducted the survey with people as they accessed participating or known site-based services.
Site-based services are those services that are located in a set place that people have to travel to in order to access. Examples of
participating agencies include meal service sites and community health centers. Where possible, the unsheltered survey was
administered to every person accessing services during the week following the night of the PIT. However, at some sites it was not
possible to administer the survey to every person who accessed services during the week-long window and some people refused,
Page 10 of 44were sheltered on the night of the count, had already completed the survey, or a known service site had to temporarily close due
to the pandemic.
B. Street Outreach
NMCEH worked with outreach teams in Albuquerque, Santa Fe, Gallup, and Las Cruces to identify key locations to canvas and
emphasize for their outreach efforts, this included places where persons were known to be rough-sleeping or congregating. Due
to the COVID-19 Pandemic and placing importance on the safety and wellbeing of both street outreach and people experiencing
homelessness to decrease transmission as much as possible, coverage in all communities was directed to places identified as “hot
spots,” current street outreach engagement sites, and as many day sites that were still in operation with pandemic restrictions.
Additionally, there was limited volunteer participation as planning included ensuring that the persons supporting the count had
proper access to PPE and were informed and practiced at using COVID-19 safe methods of engagement. Street outreach workers
went to designated areas at specified times to conduct surveys and try to connect people to services. All surveys were returned to
the NMCEH or completed online by street outreach that had requested access to the digital survey. NMCEH staff entered the
surveys onto a digital form and then generated a spreadsheet from the data on the form. Then staff used the first two letters of a
respondent’s first name, first two letters of the last name, age and identified gender to create a unique identifier for this person.
Duplicate records were eliminated if the unique identifier and the answer to where the person slept on January 25th, 2021 were the
same.
HMIS Shelter and Transitional Housing data
Demographic information for individuals staying in emergency or transitional shelters on January 25th, 2021 was extracted from
the HMIS database. This data was similar to the data collected through the unsheltered survey minus the additional unsheltered
question list above.
Non-HMIS participating Emergency Shelters and Transitional Housing
Shelters and Transitional Housing programs that were not participating in HMIS completed an alternative survey that was
returned to NMCEH, with particular questions depending on the type of program. All questions ultimately reflected general
demographic information that would be captured in HMIS. Due to the sensitive nature of the populations of these Shelters and
Transitional Housing programs (e.g., domestic violence shelters), only aggregated data was collected.
Data Entry and Cleaning
A. General data cleaning
In order to ensure data was accurate, NMCEH completed extensive data clean-up. This involved logic checks on variables to make
sure calculated fields were correct, manually reviewing and correcting spelling errors, and comparing population totals with
outside agencies in order to establish accuracy.
B. Duplicates
Because NMCEH coordinated the PIT count over a week-long period, which can lead to a higher amount of duplicated records,
the unsheltered surveys were included if there was enough qualitative data provided to de-duplicate the record. To remove
duplicates from the completed datasets, NMCEH searched for duplicate unique identifiers within the unsheltered datasets.
Within the Sheltered count, HMIS, and comparable database, data is able to automatically remove duplicate records.
Page 11 of 44Unsheltered Survey Determinations
Additional determinations were needed to satisfy HUD reporting requirements for populations and subpopulations, the
information collected in the unsheltered survey allowed NMCEH to make the following determinations:
A. Literal Homelessness
Question #2 on the unsheltered survey asked where a person was residing on the night of the count, rather than asking if they are
homeless. NMCEH used the answers to determine if the living condition matched HUD’s definition of literal homelessness.
Persons not experiencing literal homelessness (as defined by HUD) were excluded from the Unsheltered PIT count; if these
persons were staying in an Emergency Shelter or Transitional Housing program, they would be included in the sheltered count
through our other data collection methods.
B. Chronically Homeless
Chronically homeless individuals, per HUD’s definition, must be homeless and living or residing in "a place not meant for human
habitation," or in an emergency shelter continuously for at least one year or on at least four separate occasions in the last three
years where the combined length of time homeless in those occasions is at least 12 months, and the individual must have a
disabling condition that is expected to be long lasting and impeding their ability to sustain housing independently.4 NMCEH
uses questions 2 and 7 to determine if a person may be experiencing chronic homelessness.
C. Households Without Children
Households without children included adult singles and couples with no children.
D. Households with at least one adult and one child
Otherwise known as families, these households currently had at least one adult and one minor.
E. Households with only children
These households included individual(s) under the age of 18 with no legal guardian or parent.
F. Parenting Youth
Parenting youth include youth (age 18-24) that have at least one minor in their care and no adults, over the age of 24, in the
household.
G. Unaccompanied Youth and minors
Unaccompanied youth includes youth between (age 18-24) who live without a parent or legal guardian. Unaccompanied minors
included children age 17 or younger who live without a parent or legal guardian.
4
https://files.hudexchange.info/resources/documents/Defining-Chronically-Homeless-Final-Rule.pdf
Page 12 of 44(4) Albuquerque CoC Results
Overall Numbers
The following data was collected from unsheltered and sheltered people experiencing homelessness and are organized by living
situation as captured for January 25th, 2021.
Table 1 - ABQ - All 2021. The total estimated number of households experiencing homelessness in Albuquerque on January
25th, 2021.
Emergency Transitional
Shelters Housing Unsheltered Total
Households
with at least
one Child 91 32 3 126
Households
without
children 563 94 351 1008
Households
with only
Children 10 8 0 18
Total 664 134 354 1152
Figure 1 - US-ABQ All Overtime. Total estimated number of people counted during the Albuquerque Point-in-Time counts
from 2009 - 2021
Page 13 of 44Unsheltered Data Breakdown
● Total Unsheltered Chronic Homeless - 172 (42%) ● Number of families fleeing domestic violence: 2 out
● Homeless due to COVID-19 - 80 (21%) of 3 (66%)
● First-time homeless - 153 (37%) ● Adults with a Serious Mental Illness (SMI) - 103
● Homeless due to Domestic Violence - 47 (12%) (25%)
● Number of families - 3 ● Adults with Substance Use Disorder - 105 (25%)
Figure 2 - US-ABQ Gender. This is the Gender breakdown of data for people residing in an unsheltered location on the night
of January 25th.
Figure 3 - US-ABQ Age Range. This is the Age breakdown of data for people residing in an unsheltered location on the night
of January 25th
Page 14 of 44Figure 4 - US-ABQ Ethnicity. This is the Ethnicity breakdown of data for people residing in an unsheltered location on the
night of January 25th.
Figure 5 - US-ABQ Race. This is the Race breakdown of data for people residing in an unsheltered location on the night of
January 25th.
Page 15 of 44Figure 6 - US-ABQ Overtime. Estimated number of people living in an unsheltered living condition in Albuquerque during
the PIT Counts 2009-2021.
Figure 7- US-ABQ Racial Overrepresentation. Percentages of people surveyed who were living in an unsheltered condition in
2021 compared to 2019 Albuquerque census data.5
5
https://www.census.gov/quickfacts/albuquerquecitynewmexico
Page 16 of 44What you need to know about Albuquerque’s 2021 Unsheltered Data
NMCEH used similar methodologies for the Unsheltered 2015, 2017, 2019 and 2021 PIT counts, so comparison of the four
different counts is reasonable. In 2021, 413 people reported living in a place not meant for human habitation on the night of
January 25th, while this was roughly a 27% decrease from 2019’s count where 567 people reported living in a place not meant for
human habitation on the night of January 25th. This does not mean that there has necessarily been a decrease in the amount of
people sleeping in places not meant for human habitation. Due to the restrictions placed on the count by the COVID-19
pandemic from local and Federal regulations, outreach teams could logistically only cover smaller geographic areas for shorter
amounts of time. Coupled with ongoing removal of encampments during the pandemic, this created areas of constantly shifting
populations which would hamper effective engagement on a limited scale. Also, in an effort to support safe housing of people
experiencing homelessness during the pandemic, many shelters were able to add extra beds and with the creation of Wellness
Motels, this allowed for more people to be sheltered on the night of the count - contributing to lower numbers.
Due to the local and Federal restrictions imposed by the COVID-19 Pandemic, PIT Planning in Albuquerque moved to aligning
times and locations of outreach with individual street teams, any ongoing locations, and targeting areas where they had ongoing
engagement or had high levels of engagement. In order to try to cover the greatest amount of area in the City of Albuquerque, the
outreach lasted from January 26 - 29. There was a severe winter storm the week of the count, and it’s drastic drop in temperatures
impacted both teams and unsheltered persons experiencing homelessness, some teams self-reported that this impacted their ability
to find and connect with individuals. Due to the restrictions of the pandemic, street teams signed up for geographic areas by days
and times they were available in order to reduce the likelihood of duplication. Despite the noted increase in knowledge within the
Albuquerque CoC about where people experiencing homlessness are more likely to be residing or accessing services, lower
numbers of persons experiencing unsheltered homelessness were reported than in 2019. The Unsheltered PIT counts of 2017
and 2019 utilized only staff trained in street outreach to conduct outreach activities and volunteers at site-based locations. Due to
the COVID-19 restrictions, community volunteers were not used, rather staff at day services, existing street outreach staff and
agency staff who conduct outreach were utilized. This lowered the number of available surveyors, and limited the count
geographically.
Page 17 of 44Other Findings of Note
1. Transgender Representation
Five people surveyed in 2021 identified as transgender. While this number accounts for a relatively low population percentage
(1.21% of total people surveyed), there are still some important trends to note.
The number of people experiencing unsheltered homelessnes identifying as transgender has steadily decreased since 2017 from
3.13% down to 1.21% in 2021. This period also saw a significant decrease in the number of youth aged 18-24 in this population,
from 25% of people identifying as transgender experiencing unsheltred homelessness in 2017 down to 0 persons in 2021. It is
possible that community efforts to address the unique challenges of unsheltered LGBTQIA youth may have had a positive effect
on transgendered persons experiencing unsheltered homelessness.
Another trend identified in 2021 shows that of the five persons identifying as transgender, two report that their episode of
homelessness is the result of fleeing domestic violence, accounting for 40% of the responding population. This finding may
indicate a closer look at the correaltion of interpersonal relationship violence and homelessness for people identifying as
transgender.
2. COVID-19 and Unsheltered Homelessness
An additional question was added to the 2021 unsheltered survey to provide data on the impact of COVID-19 on the inflow of
people experiencing homelessness in the city of Albuquerque. The majority of respondents (266 total, 72.7%) reported that
COVID-19 was not a cause of their current episode of homelessness. Only 80 people answered “yes”, accounting for 21.9% of
responses collected.
It is important to remember that the Unsheltered PIT Count does not provide a complete picture of people in our community.
Not everyone agrees to participate in the survey, and it is not likely that we were able to locate everyone staying outside during
Page 18 of 44street outreach activities. Even with these limitations, the PIT Count provides important data for our community that can be
used to develop effective strategies for ending homelessness in Albuquerque.
Figure 8 - US-ABQ COVID-19 Responses. This is the breakdown of responses to this question collected during the 2021
unsheltered PIT count.
Page 19 of 44Albuquerque Sheltered Data Breakdown - Emergency Shelter
Of the data collected from Emergency Shelters:
● 163 (17%) identified as American Indian or Alaskan Native ● Adults with a Serious Mental Illness (SMI) - 253 (35%)
● 364 (39%) identified as chronically homeless ● Adults with Substance Use Disorder - 155 (21%)
● 563 (85%) identified as households without children ● 73 adults (11%) identified as fleeing domestic violence
(singles)
Figure 9 - ES -ABQ Gender. This is the Gender breakdown of data for people residing in an emergency shelter on the night of
January 25th.
Figure 10 - ES-ABQ Age Range. This is the Age breakdown of data for people residing in an emergency shelter on the night of
January 25th.
Page 20 of 44Figure 11 - ES-ABQ Ethnicity. This is the Ethnicity breakdown of data for people residing in an emergency shelter on the night
of January 25th.
Figure 12 - ES-ABQ Race. This is the Race breakdown of data for people residing in an emergency shelter on the night of
January 25th.
Page 21 of 44Albuquerque Sheltered Data Breakdown - Transitional Housing
Of the data collected from Transitional Housing Programs:
● 44 (20%) identified as American Indian or Alaskan Native ● Adults with Substance Use Disorder - 62 (47%)
● 94 (70%) identified as households without children (singles) ● 11 (8%) identified as fleeing domestic violence
● Adults with a Serious Mental Illness (SMI) - 25 (19%)
Figure 14 - TH -ABQ Gender. This is the Gender breakdown of data for people residing in transitional housing on the night of
January 25th.
Figure 15 - TH -ABQ Age. This is the age breakdown of data for people residing in transitional housing on the night of January
25th.
Page 22 of 44Figure 16 - TH -ABQ Ethnicity. This is the ethnicity breakdown of data for people residing in transitional housing on the
night of January 25th.
Figure 17 - TH -ABQ Race. This is the race breakdown of data for people residing in transitional housing on the night of
January 25th.
Page 23 of 44Albuquerque Sheltered Count Totals Overtime
Figure 18 - ES -ABQ Overtime. Estimated number of people residing in an emergency shelter in Albuquerque during the PIT
Counts 2009-2021.
Figure 19 - TH -ABQ Overtime. Estimated number of people residing in transitional housing in Albuquerque during the PIT
Counts 2009-2021.
Page 24 of 44What you need to know about Albuquerque’s 2021 Sheltered data
Emergency Shelter
This data only encompasses Emergency Shelters that are within the Albuquerque city limits. Emergency Shelters that are
physically located outside of the city limits are considered part of the Balance of State CoC and will be included in the next
section of this report.
NMCEH’s methodology for aggregating Emergency Shelter data has not changed much over the years, therefore comparison of
the different counts is practical. In 2021, we recorded 940 people who were residing in Emergency Shelters on the night of
January 25th. This is an increase of ~16% from the 808 persons in the 2020 Sheltered PIT count. This increase of persons in
Emergency Shelters aligns with Albuquerque’s increased number of shelter beds and the inclusion of Wellness Motels during the
COVID-19 pandemic..
Based on the aggregated data, we see that the total number of people that identified as American Indian or Alaskan Native is
proportionately less than those residing in an unsheltered situation. American Indians or Alaskan Natives make up 17% of
persons residing in shelters and 29% of persons who were unsheltered. We see people that identify as White make up roughly 603
(64%) of all people residing in emergency shelters, and is larger than those residing in an unsheltered situation, 240 (58%).
Also, we see that adults that reported a mental illness decreased among people residing in emergency shelters compared to
unsheltered. Nearly twice as many people that were living in an unsheltered situation reported having a mental illness, wherein
103 (25.1%) unsheltered reported and 253 (35.1%) for people residing in shelters. Additionally, higher numbers of unsheltered
persons experiencing homelessness reported substance abuse, as 105 (25.6%) identified as having substance abuse issues compared
to 155 (21.5%) persons in Emergency Shelters.
The sheltered PIT count does rely heavily on accurate and timely data from Emergency Shelters. Data collected does not provide
an exact number, but rather a snapshot of people in our community. Even with these limitations, the sheltered PIT Count
provides important data for our community that can be used to develop effective strategies for ending homelessness in
Albuquerque.
Transitional Housing
Transitional housing in Albuquerque is unique and largely targeted to certain subpopulations, including, and not limited to:
Veterans, people that have substance abuse and mental illness, or survivors of domestic violence. We see that the demographic
breakdown reflects the program constructions. As with Emergency Shelters, the Transitional Housing PIT count includes
Transitional Housing programs that are outside of the Albuquerque City limits. Transitional Housing programs that are
physically located within the Albuquerque City limits are part of the Albuquerque CoC and were included in an earlier section of
this report.
NMCEH’s methodology for aggregating Transitional Housing data has not changed much over the years, therefore comparison
of the different counts is practical. In 2021, we recorded 214 people who were residing in a Transitional Housing on the night of
January 25th. This is an increase of 1.4% from the 2020 Sheltered PIT count of 211 persons residing in TH.
Page 25 of 44(5) Results - Balance of State CoC
Overall Numbers
The following data was collected from unsheltered and sheltered people experiencing homelessness and are organized by the living
situation as captured for January 25th, 2021.
Table 2. The total estimated number of households experiencing homelessness in Balance of State on January 25th, 2021.
Emergency Transitional
Shelters Housing Unsheltered Total
Households
with at least
one Child 65 25 12 102
Households
without
children 465 28 293 786
Households
with only
Children 15 2 0 17
Total 545 55 305 905
Figure 19 - US-BoS All Overtime. Total estimated number of people counted during the Balance of State Point-in-Time
counts from 2009 - 2021.
Page 26 of 44Unsheltered Data Breakdown
● Total Unsheltered Chronic Homeless - 185 (51%) ● 2 out of the 12 families were fleeing DV (16%)
● Homeless due to COVID-19 - 37 (12%) ● Adults with a Serious Mental Illness (SMI) - 132
● First-time homeless - 75 (21%) (39%)
● Homeless due to Domestic Violence - 31 (8%) ● Adults with Substance Use Disorder - 236 (70%)
● Number of families - 12
Figure 20 - US-BoS Gender. This is the Gender breakdown of data for people residing in an unsheltered location on the night
of January 25th.
Figure 21 - US-BoS Age. This is the Age breakdown of data for people residing in an unsheltered location on the night of
January 25th.
Page 27 of 44Figure 21 - US-BoS Ethnicity. This is the Ethnicity breakdown of data for people residing in an unsheltered location on the
night of January 25th.
Figure 23 - US-BoS Race. This is the Race breakdown of data for people residing in an unsheltered location on the night of
January 25th.
Page 28 of 44Figure 24 - US-BoS Overtime. Estimated number of people living in an unsheltered living condition in the Balance of State
during the PIT Counts 2009-2021.
Figure 25- US-BoS Racial Overrepresentation. Percentages of people surveyed who were living in an unsheltered condition in
2021 compared to 2019 NM State census data.6
6
https://www.census.gov/quickfacts/NM
Page 29 of 44Balance of State Unsheltered Data Breakdown - by County
Figure 26 - US-BoS County Totals. Number of persons surveyed during the 2021 PIT count by county.
Page 30 of 44What you need to know about the 2021 BoS Unsheltered data
In 2021, 365 people reported living in a place not meant for human habitation on the night of January 25th, while this was a
marked decrease (roughly 47.7%) from 2019’s count where 692 people reported living in a place not meant for human habitation
on the night of January 25th, . This does not mean that there has necessarily been a decrease in the amount of people sleeping in
places not meant for human habitation. Due to the restrictions placed on the count by the COVID-19 pandemic from local and
Federal regulations, outreach teams could logistically only cover smaller geographic areas for shorter amounts of time.
As the county data illustrates (Figure 25), only 14 out of 33 total counties in New Mexico were accounted for in 2021, with some
counties, such as Otero, far weighing the rest. Again, this data should not be interpreted to indicate that there are more people
experiencing unsheltered homelessness in one county than another, as significant shifts in count methodology due to COVID-19
restrictions and county-level community engagement. Seven counties decreased by 100% from 2019 in the 2021 count, with an
additional 9 counties reporting decreases averaging around ~70%. Only four counties reported increases, most notably Otero
county by 117, or 100% up from 2019’s count of zero. Some counties that formerly participated could not participate in 2021,
whereas others who had not participated before were able to join in supporting the 2021 count.
Due to the local and Federal restrictions imposed by the COVID-19 Pandemic, PIT Planning in the Balance of State focused on
engaging existing staff at community agencies serving individuals experiencing homelessness. as opposed to recruiting volunteers.
This lowered the number of available surveyors, and limited the count geographically. Additionally, there was a severe winter
storm the week of the count, and it’s drastic drop in temperatures impacted both teams and unsheltered persons experiencing
homelessness, some teams self-reported that this impacted their ability to find and connect with individuals.
The advent of wellness hotels, alternatives to congregate shelters in response to COVID-19, may also account for the decreased
count. NMCEH made attempts during PIT planning to identify and include all wellness hotels across the state in our sheltered
count, but recognizes that many communities were not accounted for. It is reasonable to believe that unaccounted wellness hotels
provided shelter to people who might otherwise have experienced unsheltered homelessness the night of the count, resulting in
lower numbers.
Page 31 of 44Other Findings of Note
1. Transgender Representation
Figure 27 - US-BoS Transgender Overpresentation. Percentage of persons identifying as transgnder in 2021 PIT data
compared to 2016 NM State estimates 7
An area of overrepresentation found in the 2021 BoS PIT illustrates persons identifying as transgender among unsheltered
persons experiencing homlessness account for nearly double the estimates of New Mexico’s total transgender identifying
population. 5 people identified as transgender, with 3 out of those 5 being youth. The other two persons reported being in their
40’s and the other in their late 70’s, indicating that unsheltered homelessness disproportionately effects people identifying as
transgender across all life stages.
Recent youth housing initiatives, such as the Youth Homelessness Demonstration Project (YHDP) in northern New Mexico,
have identified LGBTQIA youth as a priority population and has been successful in housing many transgender identifying youth.
However, numbers suggest that more resources could help older adults as well.
2. COVID-19 and Unsheltered Homelessness
An additional question was added to the 2021 unsheltered survey to provide data on the impact of COVID-19 on the inflow of
people experiencing homelessness into the Balance of State. The majority of respondents (224 total, 76.2%) reported that
COVID-19 was not a cause of their current episode of homelessness. Only 37 people answered “yes”, accounting for 12.6% of
responses collected.
7
Source: https://williamsinstitute.law.ucla.edu/wp-content/uploads/Trans-Adults-US-Aug-2016.pdf
Page 32 of 44Figure 28 - US-BoS COVID-19 and Unsheltered Homelessness.Responses to the question “Are you homeless due to
COVID-19” collected in the Balance of State 2021 unsheltered PIT survey.
Page 33 of 44Balance of State Sheltered Data Breakdown - EmergencyShelter
Of the data collected from Emergency Shelters:
● 253 (36%) identified as American Indian or Alaskan Native ● Adults with a Serious Mental Illness (SMI) - 119 (20 %)
● 67 (9%) identified as chronically homeless ● Adults with Substance Use Disorder - 226 (40 %)
● 465 (85%) identified as households without children ● 103 (15%) identified as fleeing domestic violence
(singles)
Figure 29 - ES -BoS Gender. This is the Gender breakdown of data for people residing in an emergency shelter on the night of
January 25th.
Figure 30 - ES -BoS Age. This is the Age breakdown of data for people residing in an emergency shelter on the night of January
25th.
Page 34 of 44Figure 31 - ES -BoS Ethnicity. This is the Ethnicity breakdown of data for people residing in an emergency shelter on the night
of January 25th.
Figure 32 - ES -BoS Race. This is the Race breakdown of data for people residing in an emergency shelter on the night of
January 25th.
Page 35 of 44Figure 33 - ES-BoS Overtime. Estimated number of people residing in an emergency shelter in the Balance of State during the
PIT Counts 2011-2021.
Figure 34 - ES-BoS by County. Number of persons reported residing in an emergency shelter in the Balance of State during the
2021 PIT count by county.
Page 36 of 44Balance of State Sheltered Data Breakdown - Transitional Housing
Of the data collected from Transitional Housing Programs:
● 20 (17%) identified as American Indian or Alaskan Native ● Adults with Substance Use Disorder - 10 (17%)
● 28 (50%) identified as households without children (singles) ● 24 (20%) identified as fleeing domestic violence
● Adults with a Serious Mental Illness (SMI) - 13 (22%)
Figure 35 - TH -BoS Gender. This is the Gender breakdown of data for people residing in transitional housing on the night of
January 25th.
Figure 36 - TH -BoS Age. This is the Age breakdown of data for people residing in transitional housing on the night of January
25th.
Page 37 of 44Figure 37 - TH -BoS Ethnicity. This is the Ethnicity breakdown of data for people residing in transitional housing on the night
of January 25th.
Figure 38 - TH -BoS Race. This is the Race breakdown of data for people residing in transitional housing on the night of
January 25th.
Page 38 of 44Figure 39 - TH -BoS Overtime. Estimated number of people residing in transitional housing in the Balance of State during the
PIT Counts 2011-2021.
Figure 40 - TH-BoS by County. Number of persons reported residing in transitional housing in the Balance of State during the
2021 PIT count by county.
Page 39 of 44What you need to know about the 2021 Sheltered data
Emergency Shelter
Emergency shelter numbers decreased from a total of 895 persons in 2020 to a total of 702 persons in 2021, a decrease of
approximately 21%. This is significantly less than the 47% decrease in the unsheltered count. A possible explanation for this may
be that an influx in COVID-19 related funding for wellness hotels allowed more people to obtain shelter. However, there still was
a decrease which could be attributed to the generalized efforts by shelters to reduce capacity this year in congregate shelters in
response to COVID-19.
The sheltered PIT count does rely heavily on accurate and timely data from Emergency Shelters. Not every shelter in the Balance
of State participates in this count therefore the numbers should not be taken as definitive of all shelters. Data collected does not
provide an exact number, but rather a snapshot of people in our community. Even with these limitations, the sheltered PIT
Count provides important data for our community that can be used to develop effective strategies for ending homelessness in
New Mexico.
The numbers of those experiencing chronic homelessness in emergency shelters also present validity concerns. Not every shelter
uniformly collected or was trained to determine chronic homelessness status therefore the number reported should be regarded as
a low estimate.
In the 2021 PIT planning process, efforts were made to identify and collaborate with new shelter partners and wellness hotels. We
were able to secure engagement with 6 new projects, 4 of which are wellness hotels.
In contrast to Albuquerque’s results, we see that the total number of people in emergency shelters that identified as American
Indian or Alaskan Native is proportionately more (36%) than individuals who are unsheltered (19%). However, for the African
American or Black population, only 2% were in emergency shelter which is proportionally less (almost double) than the
unsheltered population at nearly 4%. We see people that identify as White make up roughly 392 (55%) of all people residing in
emergency shelters.
We also see that those reporting a serious mental illness (SMI) are proportionately less than those residing in an unsheltered
location, with 20% and 39% respectively. This is similar to the results for those reporting substance use disorder (SUD), with 40%
in emergency shelters and 70% unsheltered.
Transitional Housing
Transitional housing is unique in that it is largely targeted to certain subpopulations, including, and not limited to: Veterans,
people that have substance abuse and mental illness, or survivors of domestic violence. We see that the demographic breakdown
reflects the program constructions.
NMCEH’s methodology for aggregating Transitional Housing data has not changed much over the years, therefore comparison
of the different counts is practical. In 2021, we recorded 116 people who were residing in a Transitional Housing on the night of
January 25th. This is a decrease of 27.5% from the 160 persons reported in TH on the night of 2020 Sheltered PIT count, and
subsequently we see the trend of Transitional Housing decreasing.
Page 40 of 44(6) Acknowledgments
Together, we…
Collaborated to count our neighbors and fellow community members
who are living without fixed, suitable housing. This required many
hours of planning both for our standard count efforts,but to also
incorporate COVID-19 Pandemic safe practices. Through the
pandemic concerns and more limited staff than usual,as a state we
came together to provide this important data for our system of
homeless services and housing in New Mexico.
Thank you to all of our partners!
You made the 2021 Point-In-Time count a success.
We couldn’t have done it without you!!
Page 41 of 44(7) Resources
HUD Requirements & definitions
Continuum of Care:
https://www.govinfo.gov/content/pkg/CFR-2017-title24-vol3/xml/CFR-2017-title24-vol3-part578.xml
Point-In-Time Count: *HUD referenced the 2019 notice for the 2021 count.
https://files.hudexchange.info/resources/documents/Notice-CPD-18-08-2019-HIC-PIT-Data-Collection-
Notice.pdf
Homeless Definition:
https://files.hudexchange.info/resources/documents/HEARTH_HomelessDefinition_FinalRule.pdf
Chronic Homeless Definition:
https://files.hudexchange.info/resources/documents/Defining-Chronically-Homeless-Final-Rule.pdf
Nationwide PIT counts since 2007:
https://www.hudexchange.info/resource/3031/pit-and-hic-data-since-2007/
Previous Balance of State and Albuquerque Data
NMCEH Website:
https://nmceh.org/pages/homelessnessReports.html
Page 42 of 442021 Unsheltered Point-In-Time Count Survey
Page 43 of 44Page 44 of 44
You can also read