Glitter in the Darkness? Non-fibrillar β-amyloid Plaque Components Significantly Impact the β-amyloid PET Signal in Mouse Models of Alzheimer's ...
←
→
Page content transcription
If your browser does not render page correctly, please read the page content below
Journal of Nuclear Medicine, published on May 20, 2021 as doi:10.2967/jnumed.120.261858

    Glitter in the Darkness? Non-fibrillar β-amyloid Plaque Components Significantly

             Impact the β-amyloid PET Signal in Mouse Models of Alzheimer’s Disease

         Gloria Biechele1*, Laura Sebastian Monasor2,3*, Karin Wind1, Tanja Blume1,2, Samira
     Parhizkar4, Thomas Arzberger2, Christian Sacher1, Leonie Beyer1, Florian Eckenweber1,
             Franz-Josef Gildehaus1, Barbara von Ungern-Sternberg1, Michael Willem5, Peter
              Bartenstein1,6, Paul Cumming7,8, Axel Rominger1,7, Jochen Herms2,6,9, Stefan F.
              Lichtenthaler2,6,10, Christian Haass2,5,6, Sabina Tahirovic2*, Matthias Brendel1,6*

              1
               Dept. of Nuclear Medicine, University Hospital of Munich, LMU Munich, Munich, Germany
                      2
                      German Center for Neurodegenerative Diseases (DZNE) Munich, Munich, Germany
    3
        Graduate School of Systemic Neuroscience, Ludwig-Maximilians-University Munich, Munich, Germany
                                4
                                 Dept. of Neurology, Washington University, St. Louis, USA
    5
     Chair of Metabolic Biochemistry, Biomedical Center (BMC), Faculty of Medicine, LMU Munich, Munich,
                                                  Germany
                            6
                            Munich Cluster for Systems Neurology (SyNergy), Munich, Germany
               7
                  Department of Nuclear Medicine, Inselspital, University Hospital Bern, Bern, Switzerland
         8
          School of Psychology and Counselling and IHBI, Queensland University of Technology, Brisbane,
                                                    Australia
                  9
                   Center of Neuropathology and Prion Research, University of Munich, Munich Germany
10
    Neuroproteomics, School of Medicine, Klinikum Rechts der Isar, Technical University of Munich, Munich,
                                                 Germany
*
Contributed equally

19/03/2021

Abbreviated title: β-amyloid PET signal source

Corresponding author: Dr. Matthias Brendel; Department of Nuclear Medicine, University of Munich;
Marchioninistraße 15, 81377 Munich, Germany; Phone:+49(0)89440074650, Fax:+49(0)89440077646; E-
Mail: matthias.brendel@med.uni-muenchen.de

First author: Gloria Biechele (medical student); Department of Nuclear Medicine; LMU Munich, Germany;
Phone:+49(0)89440074646; E-Mail: gloria.biechele@med.uni-muenchen.de

Word count: 5421
                                                                                                             1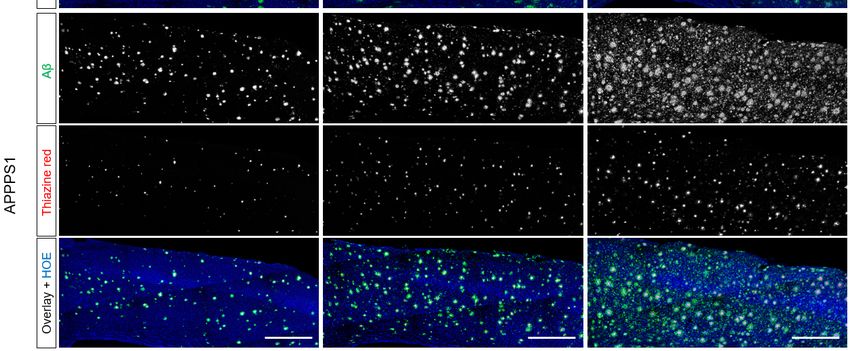
ABSTRACT

Objective: β-amyloid PET (Aβ-PET) is an important tool for quantification of amyloidosis in the

brain of suspected Alzheimer’s disease (AD) patients and transgenic AD mouse models. Despite

the excellent correlation of Aβ-PET with gold standard immunohistochemical assessments, the

relative contributions of fibrillar and non-fibrillar Aβ components to the in vivo Aβ-PET signal

remain unclear. Thus, we obtained two murine cerebral amyloidosis models that present with

distinct   Aβ    plaque    compositions      and    performed      regression    analysis    between

immunohistochemistry and Aβ PET to determine the biochemical contributions to Aβ-PET signal

in vivo. Methods: We investigated groups of AppNL-G-F and APPPS1 mice at three, six and 12

months of age by longitudinal 18F-florbetaben Aβ-PET and with immunohistochemical analysis of

the fibrillar and total Aβ burdens. We then applied group level inter-modality regression models

using age and genotype matched sets of fibrillar/ non-fibrillar Aβ data (predictors) and Aβ-PET

results (outcome) for both transgenic models. An independent group of double-hit APPPS1 mice

with dysfunctional microglia due to knock-out of triggering receptor expression on myeloid cells 2

(Trem2-/-) served for validation and evaluation of translational impact. Results: Neither fibrillar nor

non-fibrillar Aβ content alone sufficed to explain the Aβ-PET findings in either transgenic AD

model. However, a regression model compiling fibrillar and non-fibrillar Aβ together with the

estimate of individual heterogeneity and age at scanning could explain a 93% of variance of the

Aβ-PET signal (P
the greater abundance of non-fibrillar Aβ plaque in AD model mice contributes importantly to the

PET signal.

Key words: amyloid, fibrillar, non-fibrillar, PET signal, mouse

                                                                                              3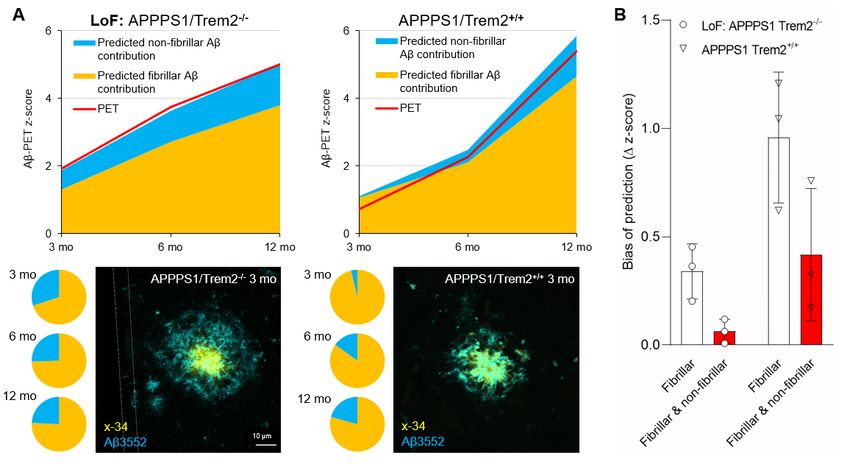
INTRODUCTION

Positron emission tomography for β-amyloid (Aβ-PET) is now widely used for identification and

quantification of amyloidosis in the brain of suspected Alzheimer’s disease (AD) patients (1), and

has been incorporated into the current research framework for diagnostic recommendations in AD

(2). Here, the Aβ status (A) identified by PET serves for diagnosis, together with biomarkers for

tau (T) and neuronal injury (N) (2). Furthermore, Aβ-PET is used as an inclusion criteria of anti-

amyloid immunotherapy clinical trials (3), and as a progression biomarker for therapy evaluation

in these trials (4). In the preclinical setting, Aβ-PET has also become a useful tool for the dynamic

assessment of neuropathology in transgenic Aβ mouse models (5,6). Despite the excellent

correlation of Aβ-PET with immunohistochemical gold standard assessments of amyloidosis in

patients (7,8) and mouse models of AD (6,9), there has remained an uncertainty about the relative

contributions of fibrillar and non-fibrillar Aβ components in plaques to the Aβ-PET signal in vivo.

This research gap needs to be closed as the two forms have differing neurotoxicity, and there is

evidence that alterations in AD-related genes like triggering receptor expressed on myeloid cells

2 (TREM2) and Apolipoprotein E (APOE) alter the net Aβ plaque fibrillarity, which would

consecutively bias the relationship between plaque density with Aβ-PET binding in vivo (5).

       A human autopsy validated     18F-florbetaben   PET study showed preliminary evidence that

diffuse plaques may make only a minor contribution to the net Aβ-PET signal (10). However,

autopsy controlled data with   18F-flutemetamol   in vivo (11) and comprehensive in vitro data (12)

indicated that the binding of that structurally distinct tracer to diffuse plaques also contributes to

the net PET signal. Furthermore, our recent preclinical study revealed a discernible Aβ-PET signal

in AppNL-G-F mice (13), although this model displays only very limited fibrillar Aβ pathology (14).

Therefore, we aimed to quantify the contributions of fibrillar and non-fibrillar plaque components

to the Aβ-PET signal in vivo in AD model mice.

                                                                                                    4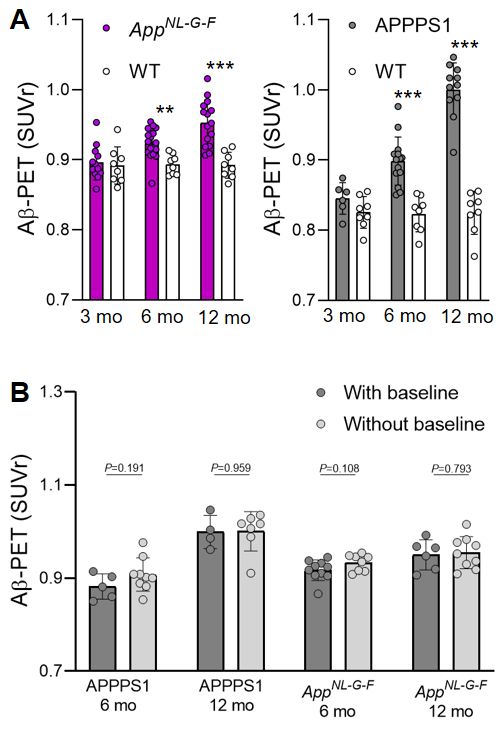
We recently demonstrated that the AppNL-G-F and APPPS1 mouse models exhibit

differences in Aβ plaque fibrillarity (14), such that a comparative study of these mice could help to

determine the effect of fibrillarity on Aβ-PET signal in vivo. Thus, we combined a standardized

preclinical   18F-florbetaben   PET study with immunohistochemical characterization of fibrillar vs.

non-fibrillar Aβ in AppNL-G-F and APPPS1 mice examined at different pathological stages. We then

developed a regression model for immunohistochemistry and Aβ-PET to establish the relative

proportions of fibrillar and non-fibrillar sources in the Aβ-PET signal in vivo. Furthermore, we

validated the calculated regression factors in an independent cohort APPPS1/Trem2-/- and

APPPS1/Trem2+/+ mice and tested a hypothesis that the non-fibrillar Aβ pool contributes more to

the Aβ-PET signal in APPPS1/Trem2-/- mice than in APPPS1/Trem2+/+ mice.

MATERIAL AND METHODS

Experimental Design

       All experiments were performed in compliance with the National Guidelines for Animal

Protection, Germany and with the approval of the regional animal committee (Regierung

Oberbayern), and were overseen by a veterinarian. Animals were housed in a temperature- and

humidity-controlled environment with 12 h light-dark cycle, and with free access to food (Sniff,

Soest, Germany) and water. We conducted longitudinal         18F-florbetaben   PET imaging in cohorts

of female AppNL-G-F (n=18) and APPPS1 (n=14) mice Aβ-PET at three, six and 12 months of age,

together with an age- and sex-matched group of wild-type (n=8) mice. 56% of the transgenic mice

had their baseline examination of at three months of age, and the remaining 44% of the mice were

imaged from six to 12 months of age. All mice of each model originated from the same breeding

colony. To exclude batch effects within each modality, we used separate cohorts of mice (14) for

immunohistochemistry analyses of fibrillar and non-fibrillar Aβ plaque components in wildtype and

AD model mice (n=3-4) at three, six, and 12 months of age. We then applied inter-modality
                                                                                                   5
regression models to separate the relative contributions of fibrillar and non-fibrillar Aβ plaque
components to Aβ-PET signals in the two transgenic strains.
Animal Models
APP/PS1 (APPPS1-21) mice show extensive fibrillar Aβ plaque pathology, first evident at
6–8 weeks of age (15). In contrast, AppNL-G-F(AppNL-G-F/NL-G-F) is a murine model with relatively
limited fibrillar Aβ plaque pathology, but showing Aβ PET signal from eight weeks of age in
homozygous mice (16,17). Wild-type controls were C57BL/6 mice.
PET Imaging
PET Data Acquisition, Reconstruction and Post-Processing: For all PET procedures,
radiochemistry, data acquisition, and image pre-processing were conducted according to an
established, standardized protocol (6). In brief, we obtained 18F-florbetaben Aβ-PET recordings
(average dose: 12.1±1.8 MBq) with an emission window of 30–60 min after injection.
PET Image Analysis: We performed all analyses using PMOD (version 3.5; PMOD
technologies). Normalization of attenuation-corrected emission images to standardized uptake
value ratio (SUVr) images was performed using previously validated periaqueductal gray (PAG)
(18) and white matter (WM) reference regions for the AppNL-G-F and APPPS1 mouse models,
respectively (5). We analyzed the wild-type mice separately with both reference regions to serve
as controls for the transgenic models. Bilateral neocortical volumes of interest (15 mm3) matching
the region of interest in the immunohistochemistry analysis were applied for calculation of
SUVrForebrain/WM or SUVrForebrain/PAG.
6Immunohistochemical Analysis
Groups of APPPS1 and AppNL-G-F mice at an age of three months (n=4), six months (n=3)
and 12 months (n=4) were transcardially perfused with ice cold PBS (0.1 M) followed by 4% PFA,
after cryopreserved in 30% sucrose. The mouse tissue used for immunohistochemical analysis
included some of the APPPS1 and AppNL-G-F mouse brains utilized in our previous publication (14).
All stainings and analyses were performed newly for the purpose of the present study. We
collected 30 µm-thick coronal sections for free-floating immunostaining. We used the 3552
antibody (1:5000;(19)) to label total Aβ and Thiazine red (2 µM, Sigma) to stain the fibrillar Aβ. 24
images were acquired in four coronal sections (6 images per section) in regions matching PET
using a confocal microscope (20x dry objective, Leica TCS SP5). Given the prominent differences
in the levels of fibrillar Aβ between the APPPS1 and AppNL-G-F mice, the confocal settings were
optimized for each mouse model to acquire the Thiazine red signal. For the three- and six-month-
old AppNL-G-F mice, the “averaging” and “accumulation” confocal functions were set to “2”, to better
detect the Thiazine red signal. An in-house programmed macro from ImageJ (NIH) was used to
analyze the total and fibrillar Aβ coverage.
As a validation analysis, we reanalyzed data from a previous study that included
immunohistochemistry markers for fibrillar (x-34) and total Aβ (3552) components of Aβ plaques
(5). Immunohistochemistry was obtained from APPPS1xTrem2+/+ and APPPS1xTrem2-/- mice
(three and six months: n=4, 12 months: n=8). Aβ-PET data were analyzed by the processing
pipeline described above and at the same time-points for both genotypes (APPPS1xTrem2+/+:
three months: n=3, six and 12 months: n=10; APPPS1xTrem2-/-: three months: n=7, six months:
n=9, 12 months: n=7). Furthermore, for validation purpose we obtained Aβ coverage for fibrillar
(methoxy-x04 or x-34) and total Aβ (3552) components at 13 months of age in the PET cohorts.
In all datasets, non-fibrillar Aβ was calculated by subtraction of fibrillar Aβ from total Aβ (area-%non-
fibrillar = area-%total – area-%fibrillar).
7Statistics
Graph Pad Prism (Version 8.43, GraphPad Software, LCC) was used for all statistical tests.
A P-value of less than 0.05 was considered to be significant for rejection of the null hypothesis.
Group Level Analysis: Non-fibrillar Aβ, fibrillar Aβ, and the Aβ-PET z-score were compared
between AppNL-G-F and APPPS1 mice at different ages by an unpaired Student’s t-test. Mean
values of each of the three read-outs from the AppNL-G-F and APPPS1 groups at different ages
were subject to a linear regression analysis. The area between the regression plots served as an
index of the potential bias in the estimates of Aβ pathology by Aβ-PET.
Individual Level Analysis: We applied regression models using the Aβ-PET z-score of all
investigated mice of both models as an outcome variable. Fibrillar Aβ and non-fibrillar Aβ
estimates deriving from all age and genotype-matched mouse groups were used as predictors,
and heterogeneity of individual mice with respect to PET results and age were used as additional
covariates. Here, we defined heterogeneity as the deviation of individual mice of each genotype
from their group mean at each time-point. The regression coefficients for fibrillar Aβ and non-
fibrillar Aβ were extracted to calculate their relative contributions to the Aβ-PET signal.
Bootstrapping was performed with 1000 random samples.
Validation Analysis: The derived regression coefficients were applied to immunohistochemistry
analysis of independent samples of APPPS1/Trem2+/+ and APPPS1/Trem2-/- mice. The predicted
Aβ-PET z-scores were compared with the actual Aβ-PET z-scores in vivo, and the deviation
between the predicted and actual Aβ-PET z-scores was compared with separate consideration of
both plaque components and sole consideration of fibrillar Aβ. The bias resulting from
consideration only of fibrillar Aβ was calculated as a function of longitudinal changes in the Aβ-
PET signal in the contrast of APPPS1/Trem2+/+ and APPPS1/Trem2-/- mice.
8RESULTS
Separate Quantification of Fibrillar or Non-fibrillar Aβ Plaque Deposition Fails to Explain
the Aβ-PET Signal
First, we performed a direct standardized comparison of non-fibrillar and fibrillar Aβ
estimates by immunohistochemistry and Aβ-PET between AppNL-G-F and APPPS1 mouse models
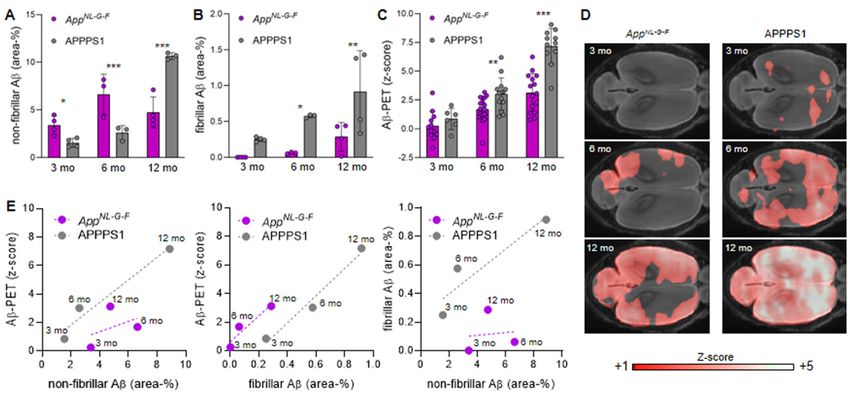
at different ages. Non-fibrillar Aβ area coverage of AppNL-G-F mice exceeded that of APPPS1 mice
at three and six months of age, whereas APPPS1 mice had higher non-fibrillar Aβ area coverage
at 12 months of age (Fig. 1A; Fig. 2). Fibrillar Aβ area coverage was significantly higher in APPPS1
mice than in AppNL-G-F mice at all ages studied (Fig. 1B; Fig. 2). Immunohistochemically assessed
area coverage values did not differ between the immunohistochemistry cohorts and the PET
cohorts at 12/13 months of age (all P>0.05, Supplemental Fig. 1). Aβ-PET z-scores of AppNL-G-F
and APPPS1 mice are provided and illustrated in Figs. 1C,D. There were no interindividual SUVr
differences between mice imaged three times at 3, 6 and 12 months when compared to mice only
imaged twice at 6 and 12 months (all P >0.05, Supplemental Fig. 2). Aβ-PET showed significantly
higher standardized differences in APPPS1 mice when compared to AppNL-G-F mice at six and 12
months, whereas there were no significant differences at three months of age (Fig. 1C). Plotting
of Aβ-PET results as a linear function of non-fibrillar or fibrillar Aβ at different ages indicated a
mismatch between the two mouse models (Fig. 1E). Plotting fibrillar Aβ as a linear function of non-
fibrillar Aβ coverage underpinned that APPPS1 mice had a higher proportion of fibrillar Aβ
compared to AppNL-G-F (Fig. 1E). The comparison of the linear functions of both mouse models
(the area transected by the regression lines) indicated that Aβ-PET underestimated the proportion
of non-fibrillar Aβ in AppNL-G-F mice (-2.08 z-score units), but overestimated the proportion of fibrillar
Aβ in AppNL-G-F mice (+2.36 z-score units). Thus, neither fibrillar nor non-fibrillar Aβ alone could
explain the combined Aβ-PET findings.
9Non-fibrillar Aβ Contributes Significantly to the Aβ-PET Signal
Next, we hypothesized that a combined model of non-fibrillar and fibrillar Aβ components
could improve the explanation of variance in the Aβ-PET signals. To test this, we established a
multiple regression model using all available combinations of age and genotype matched Aβ-PET-
immuno/histochemistry estimates with inclusion of all AppNL-G-F and APPPS1 mice.
Simplified regression models with either fibrillar or non-fibrillar Aβ as predictors of the Aβ-
PET z-score explained 50% and 32% of the variance in Aβ-PET, respectively (both PAppNL-G-F and APPPS1 mice at different ages confirmed the suitability of this model, as indicated
by 98% explanation of the variance using weighted factors, compared to only 84% for isolated
fibrillar and 55% for non-fibrillar plaque components (Fig. 3D).
Impact of Fibrillar and Non-fibrillar Plaque Components in Mice with Dysfunctional
Microglia
Finally, we validated our results in independent cohorts of APPPS1 mice, and made an
additional investigation of the impact of Trem2 deficiency on the Aβ-PET signal in these mice,
given that Trem2 is a known driver of changes in the plaque fibrillarity. Application of the regression
factors to immuno/histochemistry data indicated an excellent prediction of the actual Aβ-PET
signal in independent cohorts of APPPS1/Trem2-/- and APPPS1/Trem2+/+ mice (Fig. 4A). APPPS1
mice with Trem2 loss of function showed a higher contribution of non-fibrillar parts plaque
components to the Aβ-PET signal (30% at three months, 26% at six months, and 24% at 12
months) when compared to APPPS1 mice with intact Trem2 (4% at three months, 15% at six
months, and 21% at 12 months; Fig. 4A). A combined consideration of fibrillar Aβ and non-fibrillar
Aβ predicted the actual PET signal more precisely that did sole consideration of fibrillar Aβ (Fig.
4B). Previously calculated increases in Aβ-PET signal with age in these mice indicated a
considerable bias when considering only the fibrillar Aβ component (Supplemental Fig. 3). In
summary, microglial dysfunction altered the relative proportions of fibrillar and non-fibrillar Aβ, thus
directly influencing the Aβ-PET signal as a function of mouse age.
DISCUSSION
We provide the first in vivo analysis to elucidate the contributions of fibrillar and non-fibrillar
plaque components to the Aβ-PET signal. Our data clearly show that non-fibrillar plaque fractions
11have a significant impact on the net 18F-florbetaben binding to Aβ plaques of Aβ mouse models in
vivo. Although the resulting Aβ-PET tracer signal is inherently 16-fold higher when comparing
equal amounts of fibrillar and non-fibrillar Aβ, the larger proportions of non-fibrillar plaque
components counterbalance the net contribution. We validated our regression model in an
independent cohort of APPPS1 mice, and extended the potential translational impact of our
findings by showing that microglial dysfunction can influence the longitudinal Aβ-PET signal via
changing the relative proportions of fibrillar to non-fibrillar plaque components.
In various analyses of single amyloidosis mouse models, there was a strong agreement
between Aβ-PET and different immuno/histochemistry markers for Aβ (9,20). It is widely
acknowledged that the Aβ-PET signal with 18F-florbetaben primarily derives from aggregated
fibrillar Aβ, since this and other clinically approved Aβ-PET tracers were derived from the chemical
scaffold of thioflavin-T, which only colors fibrillar Aβ (21). However, a recent small animal Aβ-PET
investigation from our lab (18) indicated that there could be discrepancies between
immuno/histochemistry and in vivo Aβ-PET signals, if one attributes the entire PET signal to
fibrillar Aβ. In fact, AppNL-G-F mice exhibited an only moderate Aβ-PET signal, although their
plaques were mainly composed of non-fibrillar Aβ (14). Therefore, we applied in this study a
standardized 18F-florbetaben PET examination comparing AppNL-G-F and APPPS1 mice in
conjunction with combined histochemical and immunohistochemical examination to elucidate the
separate contributions of fibrillar and non-fibrillar Aβ sources to the in vivo Aβ-PET signal. We
performed PET acquisitions in both Aβ models and wild-type mice with identical housing
conditions and using the same tomograph and image reconstruction parameters, thus minimizing
the potential methodological bias. Nonetheless, we acknowledge that scanning of mice on
different days of the week and social hierarchy factors, along with technical factors due to different
cage positions might still impact the detection of plaque pathology by Aβ-PET. We had to choose
between conducting longitudinal PET examination and immuno/histochemistry analysis in
separate groups (cross-sectional design), rather than conducting the study in which PET
12examination directly preceded immunohistochemistry in the same mice. Since animal batch
effects may introduce a bias into cross-sectional PET quantifications between different ages of a
given mouse model, we elected to conduct longitudinal PET imaging together with cross sectional
immuno/histochemistry to exclude batch effects, at least for PET. To account further for the
heterogeneity (22) and asymmetry (13) of amyloidosis in individual mice of a lineage, we used a
bilateral target in a regression model including each available combination of PET-
immuno/histochemistry results for each model at each of three ages, controlled for the individual
heterogeneity. Regression coefficients for the proportions of fibrillar and non-fibrillar Aβ in different
models were robust, and revealed that fibrillar Aβ makes an intrinsically 16-fold higher contribution
to the Aβ-PET signal when compared to non-fibrillar Aβ in the studied Aβ mouse models. Our
preclinical in vivo results concur with the post-mortem validation of human 18F-flutemetamol PET
data, where ligand binding to diffuse plaques was the most likely explanation for positive in vivo
signals in patients who later proved to have only sparse neuritic plaques at autopsy (11,23). The
same research group recently validated the contributions of diffuse and neuritic plaques to the 18F-
flutemetamol and 11C-PiB autoradiography signals in vitro study (12). However, our study
comprises the first translation of such findings into the in vivo setting, and enables the arithmetic
conversion of Aβ-PET signals into fibrillar and non-fibrillar Aβ components. We note that structure
of the stilbene 18F-florbetaben is different to the structures of the benzothiazoles 18F-flutemetamol
and 11C-PiB, which could result in different proportions of fibrillar and non-fibrillar binding
capacities in vivo. As usual, the limited resolution of small animal PET systems in relation to the
mouse brain size and resulting partial volume effects present a limitation for the transfer of present
findings into the human context and we want to emphasize that detailed regression factors cannot
be transferred directly. Yet, the demonstration of an inherently 16-fold higher contribution of fibrillar
plaque to the PET signal is concurs with a biophysical chemistry study investigating binding
mechanisms of Aβ ligands by molecular docking, molecular dynamics and generalized Born-
based free energy calculations (24). Here, core sites of Aβ fibrils, which are more abundant in
13fibrillar components of the plaque, dominated over surface sites in producing the Aβ-PET signal
(24).
Our findings could be of translational relevance since Aβ-immunotherapy and other
treatment strategies against AD may change the proportions of fibrillar and non-fibrillar plaque
components, and thus bias the Aβ-PET outcome. Furthermore, alterations of microglial genes are
associated with changes in plaque morphology, which consequently influence the Aβ-PET signal
(5). We can correlate the more diffuse amyloid plaque morphology in AppNL-G-F mice with
differences in plaque morphology observed in AD mice deficient for TREM2 or APOE (5,25). While
loss of function mutations of Trem2 are rare in humans, microglia genes seem in general (26) to
have a high impact on AD pathology, and modulating microglial function is being intensively
studied as a therapeutic strategy for AD (27). Another limitation for the direct translation of our
findings towards human AD consists in different binding site densities of Aβ plaques in Aβ mouse
models when compared to sporadic AD (28). Thus, comparisons of Aβ-PET signal intensity
between rodents and humans need to be considered with caution. However, the regression model
generated in this study should increase the awareness for an impact of non-fibrillar Aβ to the Aβ-
PET signal in both species. Thus, a potential shift in the plaque proportions needs to be considered
when designing future studies with assessment of Aβ load in vivo upon therapeutic modifications
that target microglia. Assessment of fibrillar and non-fibrillar plaque components and the
respective Aβ-PET tracer binding properties in autopsy cases after/during disease modifying
treatment studies of AD could serve to test the impact of our findings in the human situation.
CONCLUSION
The Aβ-PET signal with 18F-florbetaben in vivo arises from a combination of fibrillar and
non-fibrillar plaque components. Fibrillar Aβ has inherently higher tracer binding, but the greater
proportion of non-fibrillar Aβ relative to fibrillar Aβ in most plaques mean that the non-fibrillar signal
14source is a relevant component of the total signal. Since experimental AD therapy regimens can
shift the proportion of fibrillar vs. non-fibrillar Aβ, any longitudinal changes in Aβ-PET signal as a
read-out of therapy monitoring must be interpreted with caution; a detailed understanding of the
biochemical basis of Aβ-PET signal is critical for the correct use of PET for monitoring novel AD
therapies.
DISCLOSURE
C.H. collaborates with Denali Therapeutics, participated on one advisory board meeting of
Biogen, and received a speaker honorarium from Novartis and Roche. C.H. is chief advisor of
ISAR Bioscience. P.B., A.R. and M.B. received speaking honoraria from Life Molecular Imaging
and GE healthcare. M.B. is an advisor of Life Molecular Imaging. No other potential conflicts of
interest relevant to this article exist.
ACKNOWLEDGEMENTS
We thank Mathias Jucker for providing the APPPS1 mice and to Takashi Saito and Takaomi C.
Saido for providing the AppNL-G-Fmice. S.T. was supported by the Alzheimer-Forschung-Initiative
e.V (grant number 18014). This work was supported by an Alzheimer’s Association Grant through
the AD Strategic Fund (ADSF-21-831226-C). This work was supported by the German Research
Foundation within the framework of the Munich Cluster for Systems Neurology (EXC 2145
SyNergy/ ID 390857198).
15KEY POINTS
QUESTION: Does non-fibrillar β-amyloid (Aβ) contribute to the in vivo Aβ-PET signal?
PERTINENT FINDINGS: Fibrillar Aβ has 16-fold higher tracer binding, but the greater proportion
of non-fibrillar Aβ relative to fibrillar Aβ in most plaques mean that the non-fibrillar signal source is
a relevant component of the total Aβ-PET signal.
TRANSLATIONAL IMPLICATIONS: Shifts of the proportion of fibrillar vs. non-fibrillar Aβ need to
be considered when interpreting the longitudinal Aβ-PET signal for monitoring of therapeutic
effects.
16REFERENCES
1. Koscik RL, Betthauser TJ, Jonaitis EM, et al. Amyloid duration is associated with preclinical cognitive
decline and tau PET. Alzheimers Dement (Amst). 2020;12:e12007.
2. Jack CR, Jr., Bennett DA, Blennow K, et al. NIA‐AA Research Framework: Toward a biological
definition of Alzheimer's disease. Alzheimers Dement. 2018;14:535‐562.
3. Wessels AM, Tariot PN, Zimmer JA, et al. Efficacy and Safety of Lanabecestat for Treatment of Early
and Mild Alzheimer Disease: The AMARANTH and DAYBREAK‐ALZ Randomized Clinical Trials. JAMA Neurol.
2020;77:199‐209.
4. Sevigny J, Chiao P, Bussière T, et al. The antibody aducanumab reduces Aβ plaques in Alzheimer’s
disease. Nature. 2016;537:50‐56.
5. Parhizkar S, Arzberger T, Brendel M, et al. Loss of TREM2 function increases amyloid seeding but
reduces plaque‐associated ApoE. Nat Neurosci. 2019;22:191‐204.
6. Overhoff F, Brendel M, Jaworska A, et al. Automated Spatial Brain Normalization and Hindbrain
White Matter Reference Tissue Give Improved [(18)F]‐Florbetaben PET Quantitation in Alzheimer's Model
Mice. Front Neurosci. 2016;10:45.
7. Sabri O, Sabbagh MN, Seibyl J, et al. Florbetaben PET imaging to detect amyloid beta plaques in
Alzheimer's disease: phase 3 study. Alzheimers Dement. 2015;11:964‐974.
8. Curtis C, Gamez JE, Singh U, et al. Phase 3 trial of flutemetamol labeled with radioactive fluorine
18 imaging and neuritic plaque density. JAMA Neurol. 2015;72:287‐294.
9. Rominger A, Brendel M, Burgold S, et al. Longitudinal assessment of cerebral b‐amyloid deposition
in mice overexpressing Swedish mutant b‐amyloid precursor protein using 18F‐florbetaben PET. J Nucl
Med. 2013;54:1127‐1134.
10. Catafau AM, Bullich S, Seibyl JP, et al. Cerebellar Amyloid‐beta Plaques: How Frequent Are They,
and Do They Influence 18F‐Florbetaben SUV Ratios? J Nucl Med. 2016;57:1740‐1745.
11. Ikonomovic MD, Buckley CJ, Heurling K, et al. Post‐mortem histopathology underlying beta‐
amyloid PET imaging following flutemetamol F 18 injection. Acta Neuropathol Commun. 2016;4:130.
12. Ikonomovic MD, Buckley CJ, Abrahamson EE, et al. Post‐mortem analyses of PiB and flutemetamol
in diffuse and cored amyloid‐beta plaques in Alzheimer's disease. Acta Neuropathol. 2020;140:463‐476.
1713. Sacher C, Blume T, Beyer L, et al. Asymmetry of Fibrillar Plaque Burden in Amyloid Mouse Models.
J Nucl Med. 2020;61:1825‐1831.
14. Sebastian Monasor L, Muller SA, Colombo AV, et al. Fibrillar Abeta triggers microglial proteome
alterations and dysfunction in Alzheimer mouse models. Elife. 2020;9.
15. Radde R, Bolmont T, Kaeser SA, et al. Abeta42‐driven cerebral amyloidosis in transgenic mice
reveals early and robust pathology. EMBO Rep. 2006;7:940‐946.
16. Masuda A, Kobayashi Y, Kogo N, Saito T, Saido TC, Itohara S. Cognitive deficits in single App knock‐
in mouse models. Neurobiol Learn Mem. 2016;135:73‐82.
17. Saito T, Matsuba Y, Mihira N, et al. Single App knock‐in mouse models of Alzheimer's disease. Nat
Neurosci. 2014;17:661‐663.
18. Sacher C, Blume T, Beyer L, et al. Longitudinal PET Monitoring of Amyloidosis and Microglial
Activation in a Second‐Generation Amyloid‐beta Mouse Model. J Nucl Med. 2019;60:1787‐1793.
19. Yamasaki A, Eimer S, Okochi M, et al. The GxGD motif of presenilin contributes to catalytic function
and substrate identification of gamma‐secretase. J Neurosci. 2006;26:3821‐3828.
20. Poisnel G, Dhilly M, Moustie O, et al. PET imaging with [18F]AV‐45 in an APP/PS1‐21 murine model
of amyloid plaque deposition. Neurobiol Aging. 2012;33:2561‐2571.
21. Mathis CA, Mason NS, Lopresti BJ, Klunk WE. Development of positron emission tomography beta‐
amyloid plaque imaging agents. Semin Nucl Med. 2012;42:423‐432.
22. Brendel M, Jaworska A, Herms J, et al. Amyloid‐PET predicts inhibition of de novo plaque formation
upon chronic gamma‐secretase modulator treatment. Mol Psychiatry. 2015;20:1179‐1187.
23. Ikonomovic MD, Fantoni ER, Farrar G, Salloway S. Infrequent false positive [(18)F]flutemetamol
PET signal is resolved by combined histological assessment of neuritic and diffuse plaques. Alzheimers Res
Ther. 2018;10:60.
24. Murugan NA, Halldin C, Nordberg A, Langstrom B, Agren H. The Culprit Is in the Cave: The Core
Sites Explain the Binding Profiles of Amyloid‐Specific Tracers. J Phys Chem Lett. 2016;7:3313‐3321.
25. Ulrich JD, Ulland TK, Mahan TE, et al. ApoE facilitates the microglial response to amyloid plaque
pathology. J Exp Med. 2018;215:1047‐1058.
1826. Sierksma A, Lu A, Mancuso R, et al. Novel Alzheimer risk genes determine the microglia response
to amyloid‐beta but not to TAU pathology. EMBO Mol Med. 2020;12:e10606.
27. Lewcock JW, Schlepckow K, Di Paolo G, Tahirovic S, Monroe KM, Haass C. Emerging Microglia
Biology Defines Novel Therapeutic Approaches for Alzheimer's Disease. Neuron. 2020;108:801‐821.
28. Klunk WE, Lopresti BJ, Ikonomovic MD, et al. Binding of the positron emission tomography tracer
Pittsburgh compound‐B reflects the amount of amyloid‐beta in Alzheimer's disease brain but not in
transgenic mouse brain. J Neurosci. 2005;25:10598‐10606.
19Figure 1: Quantitation of non-fibrillar Aβ (A), fibrillar Aβ (B), and the Aβ-PET signal z-scores (C) in the neocortex of AppNL-G-F and APPPS1 mice at three, six and 12 months of age, together with (D) axial images of group-wise PET z-scores projected upon a MRI standard template. (E) Correlation plots of the associations between immuno/histochemistry markers and PET at different ages (group level) in the contrast of both mouse models. *P
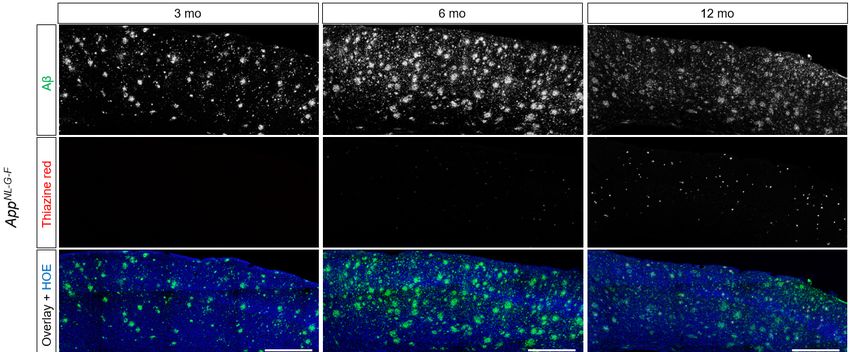
Figure 2: Representative images of immuno/histochemistry. Total Aβ was assessed by 3552 staining and
fibrillar Aβ was assessed by Thiazine red. Hoechst (HOE, blue) was used for nuclear visualization. Scale
bars: 500 µm.

                                                                                                     21
Figure 3: (A-C) Regression plots illustrate the correlation between the actual and the predicted Aβ-PET z-
score when using fibrillar Aβ and non-fibrillar Aβ as predictors, and individual heterogeneity and age as
covariates. Regressions were calculated with a total of n=261 permutations between immuno/histochemistry
and PET endpoints using all available combinations with matched age and genotype. (D) Application of the
average regression factors for fibrillar (B=3.17) and non-fibrillar Aβ (B=0.20) on the combined
immuno/histochemistry data of both models (group means per age).
22Figure 4: (A) Z-scores of the measured Aβ-PET signal (red) and the predicted fibrillar (orange) and non-
fibrillar (blue) source components in an independent cohort of APPPS1 mice with dysfunctional (Trem2-/-)
and intact (Trem2+/+) microglia. Pie charts show the fibrillar and non-fibrillar contributions to the measured
Aβ-PET signals predicted by immuno/histochemistry. A representative double staining of a APPPS1/Trem2-
/-
mouse shows more non-fibrillar Aβ (3552-positive, blue) surrounding the core (x-34-positive,
yellow/orange) when compared to a APPPS1/Trem2+/+ mouse, both at three months of age. (B) Bias of the
predicted z-scores, when only fibrillar or the combination of fibrillar and non-fibrillar plaque contributions
were considered. The analysis displays the deviation of predicted values and the actual Aβ-PET signal in
part B at the three different ages.
23Reg. coeff Reg. coeff
Model R² R² (corr.) P-value
Fibrillar (B) Non-fibrillar (B)
Fibrillar 0.499 0.497 4.414 (3.915-4.926) PSupplement Supplemental Figure 1: Comparison of Aβ area coverage of the immunohistochemistry (IHC) cohort and the PET cohort for both Aβ mouse models. Note that different histology markers were used for assessment of fibrillar Aβ (Thiazine red, x-34, methoxy-x04). Non-fibrillar Aβ was consistently assessed by 3552. P-values derive from a Student’s t-test. Error bars represent SD.
Supplemental Figure 2: (A) PET SUVr quantification in Aβ mouse models and wild-type (WT)
mice. Previously validated model-specific periaqueductal grey and white matter reference tissues
were used for SUVr calculation. Z-score calculation of these SUVr values (TG – WTmean / WTSD)
enabled the direct comparison of both Aβ mouse models in the regression models of the main
manuscript. (B) Comparison of Aβ-PET standardized uptake value ratios (SUVr) between mice
with baseline examination at 3 months compared to mice with baseline examination at 6 months.
P-values derive from a Student’s t-test. **P
Supplemental Figure 3: Bias of Aβ-PET rate of change when fibrillar Aβ is considered soley. Fits
represent polynomic functions of the bias in longitudinal changes of Aβ-PET in APPPS1/Trem2−/−
mice (purple) in contrast to APPPS1/Trem2+/+ mice (grey). Dotted lines represent functions of
s.e.m. The plot was created analogous to (Parhizkar, Arzberger et al. 2019).
You can also read