Spending on Children Ages 8 and Younger - Urban Institute
←
→
Page content transcription
If your browser does not render page correctly, please read the page content below

CENTER ON LABOR, HUMAN SERVICES, AND POPULATION

RE S E AR CH RE P O R T

Spending on Children Ages 8
and Younger
Heather Hahn              Cary Lou            Julia B. Isaacs      Joycelyn Ovalle
December 2017
AB O U T T HE U R BA N I NS T I T U TE
The nonprofit Urban Institute is dedicated to elevating the debate on social and economic policy. For nearly five
decades, Urban scholars have conducted research and offered evidence-based solutions that improve lives and
strengthen communities across a rapidly urbanizing world. Their objective research helps expand opportunities for
all, reduce hardship among the most vulnerable, and strengthen the effectiveness of the public sector.

Copyright © December 2017. Urban Institute. Permission is granted for reproduction of this file, with attribution to
the Urban Institute.
Contents
Acknowledgments                                                                             iv

Executive Summary                                                                            v

Spending on Children Ages 8 and Younger                                                     1

Part I: How Much Do We Spend on Children Ages 8 and Younger?                                5
  How Do Federal Outlays for Young Children Compare with Other Federal Outlays?              6
  How Do Federal Tax Reductions for Young Children Compare with Other Tax Reductions?        7
  What Are the Trends in Federal Expenditures for Children Over Time?                        8
  How Do Federal Outlays Compare with State and Local Outlays?                               8

Part II: Where Do We Spend Federal Funds on Young Children?                                 10
  How Have Expenditures on the 10 Largest Programs Changed in the Past Decade?              11
  How Much Does the Federal Government Spend per Young Child on Health, Education, Taxes,
         and Other Categories?                                                              12
  How Are Expenditures per Young Child on Health, Education, Taxes, and Other Categories
         Changing?                                                                          13

Part III: How Do We Spend Federal Funds on Young Children?                                  18
  How Targeted Are Federal Expenditures to Young Children in Low-Income Families?           18
  How Does Targeting of Federal Expenditures for Young Children Compare with Targeting
         of State and Local Expenditures?                                                   19
  What Share of Federal Expenditures on Children Are Mandatory, Discretionary,
         or Tax Expenditures?                                                               20
  How Do Young Children Receive Federal Expenditures?                                       21

Conclusion                                                                                  22

Appendix A. Methods                                                                         23

Notes                                                                                       28

References                                                                                  29

About the Authors                                                                           31

Statement of Independence                                                                   32
Acknowledgments
This report was funded by the Bipartisan Policy Center.

    The views expressed are those of the authors and should not be attributed to the Urban Institute,
its trustees, or its funders. Funders do not determine research findings or the insights and
recommendations of Urban experts. Further information on the Urban Institute’s funding principles is
available at www.urban.org/aboutus/our-funding/funding-principles.

    The authors are grateful to C. Eugene Steuerle and Laudan Aron for their insightful comments on
this report and to the authors of previous reports on children’s budgets for laying the groundwork for
this analysis.

     IV                                                                       ACKNOWLEDGMENTS
Executive Summary
Understanding public spending on children ages 8 and younger is important because investments in
young children can positively influence not only their well-being during childhood but their long term
social and economic outcomes as well. This report adds to that understanding by providing baseline
information on how much the federal government spent on children ages 8 and younger in 2006 and
2016 and estimating projected spending in 2026. We also detail the programs and purposes funded by
federal and state/local investments and the types of federal expenditures that support young children.
How much does the federal government spend on children ages 8 and younger?
In 2016, federal expenditures on young children totaled $247 billion.
Total federal expenditures were $6,817 per child age 8 or younger in 2016, with 78 percent
spent through outlays (spending on federal programs such as Medicaid and nutrition assistance
as well as refundable tax credits) and 22 percent through tax reductions (tax breaks provided to
families with children through the dependent exemption, the nonrefundable portions of child-
related tax credits like the earned income tax credit [EITC], and other tax provisions).
Federal outlays on social security, Medicare, and Medicaid for adults were nearly 10 times the
total outlays on young children.
Tax reductions related to young children are dwarfed by other specific tax reductions, such as
the capital gains tax and the home mortgage interest deduction.
How have federal investments changed over the past decade, and how will they change in the next
decade if we do not alter the present course?
Both federal outlays and tax reductions for children ages 8 and younger increased in real
dollars over the past decade but are projected to decline in the future.
How do federal outlays on children compare with state and local outlays?
States and localities provide the majority of public outlays for all children, particularly through
spending on K–12 education. State and local sources provided 59 percent of total public
spending for children ages 8 and younger in 2006 and 73 percent of total public spending for
children ages 9 to 18.
EXECUTIVE SUMMARY VWhat programs and purposes do federal investments support, and how is this changing?
Ten programs account for more than three-quarters (77 percent) of all federal expenditures on
children ages 8 and younger.
Medicaid is by far the largest program in terms of spending, with $48 billion spent on this age
group in 2016.
The next three largest programs are tax programs: the EITC, child tax credit, and dependent
exemption.
Federal expenditures on children ages 8 and younger increased in nearly all categories over the
past decade, with the fastest growth in health and nutrition programs.
In the next decade, federal expenditures on young children are projected to decline in every
category except health.
To what extent are federal and state/local expenditures targeted to low-income children?
Two-thirds (67 percent) of federal expenditures on children ages 8 and younger in 2016,
including tax expenditures, were on means-tested programs (i.e., programs available only to
families whose incomes fall below a certain threshold).
Only 15 percent of state and local expenditures on young children were on means-tested
programs in 2006. (State and local expenditure data are not available for 2016.)
What forms do federal expenditures on young children take?
Most (63 percent) are mandatory outlays, including the portions of tax credits paid out to
families as a tax refund (16 percent). In 2016, 15 percent were discretionary outlays and 22
percent were tax reductions.
The same year, more than half (56 percent) were in-kind payments, such as health, education,
housing, and nutrition benefits (see figure 13 on page 21). Tax expenditures, including tax
reductions like the dependent exemption and tax outlays like the refundable portion of the
EITC, are the next largest at 22 percent and 16 percent, respectively. Cash payments, such as
Temporary Assistance for Needy Families cash assistance or Social Security survivors’ benefits,
are the least common type of expenditure at just 6 percent.
This report provides information to inform a national discussion about how best to invest future
resources to support children ages 8 and younger.
VI EXECUTIVE SUMMARYSpending on Children Ages 8
and Younger
The period of child development from birth through age 8 sets the foundation for all later development
and shapes the trajectory of a child’s life. Research in neuroscience and social science emphasizes the
importance of caring for and protecting young children to ensure better outcomes in adulthood,
benefiting the children themselves and society as a whole. This report provides a baseline understanding
of federal and state/local investments in children ages 8 and younger to inform discussions about future
investments. How much does the federal government invest in young children? What programs and
purposes do federal and state/local investments support? How have federal investments changed over
the past decade, and how will they change in the next decade under current law?
The Kids’ Share series of annual reports has examined expenditures on children under 18 (see, for
example, Isaacs et al. 2017). Special analyses have examined spending on various age groups, most
recently examining spending in 2008 and 2011 on children ages 6 to 11, 3 to 5, and 2 and younger
(Edelstein et al. 2012). This report expands that research by looking at expenditures on children ages 8
and younger, updated for 2016, the most recent data available, with comparisons to spending in 2006
and projected spending in 2026.
The focus on this group reflects the importance of investing in the youngest children and of this
period’s effect on their future success. Research shows that reading proficiently by the end of third
grade (approximately age 8) can be a “make-or-break benchmark” in a child’s educational development
and later economic success (Fiester 2010). Through third grade, children are only learning to read. In
fourth grade, children begin “reading to learn,” meaning they are using their reading skills to access
knowledge, think critically, and share their learning with others. According to the National Research
Council (1998), “academic success, as defined by high school graduation, can be predicted with
reasonable accuracy by knowing someone’s reading skill at the end of third grade.” High school
graduation is, in turn, another make-or-break benchmark for later economic success, with each high
school dropout costing society $260,000 in lost earnings, taxes, and productivity (Fiester 2010). The
keys to promoting early reading and long-term success include school readiness (ensuring children are
healthy, have supportive families, feel safe, and have positive social and emotional skills), access to high-
quality teachers, regular school attendance, and avoiding family stressors such as hunger and family or
neighborhood violence (Fiester 2013).Although all children are important, spending on the youngest children results in the greatest
return on investment. Early childhood experiences shape young children’s evolving brains and
biochemistry, laying a foundation for academic achievements and influencing longer-term
socioemotional and health outcomes (Shonkoff 2011; Shonkoff and Phillips 2000). Family income
during early childhood affects school readiness and school achievement as well as adult outcomes,
including earnings and others measures of labor market success, and health outcomes (Duncan, Ziol-
Guest, and Kalil 2010). Further, family economic conditions during early childhood influence children’s
skills more than family income during adolescence (Brooks-Gunn and Duncan 1997).
Unfortunately, many young children grow up in poverty and experience economic hardship and
family and personal stress. Poverty rates for children are higher in young childhood than in adolescence,
and the youngest years are when poverty seems to have the strongest negative effects. More than one
in five children (21 percent) ages 8 and younger were living in families with income at or below the
federal poverty level in 2015. Poverty rates were lower among older age groups: 18 percent for children
ages 9 to 18, 12 percent for adults ages 19 to 64, and almost 9 percent for adults ages 65 and older.1
Rigorous research has demonstrated that income supplements, such as a child tax credit, and direct
investments in health care, nutrition assistance, and early education and child care can mitigate the
effects of childhood poverty and have positive effects on children’s educational outcomes and their
later adult health and earnings outcomes. There is also evidence that early investments are less costly
than later remediation:
Expanded eligibility for Medicaid and the Children’s Health Insurance Program (CHIP) not only
improves children’s health insurance coverage, access to care and services, and health
outcomes (Howell and Kenney 2012), it also results in long-term life improvements. Children
who gained access to Medicaid and state Children’s Health Insurance Programs in the 1980s
and 1990s paid more in cumulative taxes, collected less in EITC payments, and had higher
wages by age 28 (Brown, Kowalski, and Lurie 2015).
Children who receive adequate nutrition are healthier and more emotionally stable, do better
in school, and are more likely to graduate from high school (Carlson et al. 2016; Cook and Frank
2008; Frongillo, Jyoti, and Jones 2006). Children who grow up in areas with access to nutrition
assistance have reduced incidence of obesity, high blood pressure, heart disease, and diabetes
as adults. Girls have better employment, income, poverty status, high school graduation, and
program participation outcomes as adults (Hoynes, Schanzenbach, and Almond 2016).
2 SPENDING ON CHILDREN AGES 8 AND YOUNGER The EITC encourages employment, reduces poverty, helps families meet child care expenses
and other basic needs, boosts financial assets and savings, improves children’s achievement in
school, increases college enrollment, and likely increases children’s earnings as adults (Charite,
Dutta-Gupta, and Marr 2012; Marr et al. 2015).2
Children who attend high-quality child care centers have better math, language, social, and
behavioral skills than those in lower quality settings (Peisner-Feinberg et al. 1999).
Understanding the benefits of these investments provides context for our analysis of public
expenditures on young children in the US. This report presents our findings in three parts. We begin
with analyses of how much is spent on children ages 8 and younger, including comparisons to
expenditures on other federal priorities, as well as analyses of past and projected trends. We then
examine in greater detail where these investments are made, including which programs and purposes
receive the greatest investments and how investments have changed and will continue to change over
time. Finally, we examine how funds are spent, including whether expenditures are means-tested to
target low-income children and whether expenditures take the form of cash payments, in-kind
supports, tax reductions, or tax outlays.
SPENDING ON CHILDREN AGES 8 AND YOUNGER 3BOX 1
Methods and Glossary
To estimate government expenditures on children ages 8 and younger, we built on the methods and
estimates developed for the Urban Institute’s previous and ongoing work on spending on children. Our
basic methodology has three steps: First, we identify programs that directly benefit children or
households with children. Second, we collect expenditure data from federal sources, particularly the
Office of Management and Budget’s budget for fiscal year 2018 (OMB 2017a) and prior years, drawing
on its Appendix volume for information on spending and the Analytical Perspectives volume for tax
expenditures. Finally, we estimate the share of each program’s expenditures that directly benefits
children. This report required the additional step of calculating the share of spending on children ages 8
and younger. Further details regarding methods are available in the Data Appendix to Kids’ Share 2017
(Ovalle et al. 2017). This report does not directly address whether government expenditures on
children ages 8 and younger are the right size or invested in the right places. Rather, we provide the
detailed information necessary for an informed debate about our national priorities for investing in
children.
Glossary
Children: People ages 18 and younger.a
Outlays: Direct spending from federal programs as well as the portions of tax credits paid out to
families as a tax refund.
Tax reductions: Reductions in families’ tax liabilities (and revenues losses to the federal
government) resulting from tax exclusions, deductions, and credits that benefit specific activities or
groups of taxpayers. These provisions include the portions of tax credits not paid out to families as
tax refunds.
Expenditures on children: Expenditures from programs and tax provisions that (1) benefit only
children or deliver a portion of benefits directly to children, (2) increase benefit levels for families
with children, or (3) require that families have a child to qualify.
a
Our estimates include spending on 18-year-olds in many federal programs. However, as detailed in the accompanying Data
Appendix to Kids’ Share 2017 (Ovalle et al. 2017), some programs such as Medicaid and Social Security define children as people 17
and younger instead of 18 and younger, and we do not include spending on 18-year-olds for such programs.
4 SPENDING ON CHILDREN AGES 8 AND YOUNGERPart I: How Much Do We Spend
on Children Ages 8 and Younger?
In 2016, 36.2 million US children were ages 8 and younger. Federal expenditures on these children
totaled $247 billion in fiscal year 2016, or $6,817 per child (figure 1). This includes $192 billion ($5,298
per child) in outlays (i.e., spending on federal programs such as Medicaid and nutrition assistance, as
well as refundable tax credits) and $55 billion ($1,519 per child) through tax reductions (i.e., tax breaks
provided to families with children through the dependent exemption, the nonrefundable portions of
child-related tax credits like the EITC, and other tax provisions).
FIGURE 1
Federal Expenditures on Children Ages 8 and Younger, including Outlays and Tax Reductions,
Totaled $247 Billion in 2016
Source: Authors’ estimates based on the Urban-Brookings Tax Policy Center Microsimulation Model and Office of Management
and Budget, Budget of the United States Government, Fiscal Year 2018 (Washington, DC: US Government Printing Office, 2017).
SPENDING ON CHILDREN AGES 8 AND YOUNGER 5How Do Federal Outlays for Young Children
Compare with Other Federal Outlays?
To put the $247 billion spent on young children in context, consider that spending as a share of total
federal expenditures. The $192 billion in federal outlays on children ages 8 and younger represents just 5
percent of total federal outlays (figure 2), less than annual spending on interest on the federal debt. The
federal government spends nearly 10 times as much on Social Security, Medicare, and Medicaid for adults
(46 percent of federal outlays) and 3 times as much on defense (15 percent) as it spends on young children.
We define expenditures on children as funds going to programs where (1) benefits or services are
provided directly to children (e.g., K–12 education), (2) benefit levels increase for families with children
(e.g., the Supplemental Nutrition Assistance Program, or SNAP, formerly called food stamps), or (3) a
family must have a child to qualify for any benefits (e.g., the child tax credit). Therefore, some spending
that may indirectly benefit children, such as unemployment insurance and defense, is not counted
because it does not directly rely on the presence of a child. For federal outlays on Social Security, we
count the Social Security benefits that go to the children of disabled or deceased parents, but we do not
count Social Security benefits that go to their grandparents.
FIGURE 2
Federal Outlays on Social Security, Medicare, and Medicaid for Adults Are Nearly 10 Times Larger
than Total Outlays on Children Ages 8 and Younger
Total federal outlays in 2016
Source: Authors’ estimates based on Office of Management and Budget, Budget of the United States Government, Fiscal Year 2018
(Washington, DC: US Government Printing Office, 2017).
6 SPENDING ON CHILDREN AGES 8 AND YOUNGERHow Do Federal Tax Reductions for Young Children
Compare with Other Tax Reductions?
For additional context, the $55 billion in tax reductions for children ages 8 and younger represents less
than 4 percent of the total $1.47 trillion in federal tax reductions in 2016.3 Tax reductions for the
youngest children were far less than the $245 billion in tax reductions for major housing provisions,
such as the mortgage interest deduction ($61 billion) or the $189 billion in tax reductions from the
exclusion of employer-sponsored health insurance for adults (figure 3). Tax reductions for young
children were also less than half that of several other tax provisions, such as the net exclusion of
pension contributions and earnings, capital gains, and the deferral of income from controlled foreign
corporations.
FIGURE 3
Child-Related Tax Reductions Are Dwarfed by Other Specific Tax Expenditures
Federal expenditures in 2016 on selected tax provisions (billions of 2016 dollars)
Source: Authors’ estimates based on the Urban-Brookings Tax Policy Center Microsimulation Model and Office of Management
and Budget, Budget of the United States Government, Fiscal Year 2018 (Washington, DC: US Government Printing Office, 2017).
Notes: Numbers may not sum to totals because of rounding. Capital gains tax estimate excludes agriculture, timber, iron ore, and
coal. Deferral of income from controlled foreign corporations refers to the normal tax method.
SPENDING ON CHILDREN AGES 8 AND YOUNGER 7What Are the Trends in Federal Expenditures
for Children Over Time?
Federal expenditures, per child, on children ages 8 and younger were larger in 2016 than in 2006 for
both outlays and tax reductions, even after adjusting for inflation (figure 4). But comparing just these
two points in time masks the growth in federal expenditures between 2006 and 2010 in response to the
recession and the subsequent decline.
In the next decade, 2016 to 2026, total expenditures, including outlays and tax reductions, are
projected to continue declining. These projections, also shown in figure 4, follow the assumptions of the
Congressional Budget Office’s baseline projections, supplemented by other sources, and our own
assumptions about the share of individual program spending allocated to young children. As explained
in the appendix, the Congressional Budget Office (CBO) baseline projections generally assume a
continuation of current laws; they assume that appropriations for discretionary spending will be
constrained by caps in the Budget Control Act of 2021 and will rise with inflation in subsequent years.
In the past decade, net growth in per child federal expenditures on young children was 27 percent. Over
the next decade, per child federal expenditures for this age group are projected to shrink 0.6 percent.
Figure 4 separates total expenditures into outlays and tax reductions and shows that the net
growth in outlays from 2006 to 2016 was 35 percent (from $3,919 per child to $5,298). However,
outlays are projected to decline by 0.5 percent to $5,269 per child over the next decade. Federal
expenditures on tax reductions grew by 5 percent (from $1,445 per child to $1,519) but are projected
to shrink by 0.3 percent to $1,515 per child.
How Do Federal Outlays Compare with State and Local
Outlays?
States and localities provide the majority (59 percent) of public outlays for children ages 8 and younger,
particularly through spending on education and child care (figure 5) and 73 percent of public outlays for
children ages 9 to 18 (not shown). States and localities spent $4,707 per young child in 2006 on
education and child care and an additional $920 per child for other purposes. That same year, the
federal government spent $835 per young child on education and child care and $3,085 per child for
other purposes. State and local spending data are not available for 2016, but the general patterns
observed in 2006 have been consistent over time (Edelstein et al. 2016).
8 SPENDING ON CHILDREN AGES 8 AND YOUNGERFIGURE 4
Per Child Federal Expenditures on Young Children Increased in the Past Decade
but Are Projected to Decline in the Future
Federal expenditures, per child, on children ages 8 and younger in 2006, 2016, and 2026 (2016 dollars)
Source: Authors’ estimates based on the Urban-Brookings Tax Policy Center Microsimulation Model and Office of Management
and Budget, Budget of the United States Government, Fiscal Year 2018 (Washington, DC: US Government Printing Office, 2017) and
budgets for past years, and on CBO’s An Update to the Budget and Economic Outlook: 2017 to 2027.
Note: Numbers may not sum to totals because of rounding.
FIGURE 5
State and Local Outlays, Primarily for Education, Are the Largest Source of Public Spending
on Young Children
Total federal and state/local outlays on children in 2006
Source: Authors’ estimates based on Office of Management and Budget, Budget of the United States Government, Fiscal Year 2008
(Washington, DC: US Government Printing Office, 2007) and the Rockefeller Institute of Government’s State Funding for
Children Database.
SPENDING ON CHILDREN AGES 8 AND YOUNGER 9Part II: Where Do We Spend
Federal Funds on Young Children?
More than three-quarters (77 percent) of all federal expenditures on children ages 8 and younger go to
the 10 largest programs. Medicaid is by far the single largest program in terms of spending on children
ages 8 and younger, and expenditures on this age group were $48 billion in 2016. The next three largest
programs are tax programs: the EITC, child tax credit, and dependent exemption. The other programs in
the top 10 are SNAP and other child nutrition programs, the tax exclusion of employer contributions for
health insurance, Head Start, the Temporary Assistance for Needy Families (TANF) block grant, and
Title I education for the disadvantaged. Figure 6 identifies the 10 largest programs and their
expenditures in 2016.
FIGURE 6
Medicaid Leads the List of Top 10 Programs Spending on Children Ages 8 and Younger
Federal expenditures on children ages 8 and younger in 2016 (billions of 2016 dollars)
Source: Authors’ estimates based on the Urban-Brookings Tax Policy Center Microsimulation Model and Office of Management
and Budget, Budget of the United States Government, Fiscal Year 2018 (Washington, DC: US Government Printing Office, 2017).
Note: EITC = earned income tax credit, CTC = child tax credit, SNAP = Supplemental Nutrition Assistance Program, TANF =
Temporary Assistance for Needy Families. Child nutrition spending includes the National School Lunch Program, the School
Breakfast Program, the Child and Adult Care Food Program, the Summer Food Service Program, and the Special Milk Program.
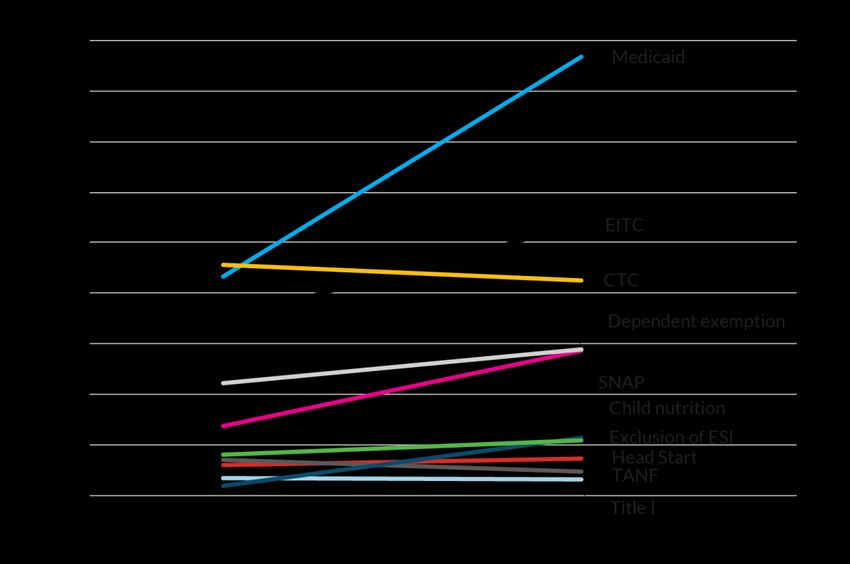
10 SPENDING ON CHILDREN AGES 8 AND YOUNGERHow Have Expenditures on the 10 Largest Programs
Changed in the Past Decade?
In both 2006 and 2016, the same 10 programs had the largest expenditures on children ages 8 and
younger, although the order of the list changed. As health care costs for all Americans grew faster than
inflation, and as more eligible children enrolled in Medicaid, Medicaid expenditures grew sharply to
become the largest source of spending on young children. Spending on the child tax credit fell from
largest to third largest, as both total and per child spending declined. Figure 7 shows how expenditures
for each of the 10 largest programs changed, and details on changes in federal expenditures for all
major programs for children are included in table 1 on page 14.
FIGURE 7
Federal Expenditures on Medicaid Grew Sharply while Expenditures
on the Child Tax Credit Decreased
Federal expenditures on children ages 8 and younger, 2006 and 2016 (billions of 2016 dollars)
Source: Authors’ estimates based on the Urban-Brookings Tax Policy Center Microsimulation Model and Office of Management
and Budget, Budget of the United States Government, Fiscal Year 2018 (Washington, DC: US Government Printing Office, 2017) and
budgets from past years.
Note: Child nutrition spending includes the National School Lunch Program, the School Breakfast Program, the Child and Adult
Care Food Program, the Summer Food Service Program, and the Special Milk Program.
SPENDING ON CHILDREN AGES 8 AND YOUNGER 11How Much Does the Federal Government Spend
per Young Child on Health, Education, Taxes,
and Other Categories?
Federal expenditures on children ages 8 and younger mostly go toward health and tax programs (figure
8). In 2016, federal expenditures per child in this group averaged $1,637 for health programs, $1,519
for tax reductions, and $1,084 for tax outlays (the refundable portion of tax credits). The next largest
categories were nutrition ($979 per child), education and child care ($780 per child), and income
security programs ($569 per child). The smallest expenditures per child were on housing ($145 per
child), social services ($104 per child), and training ($0 per child and therefore not shown).
FIGURE 8
Federal Expenditures on Younger Children Are Primarily on Health and Tax Programs
Expenditures, per child, on children ages 8 and younger in 2016 (2016 dollars)
Source: Authors’ estimates based on the Urban-Brookings Tax Policy Center Microsimulation Model and Office of Management
and Budget, Budget of the United States Government, Fiscal Year 2018 (Washington, DC: US Government Printing Office, 2017).
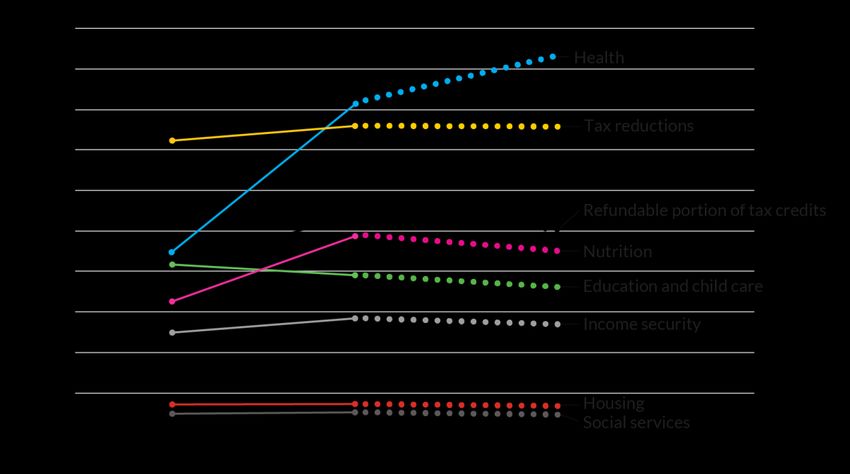
12 SPENDING ON CHILDREN AGES 8 AND YOUNGERHow Are Expenditures per Young Child on Health,
Education, Taxes, and Other Categories Changing?
In the past decade, federal expenditures per child on children ages 8 and younger grew more quickly for
health and nutrition programs than for programs in other areas, but expenditures in almost all areas are
projected to decline over the next decade (figure 9 and table 1). After nearly doubling between 2006
and 2016, health spending is the only area projected to see continued growth (albeit at a slower rate). In
contrast, between 2006 and 2016, education and child care was the only category where federal
expenditures declined. Spending per child is projected to be even lower in 2026 than in 2006 for
housing, social services, and education and child care programs. These projections assume a
continuation of current policies and do not reflect any proposals for spending cuts (such as those
proposed in the administration’s budget).
FIGURE 9
Nearly All Categories of Federal Expenditures on Children Ages 8 and Younger Grew
in the Past Decade but Are Projected to Decline in the Future
Federal expenditures, per child, in 2006, 2016, and 2026 (2016 dollars)
Source: Authors’ estimates based on the Urban-Brookings Tax Policy Center Microsimulation Model and Office of Management
and Budget, Budget of the United States Government, Fiscal Year 2018 (Washington, DC: US Government Printing Office, 2017) and
budgets from past years, and on CBO’s An Update to the Budget and Economic Outlook: 2017 to 2027.
SPENDING ON CHILDREN AGES 8 AND YOUNGER 13TABLE 1
Federal Expenditures on Children Ages 8 and Younger in 2006 and 2016 by Category and Program
Billions of 2016 dollars
Change in
2006 2016 spending (%)
Health 31.5 59.2 88
Medicaid 26.6 48.4 82
CHIP 2.1 6.1 186
Vaccines for children 1.5 3.2 118
Immunization 0.4 0.5 22
Other health 0.8 1.0 21
Nutrition 23.0 35.4 54
SNAP 11.9 19.4 64
Child nutrition 6.0 10.7 79
Special supplemental food (WIC) 5.1 5.3 3
Education and child care 29.7 28.2 -5
Head Start (including Early Head Start) 8.0 8.7 8
Education for the Disadvantaged (Title I, Part A) 6.8 6.6 -2
Child Care and Development Fund 5.6 4.8 -14
Special Education/IDEA 4.9 4.4 -11
School improvement 2.1 1.3 -38
Other education 2.3 2.4 5
Training programs 0.0 0.0 0
Income security 17.7 20.6 17
Temporary Assistance for Needy Families 8.6 7.3 -14
Supplemental Security Income 3.3 4.3 29
Social Security 3.5 3.4 -2
Veterans compensation (disability compensation) 0.6 3.4 472
Net child support enforcement 1.6 1.6 0
Other income security 0.1 0.6 386
Housing 5.1 5.2 3
Section 8 low-income housing assistance 4.1 4.3 5
Low-rent public housing 0.6 0.6 8
Other housing 0.4 0.3 -21
Social services 3.5 3.8 9
Foster care 1.2 1.7 46
Adoption assistance 0.7 0.8 18
Other social services 1.6 1.2 -22
Refundable portion of tax credits 29.1 39.2 35
Earned income tax credit 19.7 28.1 43
Child tax credit 9.4 10.7 14
Other refundable tax credits 0.0 0.4 0
Reductions in taxes 51.4 55.0 7
Dependent exemption 16.1 19.4 20
Child tax credit (nonrefundable portion) 18.4 15.6 -15
Exclusion for employer-sponsored health insurance 9.0 10.4 15
Earned income tax credit (nonrefundable portion) 2.7 3.6 32
Dependent care credit 3.1 3.5 15
Exclusion of employer-provided child care 0.7 0.8 16
Other tax reductions 1.3 1.6 18
Total expenditures on children ages 8 and younger 190.9 246.6 29
(outlays and reductions in taxes)
14 SPENDING ON CHILDREN AGES 8 AND YOUNGERChange in
2006 2016 spending (%)
Outlays subtotal 139.5 191.7 37
(all spending programs and refundable portions of tax
credits)
Tax provisions subtotal 80.5 94.2 17
(reductions in taxes and spending on refundable credits)
Source: Authors’ estimates based on the Urban-Brookings Tax Policy Center Microsimulation Model and Office of Management
and Budget, Budget of the United States Government, Fiscal Year 2018 (Washington, DC: US Government Printing Office, 2017) and
budgets from past years.
Notes: Because this analysis shows outlays, rather than appropriated or authorized levels, and because the dollars are adjusted
for inflation, these estimates may differ from other published estimates. Other health covers the Maternal and Child Health block
grant, children’s graduate medical education, lead hazard reduction, children’s mental health services, birth
defects/developmental disabilities, Healthy Start, emergency medical services for children, universal newborn hearing, home
visiting, and school-based health care. Child nutrition includes the National School Lunch Program, the School Breakfast Program,
the Child and Adult Care Food Program, the Summer Food Service Program, and Special Milk program. The nutrition category
also included the Commodity Supplemental Food program in 2006, which spent $10.2 million on children ages 9 to 18 but spent
nothing on young children. Net child support enforcement consists of gross child support enforcement minus the federal share of
child support collections. In 2006, federal expenditures on gross child support enforcement for young children was $2.2 billion,
and young children’s share of federal child support collections was $0.6 billion (both 2016 dollars). In 2016, these figures were
$1.9 billion and $0.3 billion, respectively. Other income security includes Railroad Retirement, survivors’ compensation,
survivors’ pensions, and veterans pensions. Other education includes dependents’ schools abroad, Safe Routes to Schools, Impact
Aid, career and technical education, Indian education, English language acquisition, domestic schools, the Institute of Education
Sciences, innovation and improvement, safe schools and citizenship education, and Junior ROTC. The education and child care
category also included the hurricane education recovery program in 2006, which had $1.2 billion in spending on children ages 9
to 18 but spent nothing on younger children. Training includes Job Corps, Workforce Investment Act Youth Formula Grants,
Youth Offender Grants, and YouthBuild Grants. Other housing includes rental housing assistance, rent supplement, and low-
income home energy assistance. Other social services includes the Social Services Block Grant, the Community Services Block
Grant, child welfare services and training, Safe and Stable Families, juvenile justice, guardianship, independent living, missing
children, children’s research and technical assistance, PREP and abstinence education, and certain child and family services
programs. Other refundable tax credits include outlays from cost-sharing reductions and the refundable portion of Qualified
Zone Academy Bonds, Qualified School Construction Bonds, and premium tax credits for health insurance bought on the
exchange. Other tax expenditures include the employer-provided child care credit, exclusion of certain foster care payments,
adoption credit and exclusion, assistance for adopted foster children, exclusion for Social Security retirement and dependents’
and survivors’ benefits, exclusion for Social Security disability benefits, exclusion for public assistance benefits, exclusion for
veterans death benefits and disability compensation, and the nonrefundable portion of Qualified Zone Academy Bonds, Qualified
School Construction Bonds, and the premium tax credit for health insurance bought on the exchange.
Below, we highlight the changes from 2006 to 2016 for each category of federal expenditures on
children ages 8 and younger, as detailed in table 1. For context, the population of young children grew
from 35.6 million in 2006 to 36.2 million in 2016 (declining from 11.9 to 11.2 percent of the total US
population).
Health. Federal health expenditures grew by 88 percent, from $31.5 billion in 2006 to $59.2
billion in 2016. Although Medicaid spends the most overall among health programs ($48.4
billion in 2016), the largest increase in spending occurred in CHIP, which grew 186 percent
SPENDING ON CHILDREN AGES 8 AND YOUNGER 15from $2.1 billion to $6.1 billion. A major factor in the growth of health spending on young
children is that more eligible children have enrolled in Medicaid and CHIP as a result of
extensive efforts to improve access. In 2015, 93 percent of children eligible for Medicaid or
CHIP participated in those programs (Kenney et al. 2017).
Nutrition. Federal expenditures on nutrition programs grew by 54 percent, from $23 billion in
2006 to $35.4 billion in 2016. The largest nutrition program is SNAP, which spent $19.4 billion
on children ages 8 and younger in 2016, 64 percent more than the $11.9 billion it spent in 2006.
The largest growth among nutrition programs was a 79 percent increase in spending on child
nutrition, which includes the National School Lunch and Breakfast programs, the Summer Food
Service Program, and the Special Milk Program. SNAP and these child nutrition programs are all
means-tested programs that increased enrollment during the recession in response to greater
need. Although SNAP spending in 2016 was higher than in 2006, it has been in decline since
2010. Child nutrition program expenditures, however, have continued to grow.
Education. Education and child care expenditures on young children declined by $1.5 billion (5
percent) between 2006 and 2016 as spending declined for nearly every individual education
and child care program. Head Start, the largest education program for children 8 and younger,
was an exception, and its spending grew by $700 million (8 percent). The largest decline was in
spending on school improvement programs, which decreased 38 percent from $2.1 billion to
$1.3 billion.
Income security. Federal expenditures on income security programs for young children
increased by 17 percent, from $17.7 billion in 2006 to $20.6 billion in 2016. Driving this
increase was a 472 percent increase in veterans benefits, from $600 million to $3.4 billion, as
conflicts in the Middle East have resulted in more disabled veterans or deceased service
members with young children. This increase and a $1 billion increase in Supplemental Security
Income for low-income children with disabilities were offset somewhat by decreases of $1.3
billion in spending on TANF cash assistance and of $100 million in spending on Social Security
survivors’ and dependents’ benefits.
Housing. Federal expenditures on housing programs for children ages 8 and younger changed
only slightly, increasing 3 percent from $5.1 billion in 2006 to $5.2 billion in 2016. Slight
increases in spending on Section 8 low-income housing assistance and low-rent public housing
were partially offset by declines in spending on smaller programs for rental housing assistance
and low-income home energy assistance.
16 SPENDING ON CHILDREN AGES 8 AND YOUNGER Social services. Federal expenditures on social services for young children increased by 9
percent, from $3.5 billion in 2006 to $3.8 billion in 2016. The largest increase was in foster care
assistance, which grew 46 percent from $1.2 billion to $1.7 billion. Spending on adoption
assistance also grew by $100 million (18 percent), but expenditures on other social services,
such as the Social Services Block Grant, the Community Services Block Grant, and child welfare
services, decreased by $400 million (22 percent).
Tax outlays (refundable portion of tax credits). Federal expenditures on the refundable
portion of tax credits for children ages 8 and younger increased by 35 percent, from $29.1
billion in 2006 to $39.2 billion in 2016. The greatest expenditure increase was on outlays for
the EITC, which increased 43 percent from $19.7 billion to $28.1 billion. Child tax credit outlays
also grew from $9.4 billion to $10.7 billion, a 14 percent increase.
Tax reductions. Federal expenditures on tax reductions for children ages 8 and younger
increased by 7 percent, from $51.4 billion in 2006 to $55.0 billion in 2016. The greatest
expenditure increase in dollars was on the dependent exemption, which grew 20 percent from
$16.1 billion to $19.4 billion. The greatest percentage increase was in expenditures on the
nonrefundable portion of the EITC, which grew 32 percent from $2.7 billion to $3.6 billion.
Other increases occurred in expenditures on the exclusion for employer-sponsored health
insurance ($1.4 billion), the dependent care credit ($400 million), the exclusion of employer-
provided child care ($100 million), and other tax provisions ($300 million). Notably,
expenditures on the nonrefundable portion of the child tax credit decreased 15 percent from
$18.4 billion to $15.6 billion.
SPENDING ON CHILDREN AGES 8 AND YOUNGER 17Part III: How Do We Spend
Federal Funds on Young Children?
How Targeted Are Federal Expenditures
to Young Children in Low-Income Families?
Some federal expenditures support programs available to all children regardless of family income, such
as the dependent exemption and Social Security survivors’ and dependents’ benefits. Other
expenditures are targeted to children in low-income families through means-tested programs available
only to families whose incomes fall below a certain threshold. In 2016, 67 percent of federal
expenditures, including tax expenditures, on children ages 8 and younger were on means-tested
programs (figure 10). Means-tested programs have grown as a share of federal expenditures for young
children over the past decade, and the share is projected to hold steady through 2026.4
FIGURE 10
Federal Expenditures on Means-Tested Programs for Children Ages 8 and Younger Grew in the Past
Decade and Is Projected to Hold Steady in the Future
Share of total federal expenditures on young children in 2006, 2016, and 2026
Source: Authors’ estimates based on the Urban-Brookings Tax Policy Center Microsimulation Model and Office of Management
and Budget, Budget of the United States Government, Fiscal Year 2018 (Washington, DC: US Government Printing Office, 2017) and
budgets from past years, and on CBO’s An Update to the Budget and Economic Outlook: 2017 to 2027.
18 SPENDING ON CHILDREN AGES 8 AND YOUNGERHow Does Targeting of Federal Expenditures
for Young Children Compare with Targeting
of State and Local Expenditures?
Federal expenditures are more targeted to low-income children than state and local expenditures are
(figure 11). Among federal expenditures on children ages 8 and younger in 2006, 61 percent of
expenditures were directed to means-tested programs. Only 15 percent of state and local expenditures
in 2006 were on means-tested programs (e.g., Medicaid) as opposed to universal programs (e.g., public
schools). Because most public spending on children ages 8 and younger comes from states and localities,
only 37 percent of total public expenditures in 2006 were on means-tested programs. State and local
expenditure data are not available for 2016, but federal spending for all children 18 and younger has
consistently been more targeted than state and local spending.
FIGURE 11
Federal Expenditures for Children Ages 8 and Younger Has Been More Targeted than State and Local
Expenditures
Share of federal, state/local, and total expenditures in 2006 on means-tested programs for young children
Sources: Authors’ estimates based on the Urban-Brookings Tax Policy Center Microsimulation Model and Office of Management
and Budget, Budget of the United States Government, Fiscal Year 2008 (Washington, DC: US Government Printing Office, 2007), the
Rockefeller Institute of Government’s State Funding for Children Database, and various sources. See Ovalle and colleagues
(2017).
SPENDING ON CHILDREN AGES 8 AND YOUNGER 19What Share of Federal Expenditures on Children
Are Mandatory, Discretionary, or Tax Expenditures?
Federal expenditures on children come in many forms. Discretionary outlays are direct spending on
programs, and policymakers must decide each year how much money to provide through annual
appropriations acts. In 2016, 15 percent of federal expenditures on children ages 8 and younger were
discretionary outlays (figure 12). Mandatory outlays, in contrast, are governed by programmatic rules
that determine the amount spent on a program each year. For example, Medicaid spending is
determined by the services used and other programmatic rules, rather than a deliberate decision by
Congress. One special type of mandatory outlay is the portion of tax credits paid out to families as a tax
refund. In 2016, 16 percent of federal expenditures on young children was through this type of outlay,
and an additional 46 percent was on other mandatory outlays. Tax reductions are another type of
federal expenditure. These are the reductions in families’ tax liabilities resulting from tax provisions,
including the portions of tax credits not paid out to families as tax refunds. In 2016, tax reductions made
up 22 percent of federal expenditures on young children.
FIGURE 12
Most Expenditures on Children Ages 8 and Younger Are Mandatory Outlays and Refundable Tax
Credits
Share of total federal expenditures on children in 2016
Source: Authors’ estimates based on the Urban-Brookings Tax Policy Center Microsimulation Model and Office of Management
and Budget, Budget of the United States Government, Fiscal Year 2018 (Washington, DC: US Government Printing Office, 2017).
Note: Percentages may not sum to 100 because of rounding.
20 SPENDING ON CHILDREN AGES 8 AND YOUNGERHow Do Young Children Receive Federal Expenditures?
More than half (56 percent) of federal expenditures on children ages 8 and younger in 2016 were in-
kind payments, such as health, education, housing, and nutrition benefits (figure 13). Tax expenditures,
including tax reductions like the dependent exemption and tax outlays like the refundable portion of
the EITC, are the next largest types of federal expenditure for this age group at 22 percent and 16
percent, respectively. Cash payments, such as TANF cash assistance or Social Security survivors’
benefits, are the least common expenditure and make up just 6 percent of spending on young children.
Relative use of each type of expenditure has remained consistent over time, and this pattern is
projected to continue into 2026.
FIGURE 13
More Than Half of Expenditures on Children Ages 8 and Younger Are Through In-Kind Payments
Share of total federal expenditures on children in 2016
Source: Authors’ estimates based on the Urban-Brookings Tax Policy Center Microsimulation Model and Office of Management
and Budget, Budget of the United States Government, Fiscal Year 2018 (Washington, DC: US Government Printing Office, 2017).
SPENDING ON CHILDREN AGES 8 AND YOUNGER 21Conclusion
This report answers several questions about federal, state, and local investments in children ages 8 and
younger. It addresses how much the federal government spends and where and how those funds are
spent.
Outlays for young children make up just 5 percent of total federal outlays, and tax reductions for
this age group are just 4 percent of total federal tax reductions. The $247 billion invested in young
children in 2016 consisted mostly of health spending (particularly on Medicaid), which has grown
dramatically in the past decade and is projected to continue growing (albeit at a slower rate) in the next.
Tax programs are another major component of federal expenditures. Three of the four largest programs
for this age group are tax programs, and tax expenditures are the only expenditure category other than
health projected to grow in the near future. Assuming a continuation of current policies, expenditures in
all other categories are projected to decline through 2026. Over the past decade, the greatest
expenditure decreases were in education and child care, and spending in these areas is projected to
continue falling.
Although this report focuses primarily on federal expenditures, states and localities provide the
majority of funding for young children, mainly through spending on public education. However, state
and local expenditures are much less targeted than federal expenditures. This report provides
information to inform a national discussion about how best to invest future resources to support
children during this critical time in their development.
22 SPENDING ON CHILDREN AGES 8 AND YOUNGERAppendix A. Methods
To estimate government expenditures on children ages 8 and younger, we built on the methods and
estimates developed for the Urban Institute’s previous and ongoing work on spending on children. Our
basic methodology has three steps: First, we identify programs that directly benefit children or
households with children. Second, we collect expenditure data from federal sources, particularly the
Office of Management and Budget’s budget for fiscal year 2018 (OMB 2017a) and prior years, drawing
on its Appendix volume for information on spending and the Analytical Perspectives volume for tax
expenditures. Finally, we estimate the share of each program’s spending that directly benefits children.
This report required the additional step of calculating the share of expenditures on children ages 8
and younger. These methodological steps are described below. Further details regarding methods are
available in the Data Appendix to Kids’ Share 2017 (Ovalle et al. 2017).
Defining and Identifying Programs Benefiting Children
Like all budget exercises that allocate spending to categories, defining spending that goes to children is
a complex task that could be calculated using different methodologies. Each dollar spent on a particular
program must be categorized as going to a particular recipient group. This task is relatively
straightforward for programs that spend directly on children, such as elementary education. But for
programs that serve both children and adults, discerning who benefits from spending is more difficult.
For example, how should one determine the amount of refundable tax credits, such as the EITC,
distributed to adults rather than to children? Therefore, our calculations require a concrete and
consistent set of rules and assumptions.
To be included in this analysis, a program (as a whole or in part) must meet at least one of the
following criteria:
Benefits or services are provided entirely to children (e.g., K–12 education programs, Head
Start), or a portion of benefits are delivered directly to children (e.g., SSI payments for disabled
children, Medicaid services for children);
family benefit levels increase for households with children (e.g., SNAP, low-rent public housing);
or
APPENDIX 23 a family must have children to qualify for any benefits (e.g., TANF, the child tax credit, the
dependent exemption).
Therefore, some services that may benefit children are excluded from our calculations because they
do not directly rely on the presence of a child. For example, unemployment insurance and some tax
benefits for homeownership may indirectly benefit children, but because being a child or having a child
are not prerequisites for these services, and because having a child does not result in any additional
benefit, they do not meet the criteria. Additionally, we do not include programs that provide benefits to
the general population, such as roads, communications, national parks, and environmental protection.
In reporting federal expenditures on children, our most comprehensive measure includes tax
expenditures (e.g., reduced tax liabilities as a result of the child tax credit, the dependent exemption, or
other provisions in the tax code) as well as direct outlays from programs such as Medicaid, child
nutrition programs, and education programs. In other areas, we focus solely on federal outlays for
children, such as when we report the share of total federal outlays spent on children. Some tax
provisions are included in our estimates as outlays: the portions of the EITC and the child tax credit paid
out to families as a tax refund (and treated by the Treasury Department as outlays rather than as
reductions in tax liabilities) and the outlay portions of smaller tax provisions (e.g., outlays associated
with Qualified Zone Academy Bonds). The division of tax subsidies between outlays for the refundable
portion of credits and tax expenditures for the nonrefundable portion adheres to standard budget
accounting practices.
Collecting Expenditure Data
Expenditure data on program outlays largely come from the appendix to the budget of the United
States government for fiscal year 2018 (OMB 2017a) and budgets from past years. The Analytical
Perspectives volume of the budget provides tax expenditure data. We obtain expenditure data for
programs not included in the appendix from the relevant agencies’ budgetary documents or from
agency representatives. In this report, all budget numbers represent fiscal years, and we have
expressed them in 2016 dollars unless otherwise noted.
24 APPENDIXCalculating the Share of Program Spending on Children
Some programs spend exclusively on children, and others benefit the general population regardless of
age. We calculate the share of each program’s spending going to children in one of the following ways:
For programs that serve children only, we assume 100 percent of program expenditures
(including benefits and associated administrative costs) go to children.
For programs that directly serve children and adults (e.g., Medicaid), we determine the
percentage of program expenditures that go to children.
For programs that provide benefits only to households with children, where the benefit amount
is determined by the number of children (e.g., child tax credit, dependent exemption), we
assume 100 percent of program expenditures go to children.
For programs that provide families benefits without any delineation between shares for
parents and for children (e.g., TANF and SNAP), we generally estimate the children’s share
based on the number of children and adults in the family, assuming equal benefits per capita
within the family.
For large programs, such as SNAP, Medicaid, and SSI, we put significant effort into correctly
estimating the share of spending that goes to children. In some cases, programs publicly release
administrative data on spending on children, but we must occasionally contact federal agency staff
directly to obtain participation data. Using the best data available, we then calculate spending on
children. When program data are unavailable, other Urban Institute researchers provide carefully
crafted estimates using, for example, the Urban Institute’s Transfer Income Model. In some cases, we
search government agency websites or contact federal agency staff directly to obtain program
participation information.
Calculating the Share of Program Spending on Children
Ages 8 and Younger
We used a variety of specific methods to calculate the share of program spending on young children,
depending on the type of program and the level of detail available in the program data. When available,
we used program data to estimate the share of program funding spent on young children as a
percentage of estimated spending on children ages 18 and younger. When these data were not
APPENDIX 25available, we obtained specialized data tabulations from agency staff or Urban Institute experts. When
data were sufficiently detailed, we used total program dollars to determine the share of expenditures for
children ages 8 and younger. In some cases (e.g., TANF), we had information only on program recipients
who were ages 8 and younger and could not adjust for possible differences in the size of benefits going
to children of different ages. Finally, for some smaller programs without data on spending or recipients
by age, we simply assumed that spending on children was distributed equally across age groups. The
Data Appendix to Kids’ Share 2017 (Ovalle et al. 2017) includes information on how we determined the
share of expenditures on young children for each program.
Methods for State and Local Estimates
Although this report focuses on federal expenditures, it also estimates state and local spending on
children in 2006. This estimate focuses on state and local expenditures for K–12 education, Medicaid,
six other major federal programs (CHIP, Maternal and Child Health Block Grants, TANF, child support
enforcement, child care, and child welfare), and state earned income tax credits. Separate state
programs are included to the extent that they appear in federal reporting requirements. Specifically,
TANF separate state programs are included; state education spending on prekindergarten is included;
and state health, child care, and child welfare spending is included to the extent it is claimed as
maintenance of effort or matching under federal health, child care, or TANF programs. However, except
for state earned income tax credits, state spending not associated with or appearing in federal reporting
is not included. Spending on territories was not included. Note that the annual reporting period for
these estimates varies, from a school year (July 2006–June 2007) for education programs, the federal
fiscal year (October 2005–September 2006) for major federal programs, to the calendar year for the
earned income tax credits. With the exception of Medicaid, we assume the share of program spending
going to all children and to children ages 8 and younger was the same in the state and local estimates as
in the federal estimates. We estimated the share of Medicaid spending going to all children and children
ages 8 and younger on a state-by-state basis, then applied federal matching rates.
Methods for Projections
To estimate future spending trends for children, we primarily use the Congressional Budget Office’s
Updated Budget Projections: 2017 to 2027. To project expenditures under tax provisions, we turn to
the Urban-Brookings Tax Policy Center’s Microsimulation Model for major tax provisions and the
26 APPENDIXYou can also read


