Shallow pooling for sparse labels
←
→
Page content transcription
If your browser does not render page correctly, please read the page content below
Shallow pooling for sparse labels
                                         Negar Arabzadeh             Alexandra Vtyurina               Xinyi Yan           Charles L. A. Clarke
                                                      School of Computer Science, University of Waterloo, Canada

                                                                                         Abstract
arXiv:2109.00062v1 [cs.IR] 31 Aug 2021

                                             Recent years have seen enormous gains in core information retrieval tasks, including document and
                                         passage ranking. Datasets and leaderboards, and in particular the MS MARCO datasets, illustrate the
                                         dramatic improvements achieved by modern neural rankers. When compared with traditional infor-
                                         mation retrieval test collections, such as those developed by TREC, the MS MARCO datasets employ
                                         substantially more queries — thousands vs. dozens – with substantially fewer known relevant items per
                                         query — often just one. For example, 94% of the nearly seven thousand queries in the MS MARCO
                                         passage ranking development set have only a single known relevant passage, and no query has more than
                                         four. Given the sparsity of these relevance labels, the MS MARCO leaderboards track improvements
                                         with mean reciprocal rank (MRR). In essence, a relevant item is treated as the “right answer”, with
                                         rankers scored on their ability to place this item as high in the ranking as possible. In working with
                                         these sparse labels, we have observed that the top items returned by a ranker often appear superior to
                                         judged relevant items. Others have reported the same observation.
                                             To test this observation, we employed crowdsourced workers to make preference judgments between
                                         the top item returned by a modern neural ranking stack and a judged relevant item for the nearly seven
                                         thousand queries in the passage ranking development set. The results support our observation. If we
                                         imagine a perfect ranker under MRR, with a score of 1 on all queries, our preference judgments indicate
                                         that a searcher would prefer the top result from a modern neural ranking stack more frequently than the
                                         top result from the imaginary perfect ranker, making our neural ranker “better than perfect”.
                                             To understand the implications for the leaderboard, we pooled the top document from available
                                         runs near the top of the passage ranking leaderboard for over 500 queries. We employed crowdsourced
                                         workers to make preference judgments over these pools and re-evaluated the runs. Our results support our
                                         concerns that current MS MARCO datasets may no longer be able to recognize genuine improvements in
                                         rankers. In future, if rankers are measured against a single “right answer”, this answer should be the best
                                         answer or most preferred answer, and maintained with ongoing judgments. Since only the best answer
                                         is required, this ongoing maintenance might be performed with shallow pooling. When a previously
                                         unjudged document is surfaced as the top item in a ranking, it can directly compared with the previous
                                         known best answer.

                                                                                             1
1 Introduction
The last three years have seen a dramatic shift in the state-of-the-art for many core IR tasks. As recently
as 2018 it was unclear that neural rankers could outperform non-neural rankers on traditional “ad hoc”
document and passage ranking tasks when only content-based, textual features are available [18]. For well
over a decade, non-neural learning-to-rank methods have become firmly established in contexts where many
non-content features are available, such as web search [2, 16]. Unfortunately, attempts to extend these
methods to content-based ranking have had a mixed record unless substantial volumes of data training are
available [34, 6].
Before 2018, a state-of-the-art ranker for these core document and passage ranking tasks might em-
ploy BM25 followed by a pseudo-relevance feedback method such as RM3, as typified by the open-source
Anserini system1 from the University of Waterloo [38]. Today, a state-of-the-art ranker might employ a
dense retriever [36, 30, 15, 17] followed by one or more transformer-based re-rankers [25, 27, 13]. The current
state-of-the-art might best be represented by RocketQA, a dense retriever which utilizes a dual encoder as
well as a cross encoder architecture in order to learn dense representations of queries and passages [30].
If we lay efficiency issues aside, the long-established and well-known classical IR methods have now been
completely superannuated.
Over this three-year period, the IR community has tracked progress on a number of leaderboards, most
notably the MS MARCO2 leaderboards [19, 11]. The MS MARCO project creates test collections focused on
deep learning for search. Each test collection is based on a corpus of passages or documents, and comprises
a set of training queries, a set of development (i.e., validation) queries, and a set of evaluation (i.e., test)
queries. With a few exceptions, each query has one known relevant item in the associated corpus. We call
these labeled relevant items “qrels” for simplicity3 . For the training and development sets these qrels are
public. For the evaluation sets, the qrels are private. To establish a place on a leaderboard, research groups
train and validate rankers with the training and development sets, run the evaluation queries to produce a
ranked list for each query, and submit this run to the MS MARCO team.
Since there is often only one qrel per query, these leaderboards use mean reciprocal rank (MRR) as
their tracking measure. In effect, a qrel represents a “right answer”, and rankers are evaluated on their
ability to place this answer as close to the top as possible. This approach stands in contrast to the approach
used for many traditional information retrieval evaluations, such as those conducted as part of the long
running TREC evaluation exercise4 . In a typical TREC experiment, top-ranked items from each submission
are pooled for relevance judgments, so that measures such as NDCG may be applied. Unfortunately, even
relatively shallow pooling (e.g., the top three items from each submission to compute NDCG@3) often
requires dozens of judgments per query, limiting the number of queries for each experiment. As we will
discuss in Section 2.1 the method used to identify MS MARCO qrels supports our view that these qrels do
not reflect relevance in the traditional sense, but instead only represent an attempt to identify an answer,
and not necessarily the best answer.
In this paper, we focus our attention on the MS MARCO passage retrieval leaderboard. We have no
evidence that the concerns raised in this paper would apply to the document retrieval leaderboard, but we also
have no evidence that they wouldn’t, and we leave that investigation to future work. For the passage retrieval
leaderboard the corpus comprises 8.8 million passages extracted from web pages, with queries sampled from
the Bing search engine. For this leaderboard, the training set comprises over 500K queries, the development
set comprises 6,980 queries, and the evaluation set comprises 6,837 queries. In the development set 6590
queries (94%) have only a single qrel and no query has more than 4 qrels. The development set is public
while the evaluation set is kept private.
While the passage retrieval leaderboard tracks improvements over both the development and evaluation
1 https://github.com/castorini/anserini
2 https://microsoft.github.io/msmarco/
3 In established jargon, the word “qrel” describes any judgment, which could be relevant or non-relevant, graded or binary,
multi-faceted, etc. Here, we use the term exclusively to mean an item judged relevant on a binary scale. MS MARCO collections
do not contain explicitly non-relevant items, so that MS MACRO qrels always indicate a relevant item
4 https://trec.nist.gov
2sets, MRR@10 on the evaluation set provides the official tracking measure. The first official baseline estab-
lished on November 1, 2018 used standard methods dating back to the nineties and achieved an MRR@10 of
0.165 on the development set and an MRR@10 of 0.167 on the evaluation set. At the time our experiments
were conducted (January-May 2021) MRR@10 had progressed to 0.426 on the development set and 0.439 on
the evaluation set [30]. This result was established by RocketQA on September 18, 2020, and it remained
state-of-the-art until July 2021.
In attempting to claim a rung on the leaderboard for ourselves, we observed that the top passages returned
by our ranker often appeared as good as, or even superior to, the qrels. We are not the only researchers to
make this observation. The creators of RocketQA write, “...we manually examine the top-ranked passages
(retrieved by our retriever) that were not labeled as positives in the original MSMARCO dataset, and we
find that 70% of them are actually positives or highly relevant.” Based on this observation, they trained a
model with a dual encoder architecture that is able to perform cross-batch negative sampling, consequently
decreasing the probability of selecting false negative in the training step. Compared to other state-of-the-art
dense retrievers, their proposed approach focuses on importance of selecting negative samples in the training
step. In part, their success depends on explicitly recognizing that an official “right answer” may not be the
best answer.
We were disturbed by the ramifications of these observations. Based on these observations, the current
state-of-the-art could be out-performing the qrels. A hypothetical “perfect” ranking, a ranking with an MRR
of 1.0, would have a qrel at rank one for each query. If the state-of-the-art rankers were surfacing passages
that were superior to the qrels, the hypothetical perfect ranking could be inferior to the state-of-the-art. If
we placed the top result returned by a state-of-the-art ranker next to a qrel, which would people prefer? If
they would prefer the top result more often, then the state-of-the-art ranking could be viewed as a “better
than the perfect” result. Can progress be properly measured if rankers are already better than perfect?
In the remainder of the paper, we explore these observations and their ramifications. In Section 3 we
describe an experiment to crowdsource comparisons between the top results from a modern neural ranker
and the qrels, confirming our observations. Consistent with the method by which the original qrels were
created, we employ preference judgments rather than typical pointwise relevance judgments, since our goal
is to determine the better answer. Given the quality of current neural rankers, both answers are likely to be
relevant in any traditional sense.
In section 4 we pool the top passage from available runs on the development set for 500 queries to either
select a new answer for these queries or to confirm the qrel as the best known answer. These runs were
either generated from code in github repositories and checked against the leaderboard, or provided to us by
the MS MARCO team. In Section 5 we compare runs using these new qrels to examine possible impacts
and implications for current leaderboards. We conclude with suggestions for the future development and
maintenance for datasets with sparse labels.
2 Background
2.1 MS MARCO
A recent perspective paper by Craswell et al. [11] provides a complete exposition on the background and
status of the MS MARCO project. That paper carefully and thoroughly addresses many common concerns
regarding the MS MACRO datasets, including questions of internal validity, robust usefulness, and the
reliability of statistical tests. In this section, we provide only the background required to fully understand
of the work reported in the current paper. In particular, Craswell et al. [11] address concerns raised by
Ferrante et al. [12] who apply measurement theory to draw attention to important shortcomings of established
evaluation measures, such as MRR. Many of these measures are not interval scaled, and therefore many
common statistical tests are not permissible, and properly these measures should not even be averaged.
These concerns are further addressed in a related paper by the same authors [19], which we recommend to
readers sharing these specific concerns.
In this paper, we focus solely on the process employed to select the qrel for each topic. Craswell et al. [11]
3address this external validity concern as well, writing, “...there could be quirks of the MS MARCO sparse
labeling that pretrained transformer models can learn, giving good performance on MS MARCO sparse labels
in the test set, but the improvements would vanish if we relabeled the data with slightly different judging
scheme. In that case, the results would be specific to the setup of our study, lacking external validity. We
could only claim a real improvement if we think real users have exactly the same quirks as the MS MARCO
labels”.
They argue that this concern is addressed by experiments conducted for the TREC Deep Learning
Track [9, 10], which follows the typical methodology of a TREC evaluation exercise. In a traditional TREC-
style evaluation exercises, the top items from each submission are pooled to a fixed depth, perhaps ten or
more, and these items are individually judged by assessors with respect to a defined relevance scale. Craswell
et al. [11] compare the performance of top run from the MS MARCO leaderboard with best TREC run sub-
mitted to the TREC Deep Learning Track on a held-out query set from a private MS MARCO leaderboard.
The top run from the leader board is not as highly ranked when it is evaluated by the comprehensive TREC
labels. They hypothesize that some TREC runs might have used previous TREC 2019 labels. Even though
the pretrained transformer models can still perform well on TREC labels, this observation could indicate
the lack of external validity.
Commercial search services make attempts to fully judge items to some specified depth k. As changes
and improvements to commercial rankers cause them to surface previously unjudged items, these items are
judged individually according to established guidelines5 . With complete judgments for the top k items,
measures such as NDCG@k may be computed.
The creators of the MS MARCO collections followed a different path, possibly due to the origins of the
MS MARCO passage collection as a reading comprehension dataset [24]. Queries for the collection were
extracted from the logs of the Bing search engine, with an emphasis on queries that took the form of a
question. Top documents were retrieved by Bing and 10 candidate passages were automatically extracted
from these documents. These passages were shown to an assessor as a set and the assessor identified a
passage containing the answer. In some cases, two or more passages were selected. These passages became
the qrels.
While nothing indicates that these assessors made comparisons between passages when selecting answers,
nothing prevented these comparisons, and the interface presented in Figure 1 of Nguyen et al. [24], which
presents passages as a list, does nothing to prevent these comparisons. Moreover, assessors were not required
or encouraged to identify all passages containing the answer, nor does it appear that they were encouraged
to identify the passage containing the best answer. As the authors indicate, “there are likely passages in
the collection that contain the answer to a question but have not been annotated as [such]”. As a result,
the labels for MS MARCO datasets can not be treated as traditional relevance labels, which are assessed
independently, nor are they complete.
Since it does not appear that the assessors were encouraged to identify the best passage, an important
implication for MRR is left unrecognized. Rankers are rewarded for placing qrels as high as possible in
the ranking, but if there are passages that are equally good or better, it becomes possible for a ranker to
outperform the qrels by placing these passages above the qrels. In Section 3, we experimentally test this
possibility.
2.2 Comparative assessment
MS MARCO qrels implicitly identify certain passages as the “best answer” and evaluate experimental runs
on their ability to place these answers as high in the ranking as possible. As the state-of-the-art improves
and better answers are surfaced, we wish to identify these improved answers and replace the qrels with them.
At any point in time, a leaderboard should reflect the ability of rankers to place the best known answer at
the top of the ranking. Apart from some evaluation exercises on named item finding and similar tasks (e.g.,
Metzler et al. [23]) evaluation by the “best known answer” is relatively rare. Navigational queries provide
5 Google’s search quality rating guidelines provide an example of commercial-level rating guidelines: https://static.
googleusercontent.com/media/guidelines.raterhub.com/en//searchqualityevaluatorguidelines.pdf
4a major exception, where returning the desired URL in response to a navigational query remains a core
function of Web search engines [1].
The ongoing identification of the best known answer naturally lends itself to comparative assessment,
rather than the typical pointwise relevance assessment employed by many academic and industry evaluation
efforts, including TREC. Comparative assessment has a long history in information retrieval, although it has
been rarely adopted by any evaluation exercise. In the context of image search, Shao et al. [33] demonstrate
that showing groups of images to assessors can produce judgments that better reflect user satisfaction,
when compared to individual pointwise judgments. This work was continued by Xie et al. [35] who used
side-by-side preference judgments to identify fine-grained differences between images. In other recent work,
Maddalena et al. [22] estimated relevance magnitudes by showing assessors sequences of eight documents, so
that comparisons could be made between them.
Other efforts to employ comparative judgments for relevance assessment have met with mixed success.
Sakai and Zeng [32] crowdsourced side-by-side preference judgments for over 100,000 document pairs for runs
submitted to an NTCIR evaluation task, but could identify no clear advantage for preference judgments over
traditional pointwise judgments. Yang et al. [39] conducted a similar experiment based on the TREC-8 “ad
hoc” test collection, concluding that pairwise preference judgments can be cheap, effective, and as reliable
as traditional pointwise judgments. Extensive work by Carterette and various collaborator also indicated
potential benefits from pairwise preference judgments [5, 42, 3, 4], including improved assessment speed and
accuracy.
An issue frequently raised in this past work, which may be preventing the widespread adoption of pair-
wise preference judgments, is the perceived need for a greater number of judgments. Exactly N pointwise
judgments are required to fully judge a pool of N items, while a quadratic number of judgments might
be required to fully judge the same pool with pairwise preferences. If we assume transitivity of preference
judgments, this number might be reduced to less than N log N judgments. By transitivity, we mean that
if item A is preferred to item B and, item B is preferred to item C, we can assume that item A would be
preferred to item C. However, since judgments are subject to human disagreement and error, transitivity
cannot be assumed. While concerns about the need for large number of judgments may be valid if the goal is
computing NDCG, in this paper our focus is identifying and maintaining a single “best answer”, which can
be based on shallow pools, even just the top document, and can be easily maintained by comparing against
the current best known as new items are surfaced.
Recent work from our research group has focused preference judgments on identifying the top-k results [7].
Starting with deeper pools, that paper proposed a tournament structure to converge on the top-k results,
while minimizing the overall number of preference judgments required In the current paper, we identify a
single best answer, the top-1 result from shallow pools, so that a tournament structure is not required. When
a previously unjudged document is surfaced as the top item in a ranking, it can directly compared with the
previous known best answer to maintain the overall best answer.
Another issue frequently raised in this past work is the lack of validated evaluation measures for preference
judgments. Sakai and Zeng [32] extend and explore a family of measures first defined by Carterette et al.
[5]. These measure reflect the degree to which a ranking agrees with preference judgments. Unfortunately,
Sakai and Zeng [32] could demonstrate no clear benefit from these measures when compared with traditional
pointwise judgments and NDCG. In this paper, since we are treating a qrel as a “best answer”, we can
employ MRR as our evaluation measure. Recent work from our research group has proposed other measures
for preference judgments [8, 21] but for a single best answer, MRR remains appropriate [11].
Table 1 shows the split between the categories for the 6,980 queries in the development set. For the
Category A queries, where the ranker and qrels agree, we would expect this passage to be generally preferred
over other passages. For comparison purposes, we choose the second passage returned by our ranker. Even
though this passage is highly ranked, we would still expect the top passage to be preferred when the two
passages are placed side-by-side. For the Category B queries, we compare the top passage with the qrel.
Altogether we have a pair for each query, which can be compared side-by-side by a human assessor to
determine which represents the better result.
5Number of queries % queries
Category A: qrel at first rank 1868 26.77%
Category B: non-qrel at first rank 5112 73.23%
Total 6980 100.00%
Table 1: Agreement between qrels and top results from our neural ranker. A perfect ranker would always
place the qrel first.
3 Better than perfect
For each query, MS MARCO measures the performance of a ranker according to the rank at which it places
a single known answer, or qrel, or one of small set of them. The higher the better. MRR@10 is then used
to average over a set of queries. As we hypothesize in the previous section, the qrels may not include all
answers, nor even the best answer. In this section, we test this hypothesis.
We compare the top passages returned by a representative neural ranker with the qrels used to evaluate
experimental runs. If the qrels were the best answers, we would expect a preference for qrels over other
passages. Since both the qrels and our subsequent preference judgments depend on error-prone human
assessments, this preference won’t be universal, but we would certainly expect qrels to be preferred the
majority of the time.
3.1 Method
As a representative neural ranker, we employ the ranking stack described by Nogueira et al. [27] as provided
by their github repository. This ranking stack utilizes Anserini as a sparse first-stage retriever, which
is followed by two BERT-based re-rankers, which they call MonoBERT and DuoBERT. The former was
introduced by Nogueira and Cho [25] as a pointwise, second-stage re-ranker. The re-ranked list produced
by Monobert feeds the third-stage DuoBERT pairwise re-ranker to generate the final ranking. Although
this ranking stack is was well over a year old and had sunk to 30th place on the leaderboard at the time
our experiments were conducted in early 2021, it remains representative of the technology underlying the
dramatic improvements of the past few years. We choose this ranking stack for our experiments for no
other reason that we happened to be working with it when we observed the apparent superiority of the top
passages it returned.
For our experiments, we split the queries in the development set as follows:
1. Category A: Queries for which the top passage and the qrel are the same.
2. Category B: Queries for which the top passage and the qrel are different.
While 94% of the queries in the development set have a single qrel, some have up to four. For these queries,
we arbitrarily selected the first qrel in the file as the qrel used for this comparison. Alternatively, for
these queries we could have selected the highest ranked qrel returned by the ranker or conducted multiple
comparisons. Our approach keeps the selection of the qrel independent of the ranker and avoids multiple
comparisons on the same query.
For assessment, we crowdsourced comparisons on the Amazon Mechanical Turk platform. To build tasks
for crowdsourced workers, we grouped comparisons into sets of ten, which were combined with three test
comparisons, which helped to assure quality. These test comparisons were always between a known relevant
passage (i.e., a qrel) and an obviously off-topic and non-relevant passage. Data from workers failing one or
more of these test comparisons was excluded from our experiment and the task was repeated by a different
worker. For each task we randomized the ordering of the pairs, as well as the right-to-left ordering of passages
in the pairs. A full task comprises these thirteen pairs, which are presented one at a time to a worker along
with the associated query. For each pair, the worker was asked to indicate the passage that “best answers
the question.”
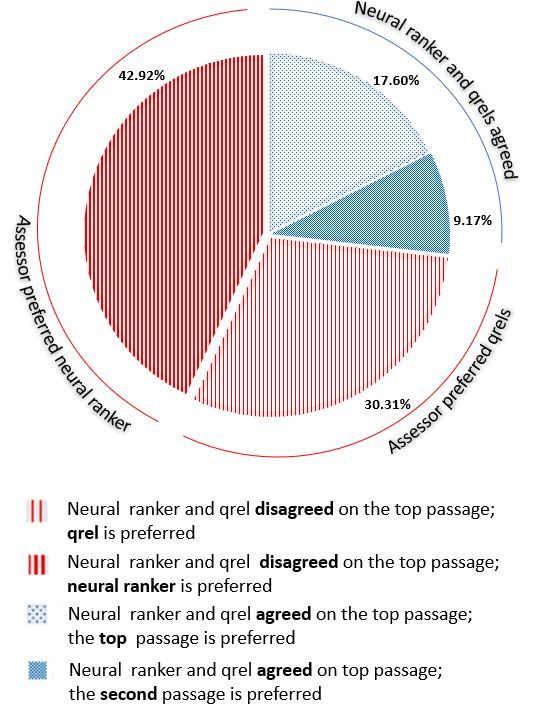
6Figure 1: Results of passage comparison. When the neural ranker and the qrels agree on the top passage,
crowdsourced assessors prefer it over the second passage from the neural ranker nearly 65.7% of the time.
When the neural ranker and the qrels disagree, the crowdsourced assessors prefer the top passage from the
neural ranker over the qrel for 58.6% of the pairs.
7MRR@10
Run Leaderboard Development Set Development Set Development Set
Evaluation Set Reference
Name Rank Original qrels Original qrels Preference qrels
All queries
All Queries Selected Queries Selected Queries
Perfect run 1 1 1 0.3320
A 3 0.4190 0.4205 0.4013 0.5069 not available
B 4 0.4080 0.4213 0.3953 0.5638 Pradeep et al. [29]
C 5 0.4070 0.4210 0.3881 0.5827 Han et al. [13]
D 9 0.4010 0.4118 0.3863 0.5036 not available
E 10 0.4000 0.4074 0.3722 0.4955 not available
F 11 0.3990 0.4079 0.3697 0.5703 Hofstätter et al. [15]
G 12 0.3950 0.4046 0.3658 0.5199 Han et al. [13]
H 13 0.3940 0.3998 0.3606 0.5617 not available
8
I 30 0.3790 0.3904 0.3541 0.5464 Nogueira et al. [27]
J 34 0.3760 0.388 0.3442 0.4985 Liu et al. [20]
K 81 0.3090 0.3181 0.2984 0.3663 Hofstätter et al. [14]
L 86 0.2940 0.3039 0.2779 0.4666 Zhan et al. [41]
M 92 0.2770 0.2901 0.2681 0.3251 Hofstätter et al. [14]
N 93 0.2720 0.2768 0.2550 0.3257 Nogueira and Lin [26]
O 110 0.2180 0.2216 0.1955 0.2403 Nogueira et al. [28]
P 115 0.1860 0.1873 0.1536 0.2033 Yang et al. [37]
Table 2: MS MARCO passage ranking development runs used in our experiments, ordered according to the MS MARCO leaderboard at the
time of writing. These were gathered from a variety of sources, as described in Section 4. The table lists MRR@10 values on several sets of
qrels. The “Selected Queries” are described in Section 4. The “Preference qrels” are described in Section 5.The Mechanical Turk platform allows tasks to be restricted to workers that satisfy specified criteria.
Since the MS MARCO passages and queries are taken from an EN-US environment, we restricted tasks to
workers who were located in the US, with more than ten thousand approved tasks and an approval rate of
at least 97%. In addition, we excluded workers who had previously failed the test comparisons for one our
tasks. For each task containing 13 pairs, we paid $2.00, plus a fee of $0.40 to Amazon. Total cost was $1,720,
include pilot tests, debugging, and other minor costs.
This data labeling process was reviewed and approved by our institutional review board. After accepting
a task, workers were shown a consent form and were required to provide consent before undertaking the
task. Workers were given an option to exit the task at any point. Workers exiting before completing the
task were paid a prorated amount. As required by our review board, the rate of pay for a task was estimated
to provide compensation consistent with our local minimum wage. Assessed pairs (without identifying
information) were approved for release after completion of the experiment.
3.2 Results
Figure 1 shows the results of the crowdsourced passage comparison. For Category A queries, where the
neural ranker returns the qrel as the top passage, the assessors agreed that this passage was preferable to
the passage ranked second by the neural ranker roughly two-thirds of the time (18% vs. 9%). Given that
this second-place passage is itself not unlikely to provide a reasonable response to the query, this outcome
provides some assurance regarding both the crowdsourcing process and the quality of the ranker. If we
assume that the qrel/top passage is in fact the best passage in the collection overall, this result also provides
a rough estimate of crowdsourcing error at 33%.
For the Category B queries, the top passage from the neural ranker was preferred over the qrel for
nearly 59% of the queries (43% vs. 30%). Since the result on the Category A queries provides us with
some confidence in the crowdsourcing process, this result suggests that the neural ranker is out-performing
a hypothetical perfect ranker that always returned the qrel in the top rank. It is in this sense we claim
that current neural rankers may already be “better than perfect” on the MS MARCO leaderboards. In the
following sections we consider the potential impact of this result on our understanding of the the state-of-
the-art.
4 Shallow pooling
In the previous section, we compared the top documents returned by a single neural ranker to the qrels.
When they disagreed, the top passage from the neural ranker was preferred more often. In this section we
extend this comparison to encompass a set of top submissions from the leaderboard. For each query, we
create a pool of candidate best answers by taking the top passage from each submission, plus the qrel. The
passages in each pool are paired and judged by crowdsourced workers. We then directly compare runs in
terms of their top documents.
4.1 Method
We base our experiments on the runs listed in Table 2. Like the previous experiment, this experiment uses
the development set because qrels for evaluation queries are not publicly released. The leaderboard rank
indicates position of a run as is was in early 2021, when the research effort reported in this paper was first
undertaken. The table lists official MRR@10 scores on both the development queries and evaluation queries,
and the table is ordered by MRR@10 on evaluation set. The table also includes a preference MRR@10 using
the qrels created by the process described in Section 5.
Since runs are not provided through the MS MARCO leaderboard, we created or obtained these runs
from a variety of sources. In some cases, as referenced, the runs could be re-generated from code in github
repositories and checked against the leaderboard. In other cases, the runs were provided by to us by the
MS MACRO team for the purposes of this paper. We sincerely thank the MS MACRO team for responding
9Figure 2: Sizes of preference judgment pools for all 6,980 queries in the MS MARCO passage retrieval
development set pooled over all 16 available runs.
Figure 3: Sizes of preference judgment pools for 500 selected queries pooled over 12 selected runs.
10Figure 4: MRR@10 on Evaluation set vs Development set with Official qrels on 500 sampled queries. The
rankings are identical suggesting that results on the 500-query sample can be generalized to the development
set leaderboard.
11Perfect Run A B C D E F G H I J L
Perfect Run 49.3% 60.8% 58.6% 51.4% 49.7% 59.0% 55.8% 58.7% 55.6% 51.8% 51.0%
A 50.7% 55.2% 58.0% 48.4% 45.7% 53.1% 53.8% 55.3% 52.7% 48.6% 45.6%
B 39.2% 44.8% 51.5% 44.9% 44.4% 49.0% 48.1% 52.0% 51.2% 45.1% 41.1%
C 41.4% 42.0% 48.5% 42.4% 42.5% 49.2% 34.5% 51.9% 47.9% 39.8% 40.5%
D 48.6% 51.6% 55.1% 57.6% 46.4% 54.6% 53.1% 55.8% 52.1% 50.6% 46.7%
E 50.3% 54.3% 55.6% 57.5% 53.6% 54.2% 51.5% 54.8% 51.1% 47.6% 48.1%
F 41.0% 46.9% 51.0% 50.8% 45.4% 45.8% 44.3% 55.6% 49.8% 42.5% 42.0%
G 44.2% 46.2% 51.9% 65.5% 46.9% 48.5% 55.7% 56.3% 55.8% 44.1% 43.3%
H 41.3% 44.7% 48.0% 48.1% 44.2% 45.2% 44.4% 43.7% 47.5% 43.8% 42.0%
12
I 44.4% 47.3% 48.8% 52.1% 47.9% 48.9% 50.2% 44.2% 52.5% 44.1% 42.2%
J 48.2% 51.4% 54.9% 60.2% 49.4% 52.4% 57.5% 55.9% 56.3% 55.9% 49.7%
L 49.0% 54.4% 58.9% 59.5% 53.3% 51.9% 58.0% 56.7% 58.0% 57.8% 50.3%
Wins 2 4 8 10 3 2 8 6 11 8 3 1
Table 3: Win ratios when runs are directly compared according to their top documents. Percentages indicate the frequency that the run
in column beat the run in the row. Bolded numbers indicate significant differences under a binomial test with α = 0.05, after a Bonferroni
correction. Under this measure, three runs outperform the “perfect run”. The last row indicates the number of times the run won. Runs are
ordered according to their position on the official leaderboard.positively to our “cold call” and providing those runs on the development set that were easily available to
them. We focused our efforts to recover runs on the top of the leaderboard, and were able to recover four of
the top ten and eight of the top 20. Unfortunately, we were not able to recover the top RocketQA run.
We pooled the top passage from each run, plus the qrel if it did not appear among these top passages.
For this experiment, we continue to use a single qrel per query, as described in the previous section. Figure 2
shows the size of these pools. For 117 queries the pool size is one, i.e., all rankers returned the qrel as the
top document. The average pool size is 6.23 passages, with a median pool size of 6 passages. If we paired
the documents in these pools and judged each pair once, it would require 141,887 comparisons and cost over
$34,000.
Since this experiment is exploratory, rather than a complete evaluation of the runs themselves, we reduced
our costs in two ways. First, we judged a random subset of 500 queries, rather than the full set of queries, as
explained below. Second, we restricted judging to the available runs at the top of the leaderboard, i.e, runs A
to K, which are more likely to surface documents that outperform the qrels. These runs all have an evaluation
MRR@10 between 0.367 and 0.419, while the next-highest run has an MRR@10 of 0.309. In addition, we
included run L, which exhibited an interesting property on the pairs from the previous experiment. For this
run, when both passages in a judged pair appeared in its top-10 ranking, they were ordered consistently with
the preferences more often than any other run, with 63.07% agreement.
We build new pools for this restricted set of runs, and then selected 500 queries at random for which the
pool size was at least two. Figure 3 shows the size of these pools. The average pool size is 6.32 passages, with
a median pool size of 4 passages. Sampling to down to these 500 queries from the development set has no
impact on the leaderboard ranking, as shown in Figure 4. This figure plots the MRR@10 on the evaluation
set, as shown on the leaderboard, against the MRR@10 on the 500 sampled queries from the development
set. The values are shown in Table 2 in columns 3 and 5. The rankings are identical.
Judging each pair once requires 4,210 comparisons. We crowdsourced these comparisons on Mechanical
Turk following the procedure described in the previous section, for an actual cost of $1,022, including pilot
tests, debugging, and other minor costs. Assessed pairs (without identifying information) were approved by
our institutional review board for release after completion of the experiment. However, since these pairs
include passages surfaced by runs provided to us by the MS MARCO team strictly for this experiment, their
general release is not possible.
4.2 Results
Just as we did in Section 3, we directly compare pairs of runs with the preference judgments. For each pair
of runs, we compute a win ratio for the top passages from each run. When the top documents differ, the
win ratios indicates how often one run is preferred over another.
The results are shown in Table 3. Win ratios compare the columns to the rows, so that a value above
50% indicates that the run in column beats the run in row more often that not. Bolded numbers indicate
significant differences under a binomial test with α = 0.05, after a Bonferroni correction. Even under the
conservative Bonferroni correction three runs significantly outperform the hypothetical “perfect run” with
qrels. The last row indicates the number of wins for the run in that column. Run H is particularly interesting
since it wins against all other runs. Unfortunately, we know little about this run, since there is no associated
reference.
5 Leaderboard impact
MS MARCO queries can have as little as one qrel, i.e., only one known relevant item. We hypothesize
that the MS MARCO evaluation methodology, and its associated leaderboards, depend on this item being
the “best item”, rather than just any relevant item. MRR rewards rankers for placing this item as high as
possible in its ranking. Employing MRR as the primary evaluation measure makes the implicit assumption
that placing this item above all other items is always the correct thing to do. The experiments in previous
sections contradict this assumption, demonstrating that some runs on the leaderboard can be considered
13“better than perfect” according to the existing qrels. In this section, we explore the possibility that these
experimental results raise practical concerns, with the potential for impacting leaderboards and our notion
of the state-of-the-art.
In this section, we derive new preference-based qrels from the preference judgments described in the
previous section. Using these preference qrels, we compute new MRR@10 values for the 16 available runs.
We compare the results with MRR@10 values computed using the original qrels.
5.1 Method
We convert preference judgments to qrels by treating the preference judgments as a tournament. If a single
passage wins the most pairings, we designate that passage to be the “preference qrel” for that query. For
queries where multiple passages were tied for first place, we eliminate the losing passages and repeat the
process with the first-place passages, until we have a single “preference qrel”. For 46 of the 500 selected
queries, it was not possible to designate a single “preference qrel” due to a cycle between three passages.
Overall we have 592 qrels in the preference qrel set for the 500 selected queries. The preference qrels win
1598 or 91.8% of their pairings, while the original qrels win 809 or 46.6% of their pairings. For the remainder
of the experimental results in this section, we use all of the original qrels, not just one for each query. For
the 500 selected queries, there are 528 qrels in this original qrel set.
5.2 Results
The results are given in Figure 5. For these results, we use all 16 runs available, including runs K and M-P,
which were not included in the pools for the previous experiment. These runs all placed below the top 80
on the leaderboard at the time our experiments were completed in May 2021.
The first graph in Figure 5 plots MRR@10 with the preference qrels vs. MRR@10 with the original qrels.
Although there is a correlation between the two measures over the plot as a whole, with Kendall’s τ = 0.65,
at the top rungs of the leaderboard, the relative order of the runs changes dramatically. The green dashed
line indicates the MRR@10 of the perfect run on the original qrels, which scores MRR@10 = 0.3320 on the
preference qrels.
The bottom plots order the runs according to the official leaderboard ranks, and show 95% confidence
intervals. On the official qrels (second plot) the runs adhere closely to the leaderboard ranking. On the
preference qrels, there are noticeable changes in the ranking. In particular, run A drops below runs B and
C, while runs D and E drop below F.
Run C is the best performing run on the preference qrels, but third on the original qrels. This run
is described by Han et al. [13] who argue that finetuning a classification model with the aim of deciding
whether a document is relevant to a query or not, is not a suitable approach for a ranking task. Instead,
they employed a learning-to-rank algorithm on a pair-wise and list-wise basis which learns to differentiate
relevance for document pairs or optimize the list as a whole, respectively. Unlike most of BERT-based
methods, this framework builds a LTR model through fine-tuning representation of query-document pairs
and demonstrates the potential of combining ranking losses with BERT representations, especially for passage
ranking. Since this run takes a very different approach than most runs at the top of the leaderboard, we
hope that a promising direction for future progress has not been missed.
On the preference qrels, run L (Zhan et al. [41]) noticeably improves against runs with a similar MRR@10
on the original qrels. As mentioned previously, this run exhibited an interesting property on the pairs from
the previous experiment. When both passages in a judged pair appeared in its top-10 ranking, they were
ordered more consistently with the preferences more frequently than any other run. To check that this
relative improvement was not an artifact of the run’s inclusion in the pool, we re-calculated the preference
qrels without the passages it contributed. While the exact numbers, changed, run L continued to show this
relative improvement.
14Figure 5: Shallow pooling of top documents from available MS MARCO passage retrieval runs followed by
crowdsourced preference judgments to create new qrels for a sample of 500 queries. A perfect run under the
official qrels, with an MRR@10 of 1, performs poorly under these new preference qrels. Changes in the order
of top runs raise concerns about the ability of the official qrels to recognize improvement in the state of the
art. The bottom plots show 95% confidence intervals. Runs are ordered according to the official leaderboard.
156 Concluding Discussion
The MS MARCO leaderboards evaluate submissions with sparse labels indicating relevance (“the qrels”) and
Mean Reciprocal Rank (MRR). Imagine a state-of-the-art ranker that routinely surfaces in its top ranked
items that a person would prefer to these qrels. Perhaps in comparison to the previous state-of-the-art it
also places the qrels higher in the ranking on average, but still below the superior items, so that its MRR is
larger. To recognize further improvements to the state-of-the-art we are depending on this property — that
improved rankers will place qrels higher and higher. But in this thought experiment, if improved rankers
are surfacing more and more items that are superior to the qrels, these items will tend to push the qrels
down, lowing MRR. Our results suggests that this phenomenon, or a similar phenomenon, may already be
occurring on the passage ranking leaderboard.
While this paper may appear critical of the MS MARCO effort, the opposite is true. By enabling
evaluations with larger query sets and sparser labels, MS MARCO represents a major advance in information
retrieval evaluation. With some exceptions, most previous evaluation efforts make an implicit assumption
that the judgment set is sufficiently complete. Measures such as NDCG@k require a gain value for each
ranked item down to depth k. Unjudged items are typically assumed to provide zero gain [31]. As new
retrieval methods surface unjudged items with gain that would equals or exceed that of judged items,
significant improvements can be missed [40]. Avoiding the negative impact of unjudged items requires an
ongoing commitment to judge all newly surfaced items down to depth k.
In contrast, MS MARCO identifies an overall best item, or perhaps several such items, and evaluates
rankers by their ability to place these items as high as possible in their rankings. MRR is the primary
evaluation measure, not NDCG. As unjudged items are surfaced, we can maintain this set of best items
with comparative judgments, instead of traditional pointwise judgments. For example, we might present an
assessor with a list of items and ask which is best. The original development of the MS MARCO collection
essentially followed this approach, although they did not explicitly request the best answer. Alternatively,
we might employ side-by-side preference judgments, as we did in this paper.
Comparative judgments allow for finer distinctions between items than is normally possible with pointwise
judgments, and there is a growing body of research literature recognizing and exploring preference judgments
for this reason [32, 42, 5, 39]. For example, Xie et al. [35] recognize the potential of preference judgments
for image search, where absolute relevance grades are difficult to define and images must be assessed on
intangible factors such as aesthetic appeal [33]. In addition, preference judgments offer improved assessor
agreement and require less time, when compared to pointwise judgments. If the top items returned by
modern neural rankers are all highly relevant in the traditional sense, preference judgments allow us to make
finer distinctions between them by comparing items side by side.
We provide evidence that the performance of modern neural rankers already exceeds a “perfect” result on
the MS MARCO passage ranking leaderboard. Over the 6,980 queries comprising the MS MARCO passage
ranking development set, our crowdsourced workers more often prefer the top passage returned by a neural
ranker to a judged relevant passage. If we imagine a hypothetical perfect ranker that always returned a
judged relevant passage at rank 1, with a perfect MRR@10 of 1, the top passage from the neural ranker
would be preferred more often, making the neural ranker in this sense “better than perfect”. This outcome
has implications for measuring further improvements to the state-of-the-art. To provide some sense of these
implications, we pooled the top passage from available experimental runs for over 500 queries and employed
crowdsourced workers to make pairwise preference judgments between them. Again, we see that the results
of neural rankers can be “better than perfect”. When we construct a new set of qrels from these judgments,
we see shifts in the leaderboard which raise concerns about its ability to continue tracking improvements.
The MS MARCO effort has successfully fostered substantial new research on the core informational
retrieval tasks of “ad hoc” passage and document ranking, allowing researchers to demonstrate unprecedented
improvements in the state-of-the-art [11, 19]. Unfortunately, the lack of an ongoing maintenance plan for
the MS MARCO judgment set may hinder further improvements. As a maintenance plan for MS MARCO
and similar efforts, we suggest regular pooling and judging of top documents to maintain a set of known best
answers for queries. In order to identify best items, comparative judgments allow finer distinctions between
items to be recognized, which might otherwise might be missed with traditional pointwise judgments.
16References
[1] Andrei Broder. A taxonomy of Web search. SIGIR Forum, 36(2):3–10, 2002.
[2] C. J. C. Burges, T. Shaked, E. Renshaw, A. Lazier, M. Deeds, N. Hamilton, and G. Hullender. Learning
to rank using gradient descent. In 22nd International Conference on Machine Learning, pages 89–96,
2005.
[3] Ben Carterette and Paul N. Bennett. Evaluation measures for preference judgments. In 31st Annual
International ACM SIGIR Conference on Research and Development in Information Retrieval, page
685–686, 2008.
[4] Ben Carterette, Paul Bennett, and Olivier Chapelle. A test collection of preference judgments. In SIGIR
2008 Workshop on Beyond Binary Relevance: Preferences, Diversity, and Set-Level Judgments, 2008.
[5] Ben Carterette, Paul N. Bennett, David Maxwell Chickering, and Susan T. Dumais. Here or there: Pref-
erence judgments for relevance. Computer Science Department Faculty Publication Series 46, University
of Massachusetts Amherst, 2008.
[6] Olivier Chapelle and Yi Chang. Yahoo! Learning to Rank Challenge overview. In Proceedings of
Machine Learning Research, volume 14, June 2011.
[7] Charles L. A. Clarke, Alexandra Vtyurina, and Mark D. Smucker. Assessing top-k preferences. ACM
Transactions on Information Systems, 39(3), July 2021.
[8] Charles L.A. Clarke, Alexandra Vtyurina, and Mark D. Smucker. Offline evaluation without gain. In
ACM SIGIR on International Conference on Theory of Information Retrieval, page 185–192, 2020.
[9] Nick Craswell, Bhaskar Mitra, Emine Yilmaz, Daniel Campos, and Ellen M Voorhees. Overview of the
TREC 2019 Deep Learning Track. CoRR, abs/2003.07820, 2020. URL https://arxiv.org/abs/2003.
07820.
[10] Nick Craswell, Bhaskar Mitra, Emine Yilmaz, and Daniel Campos. Overview of the TREC 2020 Deep
Learning Track. CoRR, abs/2102.07662, 2021. URL https://arxiv.org/abs/2102.07662.
[11] Nick Craswell, Bhaskar Mitra, Emine Yilmaz, Daniel Campos, and Jimmy Lin. MS MARCO: Bench-
marking ranking models in the large-data regime. In 44th ACM SIGIR International Conference on
Research and Development in Infomation Retrieval, 2021.
[12] Marco Ferrante, Nicola Ferro, and Norbert Fuhr. Towards meaningful statements in IR evaluation.
mapping evaluation measures to interval scales. CoRR, abs/2101.02668, 2021. URL https://arxiv.
org/abs/2101.02668.
[13] Shuguang Han, Xuanhui Wang, Mike Bendersky, and Marc Najork. Learning-to-rank with BERT in
TF-ranking. CoRR, abs/2004.08476, 2020. URL https://arxiv.org/abs/2004.08476.
[14] Sebastian Hofstätter, Navid Rekabsaz, Carsten Eickhoff, and Allan Hanbury. On the effect of low-
frequency terms on neural-IR models. In Proceedings of the 42nd International ACM SIGIR Conference
on Research and Development in Information Retrieval, pages 1137–1140, 2019.
[15] Sebastian Hofstätter, Sophia Althammer, Michael Schröder, Mete Sertkan, and Allan Hanbury.
Improving efficient neural ranking models with cross-architecture knowledge distillation. CoRR,
abs/2010.02666, 2020. URL https://arxiv.org/abs/2010.02666.
[16] Thorsten Joachims and Filip Radlinski. Search engines that learn from implicit feedback. IEEE Com-
puter, 40(8):34–40, August 2007.
17[17] Omar Khattab and Matei Zaharia. ColBERT: Efficient and effective passage search via contextualized
late interaction over BERT. In 43rd ACM SIGIR International Conference on Research and Develop-
ment in Infomation Retrieval, pages 39–48, 2020.
[18] Jimmy Lin. The neural hype and comparisons against weak baselines. SIGIR Forum, 52(2):40–51, 2018.
[19] Jimmy Lin, Daniel Campos, Nick Craswell, Bhaskar Mitra, and Emine Yilmaz. Significant improvements
over the state of the art? A case study of the MS MARCO document ranking leaderboard. In 44th
ACM SIGIR International Conference on Research and Development in Infomation Retrieval, 2021.
[20] Zhenghao Liu, Kaitao Zhang, Chenyan Xiong, Zhiyuan Liu, and Maosong Sun. OpenMatch: An open
source library for Neu-IR research. CoRR, abs/2102.00166, 2021. URL https://arxiv.org/abs/2102.
00166.
[21] Chengxi Luo, Charles L. A. Clarke, and Mark Smucker. Evaluation measures based on preference
graphs. In 44th International ACM SIGIR Conference on Research and Development in Information
Retrieval, July 2021.
[22] Eddy Maddalena, Stefano Mizzaro, Falk Scholer, and Andrew Turpin. On crowdsourcing relevance
magnitudes for information retrieval evaluation. ACM Transactions on Information Systems, 35(3),
January 2017.
[23] Donald Metzler, Trevor Strohman, and W.Bruce Croft. Indri TREC notebook 2006: Lessons learned
from three Terabyte Tracks. In 15th Text REtrieval Conference, 2006.
[24] Tri Nguyen, Mir Rosenberg, Xia Song, Jianfeng Gao, Saurabh Tiwary, Rangan Majumder, and Li Deng.
MS MARCO: A human generated machine reading comprehension dataset. In CoCo@NIPS, 2016.
[25] Rodrigo Nogueira and Kyunghyun Cho. Passage re-ranking with BERT. CoRR, abs/1901.04085, 2019.
URL http://arxiv.org/abs/1901.04085.
[26] Rodrigo Nogueira and Jimmy Lin. From doc2query to docTTTTTquery. Online preprint, 2019. URL
https://cs.uwaterloo.ca/~jimmylin/publications/Nogueira_Lin_2019_docTTTTTquery-v2.
pdf.
[27] Rodrigo Nogueira, Wei Yang, Kyunghyun Cho, and Jimmy Lin. Multi-stage document ranking with
BERT. CoRR, abs/1910.14424, 2019. URL http://arxiv.org/abs/1910.14424.
[28] Rodrigo Nogueira, Wei Yang, Jimmy Lin, and Kyunghyun Cho. Document expansion by query predic-
tion. CoRR, abs/1904.08375, 2019. URL http://arxiv.org/abs/1904.08375.
[29] Ronak Pradeep, Rodrigo Nogueira, and Jimmy Lin. The Expando-Mono-Duo design pattern for text
ranking with pretrained sequence-to-sequence models. CoRR, abs/2101.05667, 2021. URL https:
//arxiv.org/abs/2101.05667.
[30] Yingqi Qu, Yuchen Ding, Jing Liu, Kai Liu, Ruiyang Ren, Xin Zhao, Daxiang Dong, Hua Wu, and
Haifeng Wang. RocketQA: An optimized training approach to dense passage retrieval for open-domain
question answering. CoRR, abs/2010.08191, 2020. URL https://arxiv.org/abs/2010.08191.
[31] Tetsuya Sakai. Alternatives to bpref. In 30th Annual International ACM SIGIR Conference on Research
and Development in Information Retrieval, page 71–78, 2007.
[32] Tetsuya Sakai and Zhaohao Zeng. Good evaluation measures based on document preferences. In 43rd
ACM SIGIR International Conference on Research and Development in Infomation Retrieval, page
359–368, 2020.
[33] Yunqiu Shao, Yiqun Liu, Fan Zhang, Min Zhang, and Shaoping Ma. On annotation methodologies for
image search evaluation. ACM Transactions on Information Systems, 37(3), March 2019.
18[34] Krysta M. Svore and Christopher J.C. Burges. A machine learning approach for improved BM25
retrieval. In 18th ACM International Conference on Information and Knowledge Management, pages
1811–1814, 2009.
[35] Xiaohui Xie, Jiaxin Mao, Yiqun Liu, Maarten de Rijke, Haitian Chen, Min Zhang, and Shaoping Ma.
Preference-based evaluation metrics for web image search. In 43st Annual International ACM SIGIR
Conference on Research and Development in Information Retrieval, pages 269–378, 2020.
[36] Lee Xiong, Chenyan Xiong, Ye Li, Kwok-Fung Tang, Jialin Liu, Paul Bennett, Junaid Ahmed, and
Arnold Overwijk. Approximate nearest neighbor negative contrastive learning for dense text retrieval.
CoRR, abs/2007.00808, 2020. URL https://arxiv.org/abs/2007.00808.
[37] Peilin Yang, Hui Fang, and Jimmy Lin. Anserini: Enabling the use of Lucene for information retrieval
research. In 40th ACM SIGIR International Conference on Research and Development in Infomation
Retrieval, pages 1253–1256, 2017.
[38] Peilin Yang, Hui Fang, and Jimmy Lin. Anserini: Reproducible ranking baselines using Lucene. Journal
of Data and Information Quality, 10(4):1–20, 2018.
[39] Ziying Yang, Alistair Moffat, and Andrew Turpin. Pairwise crowd judgments: Preference, absolute, and
ratio. In 23rd Australasian Document Computing Symposium, Dunedin, New Zealand, 2018.
[40] Emine Yilmaz, Nick Craswell, Bhaskar Mitra, and Daniel Campos. On the reliability of test collections
for evaluating systems of different types. In 43th ACM SIGIR International Conference on Research
and Development in Infomation Retrieval, page 2101–2104, 2020.
[41] Jingtao Zhan, Jiaxin Mao, Yiqun Liu, Min Zhang, and Shaoping Ma. RepBERT: Contextualized text
embeddings for first-stage retrieval. CoRR, abs/2006.15498, 2020. URL https://arxiv.org/abs/
2006.15498.
[42] Dongqing Zhu and Ben Carterette. An analysis of assessor behavior in crowdsourced preference judg-
ments. In SIGIR 2010 Workshop on Crowdsourcing for Search Evaluation, 2010.
19You can also read