Interim Results Presentation - Petra Diamonds
←
→
Page content transcription
If your browser does not render page correctly, please read the page content below
Interim Results Presentation
          Petra Diamonds Limited
             17 February 2020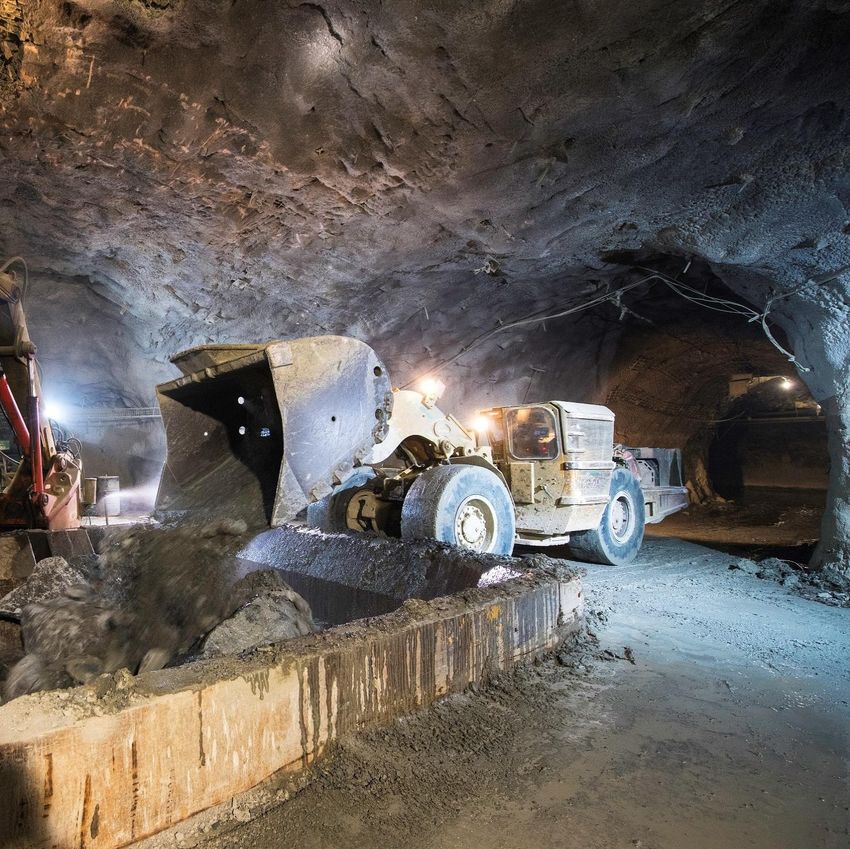
Important Notice

These Presentation Materials are being supplied to you by Petra Diamonds Limited (the “Company”) solely for your information and use at this presentation.

These Presentation Materials may contain information that is confidential, legally privileged or otherwise protected by law. These Presentation Materials may
not be reproduced in any form, redistributed or passed on, directly or indirectly, to any person or published, in whole or in part, by any medium or for any
purpose. Failure to comply with this restriction may constitute a violation of applicable securities law.

These Presentation Materials are exclusively for the purposes of raising awareness about the Company. These Presentation Materials are not intended to
solicit the dealing in securities or securities financing nor do they form part of any invitation, offer for sale or subscription or any solicitation for any offer to
buy or subscribe for any securities in the Company (“Company Securities”) nor shall they or any part of them form the basis of, or be relied upon in
connection therewith or act as any inducement to enter into, any contract or commitment with respect to Company Securities.

These Presentation Materials must not be used or relied upon for the purpose of making any investment decision or engaging in an investment activity.
Accordingly, neither the Company nor any of its subsidiary undertakings (as defined in the Bermuda Companies Act 2006) (together, the “Group”), nor any of
their respective directors, employees, agents or advisors makes any representation or warranty in respect of the contents of the Presentation Materials or
otherwise in relation to the Group or any of its businesses.

The information contained in the Presentation Materials is subject to amendment, revision and updating, and such information may change materially. No
person is under any obligation to update, or keep current, the information contained in these Presentation Materials, and any opinions expressed in relation
thereto are subject to change without notice. The Presentation Materials contain forward-looking statements which involve risk and uncertainties and actual
results and developments may differ materially from those expressed or implied by these statements depending on a variety of factors. The Presentation
Materials have not been independently verified and no representation or warranty, express or implied, is made as to the fairness, accuracy or completeness
of the information or opinions contained herein. The forward-looking information contained in these Presentation Materials is expressly qualified by this
cautionary statement.

The delivery of these Presentation Materials shall not at any time or in any circumstance create any implication that there has been no adverse change, or
any event reasonably likely to involve any adverse change, in the condition (financial or otherwise) of the Company or any other member of the Group since
the date of these Presentation Materials.

Any securities mentioned herein have not been and will not be registered under the United States Securities Act of 1933, as amended (the “Securities Act”) or
under the securities laws of any state or other jurisdiction of the United States and may not be offered, sold, resold or delivered, directly or indirectly, in or into
the United States absent registration except pursuant to an exemption from, or in a transaction not subject to, the registration requirements of the Securities
Act and applicable states securities laws. The distribution of these Presentation Materials in other jurisdictions may also be restricted by law, and persons
into whose possession these materials come should inform themselves about, and observe, any such restrictions. No public offering of securities is being
made in the United States or any other jurisdiction.

By attending this presentation or by accepting a copy of the Presentation Materials, you agree to be bound by the foregoing limitations and conditions.

                                                                                                                                                                          2
CEO
Overview
Relentless Focus on Zero Harm

Improving trend in safety performance over +10 year period
•              Safety is our most important personal and organisational value

•              From FY 2009 to H1 FY 2020: LTIFR -65% and LTIs -82%
    MILLION MANHOURS WORKED / NUMBER OF ACCIDENTS

                                                                                             81
                                                       81.0                                                                                                                      1.4
                                                       71.0                                                                                                                      1.2
                                                       61.0                                           54
                                                                                                                                                                                 1.0
                                                       51.0       45       45       44
                                                       41.0                                                                               35                                     0.8
                                                                                                                                 32
                                                       31.0                                                    27       27                         25                            0.6
                                                       21.0                                                                                                 16
                                                                                                                                                                        8        0.4
                                                       11.0
                                                                                                                                                                                 0.2
                                                           1.0
                                                       - 9.0                                                                                                                     0.0
                                                                 2009FY   2010FY   2011FY   2012FY   2013FY   2014FY   2015FY   2016FY   2017FY   2018FY   2019FY   H1 - FY`20
                                                    Manhours      14.6     12.7     13.1     12.9     16.2     16.8     18.6     21.9     25.5     21.8     15.1       7.2
                                                    LTIs          45       45       44       81       54       27       27       32       35       25       16          8
                                                    LTIFR         0.62     0.71     0.67     1.26     0.67     0.32     0.29     0.29     0.27     0.23     0.21      0.22

The Lost Time Injury Frequency Rate expressed per 200,000 hours worked

                                                                                                                                                                                       4
H1 FY 2020 KPIs

Delivery of solid operational results in challenging market

  PRODUCTION                             REVENUE                                  CAPEX¹
  Million carats                         US$ million                              US$ million

  2.07 +3%                               193.9             -6%                    25.6                 -35%

                                               463.6
         3.87                                                                               81.4
                                               256.5
        1.85                                                                                42.1

         2.02              2.07                207.1               193.9                    39.3
                                                                                                                      25.6

       FY 2019          H1 FY 2020            FY 2019            H1 FY 2020               FY 2019                 H1 FY 2020

 • All mines ran ahead of plan in H1   • Revenue impacted by lower               • Significant reduction of Capex as
 • H2 production has had a slower        diamond prices due to weaker              major capital expansion
   start and production will be          market (-10%), adverse product mix        programmes have been materially
   weighted towards Q4                   at Finsch and Williamson (-3%),           completed
                                         offset by the sale of the exceptional   • Capex for FY 2020 weighted to H1
 • Further load shedding in South        20.08ct blue diamond from the
   Africa also remains a risk            Cullinan mine (+7%) for $14.9            1   Capex is Operational Capex, excluding
                                         million                                      capitalised borrowing costs

                                                                                                                               5
H1 FY 2020 saw the highest ROM tonnes and carats in Petra’s history

Strong operational performance supported by Project 2022 across all sites
                                              ROM tonnes treated
 8000 000

 7000 000

 6000 000

 5000 000
                                                                       Q4         Q2
 4000 000                           Q4                   Q2
                 Q2
 3000 000
                                                                       Q3         Q1
 2000 000                           Q3                   Q1
                 Q1
 1000 000

       -
               H1 2018             H2 2018             H1 2019        H2 2019   H1 2020

                                             ROM carats recovered
 2500 000

 2000 000

 1500 000
                                    Q4                   Q2                       Q2
                 Q2                                                    Q4
 1000 000

                                    Q3                   Q1                       Q1
  500 000        Q1                                                    Q3

       -
               H1 2018             H2 2018             H1 2019        H2 2019   H1 2020

                                                                                          6
H1 FY 2020 KPIs

Profitability impacted by weaker diamond prices

    ADJUSTED EBITDA¹                                   OPERATIONAL FREE CASH FLOW
    US$ million                                        US$ million
                                                                                          ADJUSTED NET LOSS AFTER TAX¹

    67.2               -11%                            13.7           -26%
                                                                                          US$ million

                                                                                          11.1          H1 FY 2019: (4.5)
                                                              70.5
           153.0

           77.4                                               52.0

                                                                                          NET LOSS AFTER TAX
            75.6                      67.2                                                US$ million
                                                              18.5             13.7

         FY 2019                  H1 FY 2020                FY 2019          H1 FY 2020   10.0          H1 FY 2019: (57.9)

• Lower EBITDA driven by diamond                      • Generation of positive Op FCF
  prices                                                despite weak pricing
• Adjusted EBITDA margin of 35%                         environment reflects positive
  (H1 FY 2019: 36%)                                     impact of Project 2022            BASIC LOSS PER SHARE
                                                        initiatives to optimise           US$ cents
                                                        production and control costs
                                                                                          1.01
1   Refer to interim results announcement dated 17
    February 2020 for detailed notes regarding non-                                                     H1 FY 2019: (6.57)
    IFRS adjusted disclosures

                                                                                                                             7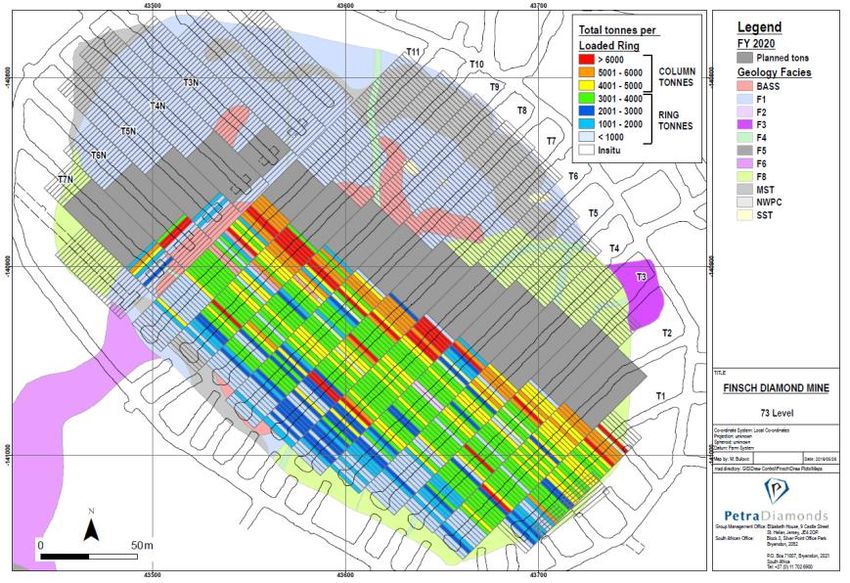
Responsible Mining in H1 FY 2020 – Playing a Positive Role within our Communities

                                                                                                            Petra constructed the Lethabong Day Centre within
Cullinan celebrated the accomplishments of the top       Launch of the artisanal mining initiative at       the Onverwacht school grounds, with 3 classrooms
achievers at the 2020 Matric Awards Gauteng North       Koffiefontein, allowing for legal and properly        and facilities for both the staff and the children.
   District, including two scholarship pupils who    regulated artisanal mining to take place on certain      This centre allows pupils who were often absent
           walked away with top honours               tailings mineral resources, for the benefit of the       caring for siblings to attend school while their
                                                                      local community                                     siblings attend the Centre

                                                                                                              Spreading Christmas cheer by distributing gift
    Petra’s Women in Leadership programme to           Petra supported the ‘16 Days of Activism for No
                                                                                                             packs to children in Refilwe, local to the Cullinan
empower female leaders in the workplace is now in     Violence against Women and Children’ campaign,
                                                                                                                                   mine
its second year, with a number of WIL participants   with Finsch employees taking part in a walk to raise
     attending a 3 day workshop in Kimberley              awareness around gender-based violence

                                                                                                                                                               8
Diamond Market
Overview

Global Production

Only 30 significant kimberlite mines in production today

                                                           10
Favourable Long-term Market Fundamentals
The supply side outlook continues to contract
• Rough diamond production fell 2% to 148.4 Mcts in 2018 with a value of $14.5bn (2017: $14.1bn)
• Argyle mine to close in 2020; produced around 10% of world supply by volume in 2018 and only major source of pink diamonds
globally
• World supply projected to fall to 115 Mcts by 2030
Mcts
Global rough diamond production (Mcts)
180
160
140
120
100
80
60
40
20
0
2011A
2007A
2008A
2009A
2010A
2012A
2013A
2014A
2015A
2016A
2017A
2018A
2019E
2020E
2021E
2022E
2023E
2024E
2025E
2026E
2027E
2028E
2029E
2030E
Source: Company reports, Kimberley Process and Petra Diamonds
11Rough Diamond Prices
Short term headwinds affecting pricing
Rough diamond market performance H1 FY 2020 FY 2019 H1 FY 2019
Rough Diamond Prices US$/ct US$/ct US$/ct
• The first tender in H1 FY 2020 saw like-for-like prices down
ca. 4% over Q4 FY 2019, with October seeing some Cullinan1 112 110 96
stabilisation and a modest improvement in the December Finsch 79 99 105
2019 tender – result was prices were ca. -3% in H1 FY 2020
Koffiefontein 431 480 447
• First tender of H2 FY 2020 in February indicates that prices
increased marginally on a like-for-like basis in comparison to Williamson 184 231 223
H1 FY 2020
Group average 111 124 119
Includes
1. 1Includes revenue fromstones
Exceptional Diamonds
and H1 FYin2020
H1 FY 2020 and H2 FY 2019
• Optimism towards improved market conditions has been revenue from special in H2 FY 2019
eroded by outbreak of coronavirus in China – negative impact
on consumer spending around Chinese New Year and Bloomberg Rough Diamond Index
reduced impact across the full diamond pipeline 210
205 2019: -14%
• Continued supply discipline by the leading diamond mining 200
YTD 2020: +3%
195
companies will remain a key factor in the health of the rough 190
market in 2020 185
180
Petra sales calendar 175
H1 H2
170
165
160
Jul Aug Sep Oct Nov Dec Jan Feb Mar Apr May Jun
155
1 2 3 4 5 6 7
12Financial Results
H1 FY 2020 Summary of Results

                                                                                                             H1 FY 2020       H1 FY 2019        FY 2019
                                                                                                                (US$m)           (US$m)         (US$m)
Revenue                                                                                                             193.9           207.1         463.6
Adjusted mining and processing costs1                                                                              (123.6)         (127.2)       (301.7)
Other direct income / (expense)                                                                                         0.3            0.2          (0.8)
Profit from mining activity1                                                                                          70.6            80.1        161.1
Exploration expense                                                                                                   (0.2)           (0.2)          (0.4)
Corporate overhead                                                                                                    (3.2)           (4.3)          (7.7)
Adjusted EBITDA1                                                                                                      67.2            75.6        153.0
Depreciation                                                                                                        (47.0)          (50.8)       (106.7)
Share-based expense                                                                                                   (0.4)           (0.1)          (0.2)
Net finance expense                                                                                                 (34.1)          (31.7)         (57.5)
Tax credit (expense) (excluding taxation credit on impairment charge)                                                   3.2             2.5          (1.8)
Adjusted net loss after tax1                                                                                        (11.1)           (4.5)        (13.2)
Impairment charge – operations¹                                                                                          —               —       (223.7)
Impairment charge – other receivables¹                                                                               (1.6)               —         (22.9)
Net unrealised foreign exchange gain / (loss)                                                                          2.7          (13.7)             4.0
Taxation credit on impairment charge                                                                                     —              —           47.6
Loss from continuing operations                                                                                      (10.0)          (18.2)      (208.2)
Loss on discontinued operations, net of tax¹                                                                              —          (39.7)        (49.9)
Net loss after tax                                                                                                  (10.0)          (57.9)       (258.1)
Earnings per share attributable to equity holders of the Company:
    Basic loss per share from continuing and discontinued operations – US$ cents                                    (1.01)          (6.57)       (26.19)
    Basic loss per share from continuing operations – US$ cents                                                     (1.01)          (1.74)       (20.18)
    Adjusted loss per share from continuing operations – US$ cents¹                                                 (1.17)          (0.16)        (2.63)

 1   Refer to interim results announcement dated 17 February 2020 for detailed notes and explanations regarding non-IFRS adjusted disclosures

                                                                                                                                                             14
Balance Sheet Snapshot
• Bank facilities of R1.5 billion undrawn and available (FX movement causes USD value to fluctuate)
• South African Lender Group consented to a waiver of the EBITDA related covenant ratios associated with Petra’s banking
facilities for the December 2019 measurement period
Unit 31 Dec 2019 30 Sep 2019 30 Jun 2019
Closing exchange rate used for conversion R13.99:US$1 R15.16:US$1 R14.07:US$1
Cash at bank (incl. restricted amounts) US$m 53.6 57.2 85.2
Diamond inventories US$m 85.2 92.4 57.5
Carats 992,425 1,145,274 666,201
Diamond debtors US$m 12.8 7.2 23.8
US$650 million loan notes (issued April 2017) US$m 650.0 650.0 650.0
Bank loans and borrowings US$m — — —
Net debt US$m 596.4 592.8 564.8
Bank facilities undrawn and available US$m 107.2 98.9 106.6
Consolidated net debt for covenant measurement US$m 632.9 637.7 595.2
purposes1
1 Consolidated Net Debt for covenant measurement purposes is bank loans and borrowings plus loan notes, less cash, less diamond debtors and
includes the BEE guarantees of ca. US$49.3 million (ZAR689.5 million) as at 31 December 2019 (ca. US$52.1 million (ZAR790.4 million) as at 30 15
September 2019)Net Debt Movement in H1 FY 2020
Operational FCF
US$13.7 million
$600
$550
US$ million
$500
$450
$400
$564.8 $2.9 $67.3 $23.7 $3.1 $26.8 $24.4 $11.3 $3.4 $2.8 $0.6 $0.1 $596.4
Opening Net FX Operating H1 Receivables Capex Net Finance BEE Realised FX Lease Tax KEM Net Debt
Debt restatement CF pre Inventory & Payables expenses advances losses payments payments recoupment closing
of b/f Working build-up balance
balance Capital
Increase in Net Debt Decrease in Net Debt
16Operating Costs
Costs in line with expectations
H1 FY 2020 On-mine cash cost breakdown Focus on costs
(South Africa operations) • Absolute on-mine cash costs in H1 FY 2020 largely flat
vs. H1 FY 2019 despite ongoing inflationary pressures,
8% Labour due to:
Contractors and consumables – inflationary increases, including the impact of
16%
electricity and labour costs ( ca.5% increase)
44% Power
offset by:
Other – the effect of translating ZAR denominated costs at
SA operations at a weaker ZAR/USD exchange rate
(ca. 4% decrease)
32%
– Reduction in the treatment of Finsch overburden
dumps lowering operating costs (ca. 1% decrease)
On-mine Diamond inventory Group technical, Adjusted Total mining and
cash Diamond and stockpile support and mining and processing costs
All in US$m costs1 Royalties movement marketing costs2 processing costs Depreciation3 (IFRS)
H1 FY 2020 135.1 4.8 (25.6) 9.3 123.6 46.7 170.2
H1 FY 2019 135.5 7.3 (27.1) 11.4 127.2 50.4 177.7
FY 2019 266.9 13.2 (2.9) 24.5 301.7 105.9 407.6
1 Includes all direct cash operating expenditure at operational level , i.e. labour, contractors, consumables, utilities and on-mine overheads
2 Certain technical, support and marketing activities are conducted on a centralised basis
3 Excludes exploration and corporate / administration
17Impact of ZAR/USD Movement on Petra
• US$1:ZAR14.86 on 11 February 2020 70 – 80% of operating costs are ZAR
denominated
• Increase / decrease of ZAR1 equates to:
USD
– ca. $15 – 18 million on EBITDA
USD
– ca. $25 million on operational FCF 70-80%
• Short term hedging strategy to manage volatility
• Collar style hedge on USD revenue converted to ZAR covering up to ZAR
50% of next 12 months’ sales
ZAR
USD:ZAR exchange rate – 1 July 2017 to 11 February 2020
16 60 – 80% of Capex is ZAR denominated
15
USD
14
USD
13
60-80%
12
11 ZAR
10
Jul 2017
Nov 2017
Mar 2018
Jul 2018
Nov 2018
Mar 2019
Jul 2019
Nov 2019
Sep 2017
Jan 2018
May 2018
Sep 2018
Jan 2019
May 2019
Sep 2019
Jan 2020
ZAR
18Operations Update
Transitioning to Steady State Operations

Completion of heavy capital intensive phase

                           10 year capital investment programme and 3 year outlook
US$
    350

    300

    250

    200

    150

    100

    50

     0
           2010

                   2011

                           2012

                                    2013

                                            2014

                                                     2015

                                                             2016

                                                                     2017

                                                                              2018

                                                                                      2019

                                                                                              2020

                                                                                                       2021

                                                                                                               2022
•     Petra has completed major capital expansion programmes across each of its assets and is now bedding down steady
      state production

                                                                                                                        20
Mine Contribution Split
Cullinan became key revenue contributor to Group in H1 FY 2020
Production by mine Revenue by mine
2% 11%
20%
32%
H1 FY 2020 H1 FY 2020¹
44% 2.1 million carats $193.9 million
8%
43%
Finsch
42%
Cullinan
Koffiefontein
Williamson
2% 10%
20%
FY 2019 FY 2019 37%
45%
3.9 million carats $463.6 million 6%
43%
37%
1. Petra sales are weighted to H2 due to holding 4 tenders vs 3 tenders in H1
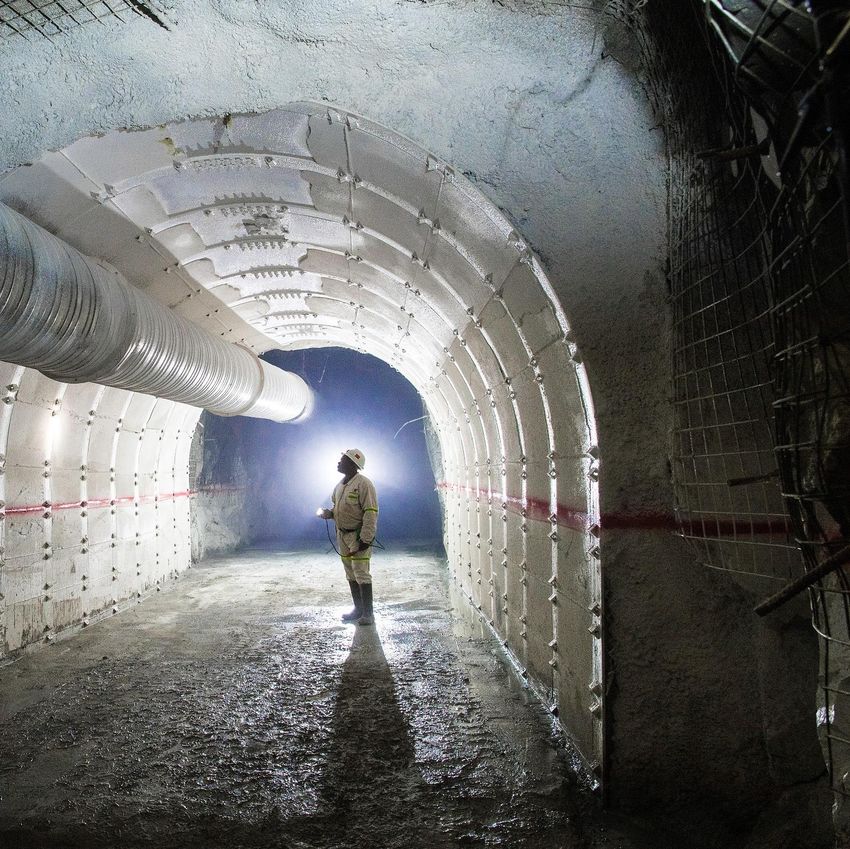
21Cullinan
Steady state production from C-Cut Phase 1 and CC1E to be reached in FY 2020
• Undercut ring blasting commenced – FY
2015
• Production levels established at 839m and
shaft to 934m commissioned – FY 2016
• New plant with throughput capacity of 4.0
Mt ROM and 2.0 Mt tailings –
commissioned Q1 FY 2018
• Ground handling complete with third
crusher commissioned – Q2 FY 2019
• C-Cut and CC1 East Ramp up
– FY 2017 – 1.2 Mt
– FY 2018 – 2.5 Mt
– FY 2019 – 3.6 Mt
– FY 2020 – 4.1 Mt EST
– H1 FY 2020 – 2.3 Mt
– H1 FY 2020 ROM grade of 37.3
cpht marginally lower than
guidance of 38 – 42 cpht
22Cullinan – C-Cut Progression
C-Cut
CC1E
16 ha at 839 mL
The last 3 draw-bells of
107 were slotted in
December 2019
• Draw-bell installation completed at the end of
January 2020, with a total of 107 draw-bells
• Cave maturity will follow the draw-bell opening
sequence with draw-bells requiring roughly 12
months to reach maturity
• Production across the full footprint is expected to
provide reduced grade and value volatility, although
some variability may still be observed
23Finsch
Steady state production from Block 5 SLC to be reached in H2 FY 2020
• Block 5 SLC production commenced
from first tunnels on 70L – FY 2016
• Production on 75L commenced in
Q3 FY 2018; all tunnels in production
- Q3 FY 2019
• Construction of ground handling
infrastructure completed – Q1 FY 2019
• Block 5 SLC ramp up:
– FY 2017 – 0.8 Mt
– FY 2018 – 1.7 Mt
– FY 2019 – 2.5 Mt
– FY 2020 – 2.9 Mt EST
– H1 FY 2020 – 1.5 Mt
– H1 FY 2020 ROM grade of 57.4
cpht in line with guidance of 54
– 57 cpht
24Finsch – Block 5 SLC Progression
70 Level 73 Level
70 Level
75 Level 78 Level
73 Level
75 Level
78 Level
25Koffiefontein
Steady state production from SLC was reached in FY 2019
• Production commenced from
56 Level SLC – FY 2015
• Ground handling system
commissioned – Q3 FY 2018
• Production from 60L commenced
– Q2 FY 2019
• SLC Production Ramp Up
– FY 2017 – 0.6 Mt
– FY 2018 – 0.7 Mt
– FY 2019 – 1.0 Mt
– FY 2020 – 1.0 Mt EST
– H1 FY 2020 – 0.56 Mt
– H1 FY 2020 ROM grade of 7.9
cpht marginally below
guidance of 8.0 – 8.5 cpht
26Williamson
Steady state production achieved in FY 2018
MUDSTONE
• New mill plant commissioned – H2 FY 2017
GB2
• FY 2019 – best production results since 1977
SIL_GB
– FY 2019 – 5.0 Mt ROM / 0.4 Mt alluvial NF_RVK
RVK
– FY 2020 – 5.0 Mt ROM EST BVK
– H1 FY 2020 – 2.6 Mt ROM
BVK
– H1 FY 2020 ROM grade of 8.1 cpht ahead of guidance
of 6.5 – 7.0 cpht
GB BOUMA
SHALE
• 21 Jan 2020: Pit slump of ca. 1.3 Mt on SW sector of pit
O_RVK
– No people harmed in the incident NCL_RVK
– No material impact on FY 2020 expected due to mine SIL_GB RVK
running ahead of plan
• Discussions ongoing with Government of Tanzania in relation RVK
to the overdue VAT receivables and the blocked parcel Inpit Failure GB
Area
GB2
500m
27Project
2022
Petra Diamonds Limited: FY 2019 Prelims Presentation 28Generation of Free Cash Flow to reduce Leverage
Project 2022 to maximise cash flow against a challenging diamond market
• Project 2022 remains on track to deliver significant cash flow generation, reaching an annualised rate of US$50 – 80
million
• However, the operational cash flow benefits are being eroded by the weaker diamond market, coupled with the impact of
adverse product mix, leading to a delay in delivery of the cumulative cash flow target of US$150 – 200 million; target of
US$100 – 150 million expected by June 2022
• Implementation underway at all mines and at Group level; the majority of the value driver ideas generated are expected to
move into full implementation, with cash flow benefits materially contributing from FY 2021
• Throughput comprises the major project component and key notable early successes include record half yearly ROM
production of 7.0 Mt treated and 2.07 Mcts recovered
Throughput at Cost Strategic Other
all operations efficiencies sourcing
(ca. 75%) (ca. 10%) (ca. 5%) (ca. 10%)
1 Cashflow target based on the following assumptions:
• Flat prices over the three year period (with reference to pricing achieved in Q2 FY 2020, excluding exceptional stones sold for US$5 million or greater)
• Exchange rate of ZAR14.35:US$1 from the period FY 2020 to FY 2022
² Delivery is weighted towards FY 2021 and FY 2022 and is dependent on diamond pricing
29Project 2022 – Updated Projections
Net cash flow evolution to achieve annualised cash flow generation of
US$50 – 80 million
200
150
US$ million
100
50
0
FY 2020 FY 2021 FY 2022 3 Year FY 2020 FY 2021 FY 2022 3 Year
Target Stretch
Target Stretch
Base Throughput Costs Eff. Sourcing Other
30Project 2022 in Action at Cullinan
Project 2022 Initiatives Delivering at Cullinan aim at increasing production
The ore is milled
Simplified Cullinan process flow diagram 5 to liberate the
diamonds 6 Rough
diamonds are
separated out
from the ore
1 4
Draw point from the
The ore is then
block cave
hoisted to the
surface
3 Crushed ore is
then transported
to the hoist on
2 Loaders move the conveyors
ore to underground
crushers
31Project 2022 in Action at Cullinan
Improvements are mainly focused on addressing the bottlenecks on site
The ore is milled
to liberate the
Simplified Cullinan process flow diagram 5 diamonds 6 Rough
diamonds are
separated out
from the ore
1 4
Draw point from the
The ore is then
block cave
hoisted to the
surface
3 Crushed ore is
then transported
to the hoist on
2 Loaders move the conveyors
ore to underground
crushers
32Project 2022 in Action at Cullinan
Specific ideas within mining are being implemented
Area Idea
Shrink shift change: Increase the number of productive hours on the
Loading loaders by changing the blasting time and ensuring that shift
handovers happen efficiently
Weekend loading: Appoint a contractor to load over the weekends,
Loading thereby increasing the number of utilised days per year and reducing
overtime costs on the mine
Start your engine: Improve LHD Cycle time by reducing delays from
Loading refueling, operational delays (e.g. large boulders) and unplanned
maintenance.
Wind, don't stop: Implement a new shaft shift structure to increase the
Hoisting winders operating time and reduce the amount of time that the
loaders have to stop loading due to full underground silos
33Project 2022 in Action at Cullinan
The mining ideas are complemented by a set of ideas in the plant
Area Idea
Optimisation and redesign of high-pressure grinding roll crushers:
Recycle Refurbish and redesign the rolls so that they crush recycled material
crushing more effectively and reduce the recycle load of the milling circuit. This
will allow a higher proportion of ROM ore to be fed into the mills
Develop best practice for operation of the mills: Improve automated
control and standardise operating procedures, so that the operating
Milling
performance of the mills is more consistent, allowing a higher overall
feed rate
Accelerate processing of red tailings: Increase the amount of historical
Tailings ore
high value red tailings treated to fill plant capacity
34Project 2022 in Action
P22 is working to change the behaviours of all employees across site
35Outlook
Outlook

•   Production on track to meet guidance of ca. 3.8 Mcts
     •    Despite tracking to exceed guidance in H1, Petra has had a slower start to the calendar year, particularly at Cullinan
          and on the back of the recent pit slump at Williamson
     •    H2 production is therefore weighted towards Q4
     •    The extent of further load shedding in South Africa and its resultant impact on production remains a risk
•   The market remains challenging
     •    Optimism at the start of the calendar year has been eroded by the outbreak of the coronavirus and the corresponding
          weakening of sentiment and reduction in activity across the pipeline
•   Focus on Project 2022 in order to optimise production and maximise cash flow
     •    Project 2022 remains on track to deliver significant cash flow generation, reaching an annualised rate of US$50 – 80
          million
     •    Cumulative cash flow generation target expected to be delayed, resulting in the US$150 – 200 million being revised to
          US$100 – 150 million by June 2022, further to weak market and adverse product mix
     •    The delivery of Project 2022 benefits are expected to materially contribute from FY 2021 and therefore the Company
          does not expect a significant change in net debt in FY 2020
•   Proactive cash management and preservation in light of challenging pricing environment
     •    Petra will continue closely monitoring and managing its liquidity risk, maintaining tight control over costs and
          overheads
     •    Discussions will continue with the South African banking facilities Lender Group regarding further covenant resets
          and/or waivers, which are likely to be required for the June and December 2020 measurement periods
     •    Petra continues to assess its strategic options in relation to the maturity of its US$650 million loan notes in May 2022
                                                                                                                               37
Appendix
Capital Structure

Share Price (1 year to 11 February 2020)

                                                          Major Shareholders as at 11 February 2020     % Voting rights

                                                          Standard Life Aberdeen plc                           15.2%

                                                          M&G Plc                                              10.2%

                                                          Cobas Asset Management                                 5.0%

                                                          Lazard Asset Management                                4.9%

                                                          Directors                                              2.0%

Listing                                        LSE: PDL   Petra Diamonds Corporate Bond

Average daily trading volume across all                   Issue date:                                      May 2017
platforms (shares) – (LTM)                       7.7m
                                                          Issue size:                                 US$650 million
Shares in issue                                865.4m
                                                          Coupon:                                              7.25%
Free float                                       94.7%

Market cap @ 8.5p (11 February 2020)       £74m / $96m    Maturity:                                        May 2022

                                                                                                                    39
Board of Directors
Adonis Pouroulis Richard Duffy Jacques Breytenbach Tony Lowrie Dr Patrick Bartlett
Non-Executive Chairman Chief Executive Finance Director Senior Independent Independent Non-Executive
Appointed April 2019 Non-Executive Director Director
Nomination Committee
Audit & Risk Committee
Executive Committee Executive Committee Audit & Risk Committee Nomination Committee
HSE Committee Nomination Committee Remuneration Committee
SED Committee Remuneration Committee HSE Committee
Peter Hill Gordon Hamilton Octavia Matloa Varda Shine Bernard Pryor
Independent Non-Executive Independent Non-Executive Independent Non-Executive Independent Non-Executive Independent Non-Executive
Director and Chairman- Director Director Director Director
Designate Appointed January 2019 Appointed January 2019
Appointed January 2020
Audit & Risk Committee Audit & Risk Committee Remuneration Committee HSE Committee
Peter will assume the role of Nomination Committee SED Committee SED Committee Audit & Risk Committee
Chairman from 31 March Remuneration Committee
2020
40Our Assets
The heritage of our assets imbues our diamonds with unique character
Koffiefontein Cullinan Williamson Finsch
74% Petra; 26% BEE 74% Petra; 26% BEE 75% Petra; 25% Gov of Tanzania 74% Petra; 26% BEE
Sub-level cave Block cave / Sub-level cave Open Pit Sub-level cave / Block cave
Mine Plan to 2025 Mine Plan to 2030 Mine Plan to 2033 Mine Plan to 2030
• Achieving steady state production as Petra nears the end of heavy capital investment phase
• Petra’s mines produce the full spectrum of diamonds from small stones to the very large, highest quality gemstones
across the colour range, from Type II white to yellow, champagne, pink and blue
41A Unique Portfolio
Consistent producers of world-class diamonds with exceptional heritage
The Star of Josephine The Cullinan Heritage 25.5ct blue diamond The Blue Moon of Josephine
26.6ct rough, 7.0ct polished 507.5ct rough, 104ct polished sold for $16.9m ($663k/ct) 29.6ct rough, 12.0ct polished
sold for $9.5m ($1.35m/ct) sold for $35.3m Cullinan, 2013 Rough sold for $25.5m
Cullinan, 2009 Cullinan, 2009 ($862k/ct) and polished sold for
$48.5m (+$4m/ct = world record)
Cullinan, 2014
The Cullinan Dream 32.3ct pink diamond The Legacy of the Cullinan 20.0ct blue diamond
122.5ct rough, 24.1ct polished sold for $15.0m ($463k/ct) Diamond Mine sold for $14.9m ($741k/ct)
Rough sold for $27.6m Williamson, 2016 424.8ct rough sold for $15.0m Cullinan, 2019
Cullinan, 2014 Cullinan, 2019
42Our Heritage
The heritage of our assets imbues our diamonds with character
• Petra’s mines have a long and envied history in the
market and are a continued source of some of the
world’s most celebrated gems
• Their rich history imbues each diamond with a unique
story and character
• Focus on provenance and ethical origin of growing
importance to retailers and consumers
• New partnership with Boodles on diamonds from the
Cullinan mine, allowing consumers to trace every step
of the diamond’s journey from mine to market
• Boodles’ Gemstones Director Jody Wainwright: “I am
looking for character stones…a stone that I can talk
from the heart about”
43Support of Diamond Market via DPA
The DPA aims to actively influence consumer demand for diamonds
Global consumer demand grew 2% in 2018 to $76bn¹ Dispelling myths about our industry
• China (+4.7%) and the US (+4.5%) were the fastest growing regions
Generic marketing
• Budget of +$70m for 2019; primary focus on the US (>50% market share)
with additional programmes in China, India and Europe
• Marketing campaigns based on extensive customer research and use
broad range of innovative channels to reach focused target audience
Total Clarity
• Aim to build consumer trust in mined diamonds by addressing
stereotypical myths and misconceptions
• Independent assessment of the value created by the diamond mining
industries for stakeholders
Trade education and assistance
• Continuous engagement with trade, education programmes and
production of customisable assets to assist with marketing diamonds to
consumers
1 Source: De Beers Diamond Insight Report 2019 44Positive Outlook for Luxury Jewellery Branded Market
LVMH acquisition of Tiffany signals confidence in jewellery sales potential
• LVMH acquires Tiffany for $16.2bn – largest deal ever in Luxury Goods Sales Growth in 2019 - ex currency movement
the luxury goods space
Jewellery +9.0
• Personal luxury goods market +4% to €281 billion in 2019,
despite geopolitical turbulence and recession fears Shoes +9.0
(preliminary data by Bain & Co) Leather goods +7.0
• Branded diamond jewellery sector noted as being one of Beauty +3.0
the fasted growing categories in the personal luxury goods
Apparel +1.0
sector
Watches -2.0
• Opportunity to expand market for diamond jewellery, which
remains ultimate gift to express love and commitment Source: Bain & Co
S
The enduring diamond engagement ring tradition (% of brides receiving a diamond) Percentage of diamonds in US engagement and wedding rings
Source: De Beers Insight Report 2019 Source: De Beers Insight Report 2019
45Diamond Producer’s Association – Total Clarity Report
46H1 FY 2020 vs. H1 FY 2019 Operational Results
Cullinan Finsch Koffiefontein Williamson
H1 FY H1 FY H1 FY H1 FY H1 FY H1 FY H1 FY H1 FY
Unit
2020 2019 2020 2019 2020 2019 2020 2019
ROM PRODUCTION
Tonnes treated Tonnes 2,295,197 1,996,624 1,534,256 1,503,335 561,296 377,391 2,654,906 2,510,451
Grade cpht 37.3 39.3 57.4 61.7 7.9 6.7 8.1 8.3
Diamonds recovered Carats 855,371 785,444 880,707 927,934 44,545 25,275 214,888 208,064
TOTAL PRODUCTION
Tonnes treated Tonnes 2,412,309 2,692,978 1,708,423 1,637,730 561,296 377,391 2,853,604 2,706,008
Diamonds recovered Carats 889,787 832,026 913,557 947,424 44,545 25,275 222,351 214,421
SALES
Diamonds sold Carats 730,847 688,536 783,962 829,530 34,163 23,406 194,835 194,913
Average price per carat US$ 112 96 79 105 431 447 184 223
Revenue US$M 81.7 66.2 61.7 87.0 14.7 10.5 35.9 43.5
On-mine cash cost
ZAR 262 224 400 419 585 10.2 11.6
per tonne treated 405
Capex1 US$M 12.0 22.8 5.6 13.8 2.3 3.2 5.7 3.2
1 Excludes capitalised borrowing costs
47Bank Debt Facilities – Covenants
Bank debt facilities undrawn and available to the Group as at 31 December 2019 of
R1.5 billion (ca. $107.2 million), in addition to diamond debtors of $12.8 million and
cash at bank of $53.6 million
Maintenance Covenants Distribution Covenants
12 months to 12 months to 12 months to 12 months to
Covenant 30 Jun 2020 31 Dec 2020 30 Jun 2021 All periods
31 Dec 20194
Required ratio Required ratio Required ratio Required ratio Required ratio
Consolidated Net Debt1 to ≤4.25x ≤3.5x ≤3.25x ≤3.0x ≤2.0x
Consolidated EBITDA
Consolidated EBITDA to ≥2.5x ≥2.75x ≥3.0x ≥3.25x ≥6.0x
Consolidated Net Finance
Charges
Consolidated Net Senior ≤0.4x ≤0.4x ≤0.4x ≤0.4x ≤0.3x
Debt2 to Book Equity3
1 Consolidated Net Debt is bank loans and borrowings plus loan notes, less cash, less diamond debtors and includes the BEE guarantees of ca. US$49.3 million
(ZAR689.5 million) as at 31 December 2019 (ca. US$52.1 million (ZAR790.4 million) as at 30 September 2019)
2 Consolidated Net Senior Debt means at any time the Consolidated Net Debt (excluding any second lien and other subordinated debt)
3 Book Equity is Equity excluding accounting reserves
4 The South African lender group has consented to a waiver of the EBITDA related covenant ratios for the December 2019 measurement period
48Debt Facilities
Utilised at Commitment fee
Size Size US$M1 Interest Rate
Lender Type 30 June 2019 on undrawn Repayment
ZARM facilities
US$M1
ZAR Revolving 1M JIBAR +
Absa & Nedbank 1,000 71 0 1.35%2 October 2021
credit facility 5.0%2
Absa & RMB ZAR Working SA Prime – Subject to
500 36 0 0.85%
(FNB) capital facility 1.0% annual renewal
Consolidated Net Debt to
Additional interest rate ratchet Additional commitment fee ratchet
Consolidated EBITDA
≤ to 2.5:1 0.0% 0.0%
> 2.5:1 but ≤ 3.0:1 +1.0% 0.0%
> 3.0:1 but ≤ 3.5:1 +2.0% +0.225%
> 3.5:1 but ≤ 4.0:1 +3.0% +0.450%
> 4.0:1 +4.0% +0.675%
1 Converted to USD using exchange rate of ZAR13.99/USD1
2 The ZAR Revolving Credit Facility is subject to margin and commitment fee ratchet mechanisms contingent on the Consolidated Net Debt: Consolidated EBITDA covenant
levels at each measurement date – see https://www.petradiamonds.com/investors/fixed-income-investors/banking-facilities/ for further information
49Analyst Guidance FY 2020 – Group Capex Profile
1 All Capex numbers stated in FY 2020 money terms (ZAR14.0/US$1 where applicable)
2 Depreciation on mining assets for FY 2020 guided at ca. US$85-90 million at R14.0/US$1 50Tailings Residue Deposit Management in line with Best Practice
• In South Africa risk-based mandatory Codes of Practices (“COP”)1 are available for all residue deposits at our mines as required
by, and according to set guidelines from the Department of Mineral Resources (DMR), Mine Health and Safety Inspectorate.
All COP documents are signed off by the DMR and the respective third party appointed Professional Engineers.
• The Williamson diamond mine in Tanzania does not require a COP by law but, since 2016, in line with best practice Petra
developed and implemented operating practices, set out in an operating manual, similar to a COP for the mine’s tailings deposits.
• Petra differentiates between a Coarse Residue Deposit (CRD) and a Fine Residue Deposit (FRD). All operations make use of CRDs
and FRDs. Coarse tailings (particles > ca. 0.5mm) are normally deposited on a CRD whilst fine tailings (particles < ca. 0.5mm)
are deposited on a FRD. Petra employs a dry conveying and stacking method for the CRD whilst the fine tailings are normally
pumped to a FRD.
• Generally, CRDs are relatively stable structures that do not impound water and therefore do not pose a risk of wall breach and flooding. At some
operations, older CRDs are being re-treated to extract residual diamonds lost in the diamond winning process during earlier years when diamond
winning technology was less efficient.
• All residue facilities are constructed using the upstream deposition method. The outer walls are constructed with the coarser fraction of the fines
residue whilst the finer fraction will settle in the dam basin, maintaining the pool away from the embankment walls. Supernatant and storm water
are pumped off the deposits on a continuous basis to reuse in the diamond winning process.
• At Finsch there are five FRDs; four of the facilities are located on the eastern side of the mining area with three being active and
one decommissioned as current deposition rates do not require it to be used. A further facility is located on the western side
of the mining area and is also active. At Koffiefontein there are three FRDs of which two are currently being used for fines residue deposition. The
third dam has been rehabilitated and is no longer utilised. At Cullinan there is only one FRD, referred to as the
No.7 dam. At the Williamson mine in Tanzania there are two FRDs of which one is currently active.
• In addition to internal compliance, assurance and performance audits, third party Professional Engineers together with mine geotechnical
engineers are appointed by Petra to oversee and provide assurance on the design and operational standards
of the tailings facilities through quarterly inspections.
• Further to third party assurance, annual external audits are conducted in line with OHSAS18001:2007 and ISO 14001:2015 management
standards and ad hoc inspections are carried out by the regulator.
• Important parameters that are being recorded, documented and managed include the overall condition of side slopes, benches
and basin, drain flow records, deposition rates and corresponding rate of rise, freeboard, the phreatic surface level, structural integrity of the
penstocks, pool size and location, impact on surrounding environment and potential zone of influence.
1 COP includes and refers to the design, managerial instructions, recommended standards and procedures required to manage and monitor the operation of facilities
51Thank you
Further enquiries:
investorrelations@petradiamonds.com
+44 20 74948203
www.petradiamonds.comYou can also read