Nestedness structure of bird assemblages in a fragmented forest in Central Argentina: the role of selective extinction and colonization processes
←
→
Page content transcription
If your browser does not render page correctly, please read the page content below
Animal Biodiversity and Conservation 44.1 (2021)                                                                17

Nestedness structure
of bird assemblages in a fragmented
forest in Central Argentina:
the role of selective extinction
and colonization processes

S. Dardanelli, L. M. Bellis

Dardanelli, S., Bellis, L. M., 2021. Nestedness structure of bird assemblages in a fragmented forest in Central
Argentina: the role of selective extinction and colonization processes. Animal Biodiversity and Conservation,
44.1: 17–29, Doi: https://doi.org/10.32800/abc.2021.44.0017

Abstract
Nestedness structure of bird assemblages in a fragmented forest in Central Argentina: the role of selective
extinction and colonization processes. Nestedness analysis constitutes an important tool to understand the
processes that shape wildlife communities. It also allows a quick first evaluation of species extinction proneness
in fragmented landscapes. Here, we tested whether avian assemblages in the fragmented Espinal forest exhi-
bited nested subset patterns. Furthermore, we examined whether selective extinction or selective colonization
are driving nested subset patterns. We studied avian assemblages in 13 forest fragments in central Argentina
during breeding and non–breeding seasons. We completed partial Spearman rank correlations to explore the
relationship between nestedness rank order and habitat patch variables and species life history traits related
to species extinction proneness and colonization rate. Bird species showed strong nestedness patterns, both
for the total incidence matrix and for forest fragments and species separately. Nestedness patterns were
similar during the breeding and non–breeding seasons. The nested rank order of forest fragments correlated
with area and distance to nearest fragment, both of which are patch characteristics known to increase the
probabilities of species extinction. The nested rank order of species was correlated with the minimum area of
species requirement, trophic guild, and range size, traits that are linked to extinction risk. Selective extinction
processes rather than selective colonization appear to be driving nestedness patterns of bird assemblages in
fragmented Espinal forest. The most effective way to preserve forest bird species in the Espinal forest seems
to be by protecting the larger fragments of this relictual forest.

Key words: Forest fragments, Avifauna, Community assembly, Seasonality, Species traits, Espinal forest

Resumen
Estructura anidada de ensamblajes de aves en un bosque fragmentado del centro de Argentina: el papel de
los procesos de extinción y colonización selectivos. El análisis de anidamiento constituye una herramienta
importante para comprender los procesos que dan forma a las comunidades de vida silvestre. También
permite hacer una primera evaluación rápida de la propensión a la extinción de las especies en paisajes
fragmentados. En el presente estudio, analizamos si los ensambles de aves en el bosque fragmentado del
Espinal siguen un patrón de subconjuntos anidados. Además, examinamos si la extinción selectiva o la colo-
nización selectiva están impulsando patrones de subconjuntos anidados. Estudiamos los ensambles de aves
en 13 fragmentos de bosque del centro de Argentina durante las estaciones reproductiva y no reproductiva.
Realizamos correlaciones parciales de rango de Spearman para analizar la relación entre el orden de rango
de anidamiento y las variables de parche de hábitat y los rasgos de la historia de vida de las especies rel-
acionados con la propensión a la extinción y la tasa de colonización de las especies. Las especies de aves
mostraron marcados patrones de anidamiento, tanto en relación con toda la matriz de incidencias como con
los fragmentos de bosque y las especies por separado. Los patrones de anidamiento fueron similares en la
estación reproductiva y no reproductiva. El orden de rango de anidamiento de los fragmentos de bosque se
correlacionó con la superficie y la distancia al fragmento más cercano, que son características del parche que
aumentan la probabilidad de extinción de las especies. El orden de rango de anidamiento de las especies
se correlacionó con el requerimiento mínimo de superficie de la especie, el gremio trófico y el tamaño del

ISSN: 1578–665 X                                        © [2021] Copyright belongs to the authors, who license the
eISSN: 2014–928 X                                       journal Animal Biodiversity and Conservation to publish the
                                                        paper under a Creative Commons Attribution 4.0 License.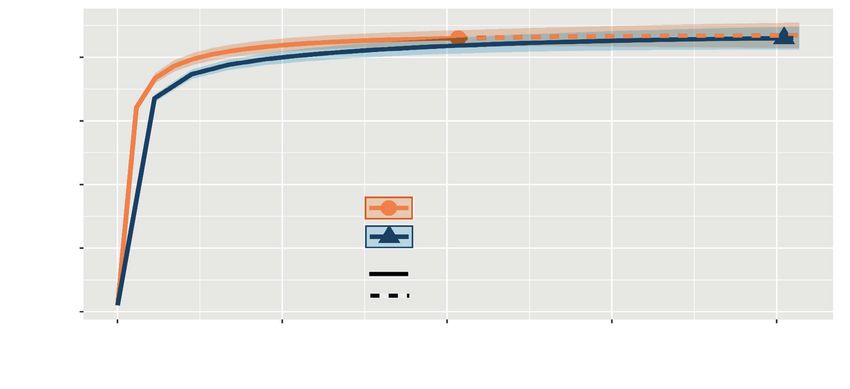
18                                                                                       Dardanelli and Bellis

rango, que son características vinculadas al riesgo de extinción. A diferencia de los procesos de colonización
selectiva, los de extinción selectiva parecen estar impulsando los patrones de anidamiento de ensamblajes
de aves en el bosque fragmentado del Espinal. La forma más eficaz de conservar las especies de aves del
bosque del Espinal parece ser mediante la protección de los fragmentos más extensos de este bosque rel-
ictual del centro de Argentina.

Palabras clave: Fragmentos de bosque, Avifauna, Ensamblaje comunitario, Estacionalidad, Rasgos de especies,
Bosque del Espinal

Received: 19 III 20; Conditional acceptance: 21 IV 20; Final acceptance: 27 VII 20

Sebastián Dardanelli, Instituto Nacional de Tecnología Agropecuaria (INTA), Estación Experimental Agropecuaria
Paraná, Ruta 11 km 12.5, 3101 Oro Verde, Entre Ríos, Argentina.– Laura M. Bellis, Instituto de Altos Estudios
Espaciales "Mario Gulich" (CONAE–UNC), Consejo Nacional de Investigaciones Científicas y Técnicas (CONICET),
and Facultad de Ciencias Exactas Físicas y Naturales, Universidad Nacional de Córdoba, Córdoba, Argentina.

Corresponding author: S. Dardanelli. E–mail: sedardanelli@gmail.com

ORCID ID: S. Dardanelli: 0000-0003-4341-3879; Laura Bellis: 0000-0002-0725-5079
Animal Biodiversity and Conservation 44.1 (2021)                                                                   19

Introduction                                                 Wilcox et al., 1986). It states that fragment area is
                                                             the main driver of communities' structure as species
Habitat loss and fragmentation are among the most im-        loss is predictable and follows gradients of species
portant threats to biodiversity worldwide (Wilcove et al.,   sensitivity to habitat size (Wright et al., 1998; Watling
1998; Sala et al., 2000; Haddad et al., 2015). Broad–        and Donnelly, 2006; Matthews et al., 2015). Under
scale habitat fragmentation gives rise to archipelagos       this mechanism animal species with large area re-
of natural habitat fragments or islands immersed in a        quirements, high trophic guild (i.e. carnivorous and
matrix of anthropogenic open habitat (Matthews et al.,       insectivorous), small range size and large body mass
2015). Since species sensitivity to habitat fragmentation    will be the first to become extinct when the area of the
in a particular region is variable, species loss in those    fragments is reduced (Matthews et al., 2015; Keinath
remaining habitat islands does not necessarily occur at      et al., 2017; Li et al., 2019). On the other hand, the
random but may occur in a nested pattern (Patterson          selective colonization hypothesis states that the ha-
and Atmar, 1986; Atmar and Patterson, 1993, 1995).           bitat isolation would be the main mechanism behind
In nested assemblages, poorer communities constitute         nestedness structure of an assemblage (Watling and
proper subsets of increasingly richer communities (Pat-      Donnelly, 2006; Meyer and Kalko, 2008). Under this
terson and Atmar, 1986). Therefore, less widespread          mechanism, species with low dispersal ability –such
species occur on sites with relatively large species         as those with a low dispersal ratio or small body
assemblages while poorer assemblages are mostly              mass– will colonize only the less isolated fragments
composed of ubiquitous species (Cutler, 1991; Soga           and will fail to colonize those that are more isolated
and Koike, 2012). Consequently, in archipelagos with         (Loo et al., 2002; McAbendroth et al., 2005; Frick et
'perfect' nestedness structure, it is possible to predict    al., 2009).
the order of disappearance of the less ubiquitous spe-           Although explanation of nestedness structure under
cies from the poorer sites in response to environmental      selective extinction and selective colonization implies
gradients (Atmar and Patterson, 1993) as the species         the combination of site variables with species traits
that are present only in the richer fragments are more       (Ulrich et al., 2009), few studies have tried to analyze
likely to become extinct as environmental disturbances       their roles in generating nestedness simultaneously
increase (Nupp and Swihart, 2000).                           (Wang et al., 2012; Li et al., 2019).
    Nestedness analysis is an important tool to un-              The Espinal xerophytic forest in central Argentina
derstand the processes that shape communities and            provides a suitable scenario to address the effects of
to reveal the ecological and evolutionary limits of the      habitat fragmentation in species assemblage structure.
species. Furthermore, it has valuable implications for       Here, open forests historically used for cattle grazing
conservation (Wright et al., 1998; Martinez–Morales,         have been converted to row crop production (Baldi
2005). Nestedness analysis is attractive because it          and Paruelo, 2008). The expansion of cultivated land
allows a quick first evaluation of species extinction        has been related to a combination of climate change
proneness in species assemblages of fragmented               (increasing precipitation), increasing global demand
landscapes (Ganzhorn and Eisenbei, 2001). Although           for agricultural products, national economic policies,
this approach alone is insufficient to evaluate stra-        and new technologies (genetically modified seeds,
tegies to preserve biodiversity in fragmented biotas         agrochemicals, machinery) (Grau and Aide, 2008;
(Cutler, 1994) it could be highly useful as predicting       Zak et al., 2008).
species loss can be used to make informed land–use               At present, the Espinal xerophytic forest is an
decisions and to effectively protect species that will       extremely degraded lowland forest with less than 5%
disappear first in a determined fragmentation scenario       of the original forest area (Dardanelli et al., 2006;
(Fleishman et al., 2007).                                    Lewis et al., 2009; Morello et al., 2012; Noy–Meir
    Four main processes have been proposed to explain        et al., 2012). Because of this severe fragmentation
nestedness patterns: (1) selective extinction of species     and habitat loss, avian diversity has been negatively
with large spatial requirements in relation to fragment      affected (Dardanelli and Nores, 2001; Dardanelli,
area (Wang et al., 2012; Matthews et al., 2015); (2)         2006; Dardanelli et al., 2006). At least eight species
selective colonization of species with low dispersal         appear to have become extinct in this forest in the
ability in relation to fragments isolation (Kadmon, 1995);   province of Córdoba, Central Argentina, and another
(3) random, passive sampling from a common species           nine species are sensitive to fragmentation (Darda-
pool, which can result in a nested pattern if sites are      nelli et al., 2006). However, fragmentation effects on
more likely to be occupied by species that are regionally    the species composition and nestedness structure of
more abundant (Cook and Quinn, 1995; Wright et al.,          avian assemblages have not been assessed. Studying
1998); and (4) selective occupation of hierarchically        drivers behind nestedness structure of avian assem-
nested habitats (Honnay et al., 1999). However, studies      blages in fragmented Espinal forest would provide
of the mechanisms explaining nestedness structure            insights that could help avian conservation. The de-
on archipelagos resulting from habitat fragmentation         sign of effective management plans in poorly studied
have found that, in most cases, nestedness structure         and highly fragmented habitats, such as the Espinal
is driven by selective extinction and, to a lesser extent,   forests of Córdoba, Argentina, could take advantage
to selective colonization process (Watling and Donnelly,     of nestedness analyses, especially in a place where
2006; Matthews et al., 2015).                                there is no time or resources to undertake long–term
    The selective extinction hypothesis is related           studies and when decisions for conservation action are
to the concept of faunal 'relaxation' (Brown, 1978;          urgent (Ganzhorn and Eisenbei, 2001; Fleishman et
20 Dardanelli and Bellis
al., 2007). Here, we tested whether avian assemblages sampling days (Dardanelli et al., 2006). To adjust
in the fragmented Espinal forest exhibit nestedness for differences in species detectability we compared
patterns for winter and summer assemblages. Further- species richness among forest patches and between
more, we examined the mechanisms underlying the seasons using rarefaction curves. Rarefaction analysis
nestedness structure, particularly focusing on whether calculates species richness after standardizing diffe-
selective extinction, selective colonization, or passive rences in abundance among samples by estimating
sampling are driving nestedness patterns for winter the expected number of species of each sample if all
and summer assemblages. samples are reduced to a standard size (Magurran,
2004). Rarefaction curves were performed using iNext
(Chao et al., 2016).
Material and methods We distinguished two types of birds occurring in
the fragments: forest species (species that inhabit
Study area only xerophytic forests in the study area), and habitat
generalists that use both forest and open areas (ta-
Our study was conducted in the Espinal forest frag- ble 1s in supplementary material). Because the focus
ments in the eastern lowlands of Córdoba Province, of this study is on patch level effects, we centred our
Argentina (fig. 1). Forest fragments are located in investigation on species for which xerophytic forest
private lands since there are no protected areas in is a primary habitat. Therefore, prior to analysis, we
the region. The mean annual precipitation of about removed all species for which xerophytic forest is not
700–800 mm falls mostly in late–spring and summer, considered primary habitat (Cook et al., 2002; Watson,
from October to March; the rest of the year is the dry 2003; table 1s in supplementary material). We also
season. The mean annual temperature is 16 ºC, with removed migratory species (Nores, 1996; Barnett
a maximum peak of 44 ºC and minimum temperature and Pearman, 2001), considering only year–round
of –9 ºC (Morello et al., 2012). This region is regarded residents as they necessarily colonize the fragments
a semiarid environment because of the high potential at the beginning of the breeding season and leave
of evapotranspiration that generates a water deficit for (disappear) at the end of the breeding season (Wat-
11 months of the year (Morello et al., 2012). son, 2003). However, we acknowledge the response of
The vegetation of forest fragments has a tree stra- generalist and migratory bird species to fragmentation
tum of 5–10 m in height composed mainly of Prosopis could have some relevance and would need to be
alba, Prosopis nigra, Celtis ehrenbergiana, Geoffroea considered when designing conservation measures
decorticans, and Aspidosperma quebracho–blanco. at regional scales for the Espinal forests in Argentina.
Common components of the understory (1 to 5 m It is important to mention that most fragments and all
height) are species in the genera Acacia and Schinus, species analyzed in this study persist in the study area
also including Porliera microphylla and Jodina (Verga et al., 2019; eBird, 2020). Thus, we consider
rhombifolia. The herbaceous stratum (0–1 m height) that the results of our study could be applied to the
includes herbs and grasses; common components of current scenario, as both the fragmented forest and
the stratum are species of the genera Solanum spp., the bird species have remained constant.
Eupatorium spp., Stipa spp., Setaria spp., Paspalum The order of the families and the generic and spe-
spp., etc. (Cabrera, 1994; Morello et al., 2012). cific names of bird species follow the South American
All fragments in our study had three well–developed Classification Committee (Remsen et al., 2020).
vegetation strata (tree, shrub, and herbaceous), were
completely isolated (no corridors or rivers connecting Species traits
any fragment, fig 1), and were embedded in a ma-
trix of croplands, mostly soybean during the austral To analyse the influence of extinction and the coloni-
summer and wheat or fallow fields during the winter. zation process in structuring species occurrences, we
Thus, we considered the contrast between forest selected species life history traits commonly associated
fragments and the matrix to be high (Lindenmayer with avian species extinction proneness or dispersal
and Fischer, 2006) for forest birds. ability (table 2s in supplementary material). Geographic
range size, trophic guild and natural abundance are life
Bird sampling history traits related to extinction proneness (Davidar
et al., 2002; Henle et al., 2004; Feeley et al., 2007;
We surveyed bird species in 13 forest fragments (ran- Wang et al., 2010). On the other hand, body mass
ged from 0.25 to 217.4 ha). Nocturnal species (Stri- and dispersal ratio area are life history traits that are
gidae and Caprimulgidae) and species that only flew usually linked to species ability to colonize new sites
over the fragments were not considered. Surveys were (Schoener and Schoener, 1984; Cook and Quinn, 1995;
conducted during the austral winter (June–August Henle et al., 2004; Jenkins et al., 2007).
2001) and austral summer (December2001–March We obtained distributional range size from Birdlife
2002) seasons. One observer (SD) carried out all International species factsheets (BirdLife Internatio-
the surveys by intensive searches recording all bird nal, 2020). Trophic guild data were constructed by
species seen or heard while walking slowly through extracting data of local species diet (Zotta, 1940; Del
the whole fragment from pre–dawn to 11:00 and Hoyo et al., 1992; Alessio et al., 2005; Salvador et al.,
from 14:00 until sunset. We surveyed each fragment 2017) and creating four categories: 1, herbivores; 2,
until no new species were added in 4–8 additional omnivores; 3, insectivores, and 4, carnivores. Mini-Animal Biodiversity and Conservation 44.1 (2021) 21
A
B
G
K
A
E
D
H
L
C J F M Google Earth N
I
Image Landsat / Copernicus
60 km
B
B
L
D
N
G N
1 km 700 m
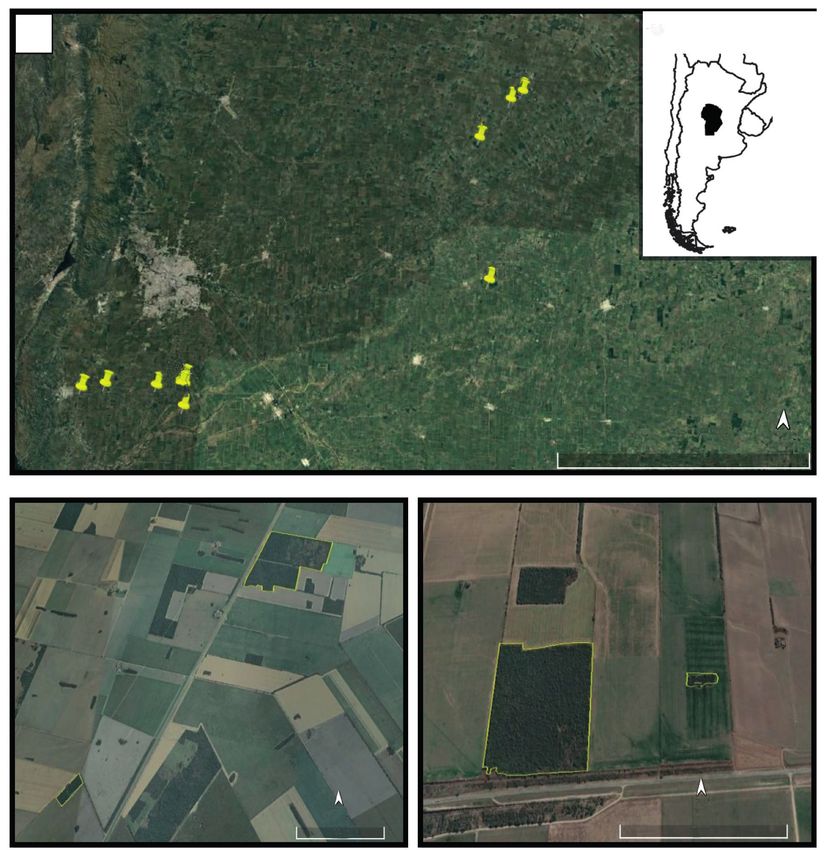
Fig. 1. A, study area showing the spatial distribution of the forest fragments of Espinal included in the study
of nestedness of forest birds in central Argentina; B, examples of some of the studied forest fragments.
Fig. 1. A, área de estudio en la que se muestra la distribución espacial de los fragmentos de bosque del
Espinal incluidos en el estudio del anidamiento de aves forestales en el centro de Argentina; B, ejemplos
de algunos de los fragmentos de bosque estudiados.
mum area requirement was obtained from Dardanelli dispersers (Fischer and Lindenmayer, 2005; Li et
et al. (2006). Body mass data were obtained from al., 2019). Species traits were not correlated among
Dunning (2008). The dispersal ratio was calculated them (Pearson r < 0.4).
by dividing each species mean wing length (mm) by
the cube root of its mean mass in grams (Fischer Site variables
and Lindenmayer, 2005; Li et al., 2019). The rela-
tionship of this ratio with dispersal ability is positive We selected different landscape variables to charac-
so that species with higher ratios will disperse longer terize spatial configuration of the forest fragments:
distances and species with lower ratios will disperse area (Area; ha), perimeter (m), two isolation variables:
shorter distances and will consequently be poor distance to the nearest fragment (DNF; meters) and22 Dardanelli and Bellis
proximity index in a 2 km–buffer area (PI), and shape ments), and the overall abundances n1, n2,…, ns of
index (SI) (table 3s in supplementary material). Area, the S species represented in C, which is a collection
Perimeter and Isolation metrics were calculated using of N individuals from S species (Coleman, 1981):
Quantum GIS (QGIS) software. We estimated shape
S
index as SI = Pm/Pc, where Pm is the measured pe-
rimeter of the fragment and Pc is the perimeter of a ŝ(α)= S ‒ S
i=1
(1 ‒ α) ni
circular fragment of the same area. This SI index was
used in similar studies and has been found to be less The variance σ2ŝ(α) is determined as
correlated to the area than other shape indices (Hinsley
S S
et al., 1995; Santos et al., 2002; Watson et al., 2004).
We found that the Perimeter and Shape index were σ2(α)= S
i=1
(1 ‒ α) ni
‒ S(1 ‒ α)2
i=1
ni
highly correlated with Area (Pearson r ≥ 0.7). For this
reason, we excluded these variables, as they were If the hypothesis of random placement holds
dependent on area. roughly two–thirds of the points should fall within
the band bounded by ± one standard deviation of
Data analysis the expected curve, or if less than two–thirds of the
points fall within the bands, it should be rejected
Matrices of presence–absence were assembled (Coleman et al., 1982).
for both seasons. We used the metric based on To check for spatial autocorrelation in the data (i.e.
overlap and decreasing fill 'NODF' to evaluate nes- figures of variables sampled at nearby locations tend
tedness (Almeida–Neto et al., 2008). Through the to have more similar values than would be expected
online interface NeD (http://ecosoft.alwaysdata.net/) by chance) we fitted a semivariogram randomisation
developed by Strona et al. (2014), nestedness can analysis based on 99 Monte Carlo permutations
be calculated for the whole incidence matrix and (Isaaks and Srivastava, 1989). Spatial autocorrelation
independently for species (NODF between rows) in the response variable (species richness) violates
and sites (NODF between columns). We ran five the assumption of independently and identically
null models to estimate the significance level of distributed errors and hence inflates type I errors
nestedness: equiprobable row and column totals (Dormann, 2007).
(EE), equiprobable row totals– Fixed column totals The order in which sites and species are organized
(EF), fixed row totals–equiprobable column totals by NODF can be compared with several independent
(FE), and fixed–column and fixed–row totals (FF) variables to evaluate their possible roles in producing
algorithms. FF algorithm has shown to be highly nestedness (Patterson and Atmar 2000). To test the
restrictive and EE poorly restrictive (Ulrich and Go- effects of forest fragment traits on nestedness, we
telli, 2012; Strona and Fattorini, 2014; Matthews et performed Spearman rank correlations between the
al., 2015; Si et al., 2015). All these null models have forest fragments rank orders in the maximally packed
strengths and weaknesses (Ulrich and Gotelli, 2012; matrix and ranked traits of the forest fragments (table
Strona and Fattorini, 2014; Matthews et al., 2015; Si 3s in supplementary material). Similarly, to assess
et al., 2015). However, PP and FF null models were the role of species traits in driving nestedness
described as less biased than the others (Ulrich and patterns, we calculated Spearman rank correlations
Gotelli, 2012). Furthermore, PP has been found to be between the species rank orders in the maximally
the preferred model when research systems contain packed matrix and ranked species traits (table 2s
relatively small islands, when the scale of analysis in supplementary material). Statistical significance
is small, and because it is considered more ecolo- was established at P < 0.05.
gically meaningful (Ulrich and Gotelli, 2012; Strona Partial Spearman rank correlations and semiva-
and Fattorini, 2014; Matthews et al., 2015; Si et al., riograms were performed using R (R Development
2015). This model provides an unbiased proportional Core Team, 2016).
resampling of matrix incidences proportional to row
and column totals (Almeida–Neto and Ulrich, 2011).
Expected nestedness metrics and related parameters Results
were generated for winter and summer assemblages
by running 1,000 Monte Carlo simulations. We recorded 43 forest resident species in the frag-
The passive sampling hypothesis can be tested ments (tables 2s, 4s, and 5s in supplementary ma-
using the Coleman's (Coleman, 1981; Coleman et terial). Rarefaction analyses confirmed that all forest
al., 1982) random placement model (Calme and patches were adequately and comparatively sampled
Desrochers, 1999; González–Oreja et al., 2012; Wang in both seasons (fig. 2). Four species were ubiquitous
et al., 2012; Li et al., 2019). The random placement for both seasons, the stripe–crowned spinetail (Crani-
model was used to verify whether passive sampling oleuca pyrrhophia), the pearly–vented tody–tyrant
from species abundance distributions was driving the (Hemitriccus margaritaceiventer), the golden–billed
nestedness structure of bird communities. Coleman saltator (Saltator aurantiirostris), and the black–and–
et al. (1982) state that the number of species ŝ(α) to chestnut warbling–finch (Poospiza whitii) (tables 4s, 5s
be found residing in a given site depends on this site in supplementary material). Three other species had
relative area, α (which equals the ratio of the area of only one absence in winter, the great antshrike (Taraba
a particular fragment to the summed area of all frag- major), the white–tipped plantcutter (Phytotoma rutila),Animal Biodiversity and Conservation 44.1 (2021) 23
40
30
Species diversity
20
Summer
Winter
10
Interpolated
Extrapolated
0
0 1,000 2,000 3,000 4,000
Number of individuals
Fig. 2. Rarefaction curves for bird species richness for resident forest birds of forest fragments in the
austral winter (blue) and austral summer (orange), in Córdoba, Argentina.
Fig. 2. Curvas de rarefacción de la riqueza de especies de aves forestales residentes en fragmentos de
bosque en el invierno austral (azul) y el verano austral (naranja), en Córdoba (Argentina).
and the creamy–bellied thrush (Turdus amaurochali- Species order in matrices packed for maximum
nus) (tables 4s and 5s in supplementary material); and nestedness showed a significant relationship with
one species had only one absence in summer, the minimum area requirement, trophic guild, and range
brown cachalote (Pseudoseisura lophotes). All these size both in winter and summer, and with species
species were common in the fragments. On the other distributional range size in summer (table 2). Species
hand, eight species: the sharp–shinned hawk (Accipiter traits commonly related to colonization ability like
striatus erythronemius), the spot–winged falconet body mass and dispersal ratio were not significantly
(Spiziapteryx circumcinctus), white–barred piculet correlated with the species order.
(Picumnus cirratus), the scimitar–billed woodcreeper The nestedness of forest birds' assemblages was
(Drymornis bridgesii), the narrow–billed woodcreeper not caused by passive sampling in summer or winter
(Lepidocolaptes angustirostris), the crested hornero assemblages. Only one data point in summer and
(Furnarius cristatus), the suiriri flycatcher (Suiriri suiriri) four out of 13 in winter data points fell within ± 1 SD
and the cinereous tyrant (Knipolegus striaticeps) of the expected Coleman's species/relative area
occupied only the largest fragments (≥ 80 ha) and curves (fig. 3, 4), which means that it did not follow
were all scarce. Some of these species occupied expectations from the random placement hypothesis.
smaller fragments during winter (tables 4s and 5s in
supplementary material).
The semivariogram did not show a significant as- Discussion
sociation between the spatial distribution of the forest
fragments and species richness in winter or summer Bird assemblages in fragmented Espinal forest in
(fig. 1s in supplementary material). Central Argentina showed a non–random structure,
The bird assemblages were significantly nested in with species aggregation consistent with the nested
both seasons (table 1) for all null models except the subset model across seasons, for the whole matrix,
very restrictive FF (fixed–fixed) model. Both NODF and for columns (forest fragments) and rows (bird
values and matrix structure were similar between species) separately. This nested structure did not
seasons for resident birds (table 1). Our results show follow the random placement hypothesis (Coleman,
a high temporal constancy in the nested pattern for 1981; Coleman et al., 1982).
resident bird assemblages in Espinal forest fragments The nestedness structure in our studied system
in Central Argentina. showed a structure consistent with the selective
Spearman's rank correlations showed that the extinction hypothesis as nestedness was related
remnant order that maximized nestedness in both to fragment area and species traits associated with
winter and summer was correlated with remnants extinction proneness such as trophic guild, minimum
ordered according to the area and distance to the area requirement and distributional range size. The
nearest fragment (table 2). The proximity index was correlation of fragment area and species traits with
not significantly correlated with remnant order. nested rank indicated that bird assemblages on24 Dardanelli and Bellis
Table 1. Comparative analyses of nestedness for resident forest birds in forest fragments between
seasons, in Córdoba, Argentina. Nestedness metrics and related parameters are provided for two
seasons: winter and summer. P–values were generated by 1,000 Monte Carlo simulations: EE,
equiprobable–eqiprobable null model; PP, proportional–proportional null model; FF, fixed–fixed null
model; SD, standard deviation; * significant nestedness (P < 0.05); matrix, nestedness estimator for the
whole presence–absence matrix; species, row nestedness estimator among species (based on species
incidence); fragments, column nestedness estimator among fragments (based on species composition).
Tabla 1. Análisis comparativos del anidamiento de las aves residentes en fragmentos de bosque entre
estaciones, en Córdoba (Argentina). Se proporcionan los valores de anidamiento y los parámetros relacionados
para las dos estaciones: invierno y verano. Los valores P se generaron a partir de 1.000 simulaciones de
Monte Carlo: EE, modelo nulo equiprobable–equiprobable; PP, modelo nulo proporcional–proporcional; FF,
modelo nulo fijo–fijo; SD, desviación estándar; * anidamiento significativo (P < 0,05); matrix, estimador de
anidamiento para toda la matriz de presencia–ausencia; species, estimador de anidamiento de fila entre
especies (basado en la incidencia de especies); fragments, estimador de anidamiento de columna entre
fragmentos (basado en la composición de especies).
Season
Extent NODFobs NODFEE NODFEF NODFFE NODFPP NODFFF
Winter
Matrix 84.51 57.95* (2.06) 73.03* (0.81) 62.00* (2.18) 66.77* (2.20) 85.07 (0.46)
Species 84.19 57.87* (2.15) 73.23* (0.66) 61.43* (2.31) 66.70* (2.21) 84.83 (0.479)
Fragments 88.29 58.81* (2.94) 70.72* (3.19) 68.54* (0.84) 67.57* (2.97) 87.93 (0.25)
Summer
Matrix 86.11 57.08* (2.12) 72.83* (0.87) 60.96* (2.16) 66.25* (2.24) 85.88 (0.49)
Species 85.93 57.02* (2.21) 72.99* (0.72) 60.42* (2.28) 66.19* (2.97) 85.49 (0.54)
Fragments 88.25 57.75* (2.91) 71.02* (3.94) 67.17* (0.84) 66.84* (3.05) 88.27 (0.25)
smaller fragments were predictable subsets of richer distribution range and high trophic guild, are predicta-
faunas occurring on larger fragments. It also indicated ble subsets of species that do not need large areas,
that species requiring large areas have a restricted are broadly distributed, and are at low trophic guild.
Table 2. Results of Spearman Rank correlations of forest fragments nestedness rank order with fragment
traits; and bird species nestedness rank order with bird life history traits, for the maximally packed nested
matrix: DNF, distance to nearest fragment; PI, proximity index in 2 km buffer; MAR, minimum area
requirement; RS, distribution range size; TG, trophic guild; BM, body mass; DR, dispersal ratio. (Level
of significance: ** P < 0.01, * P < 0.05)
Tabla 2. Resultados de las correlaciones de rango de Spearman entre el orden de rango de anidamiento de los
fragmentos de bosque con los rasgos de los fragmentos, por un lado, y entre el orden de rango de anidamiento
de las especies de aves con los rasgos de la historia de la vida de las aves, por otro, para la matriz anidada
empaquetada al máximo: DNF, distancia al fragmento más cercano; PI, índice de proximidad en la zona
de amortiguación de 2 km; MAR, requerimiento mínimo de superficie; RS, tamaño del área de distribución;
TG, gremio trófico; BM, masa corporal; DR, índice de dispersión. (Nivel de significancia: ** P < 0,01, * P < 0,05).
Fragment traits Species life–history traits
Area DNF PI MAR TG RS BM DR
Winter 0.60* 0.63* 0.42 0.75** 0.35* 0.20 0.10 0.11
Summer 0.78** 0.59* 0.53 0.78** 0.41** 0.33* 0.04 0.25Animal Biodiversity and Conservation 44.1 (2021) 25
50
45
40
35
Species number
30
25
20
15
10
5
0
–3.5 –3 –2.5 –2 –1.5 –1 –0.5 0
Log (relative area)
Fig. 3. Comparison of observed data to expected values under the random placement model for resident
forest birds in forest fragments in the austral summer, in Córdoba, Argentina. Expected values (solid line)
and associated standard deviations (± 1 SD; dashed lines) are shown. Open circles represent observed
species richness.
Fig. 3. Comparación de los datos observados y esperados según el modelo de ubicación aleatoria para
aves forestales residentes en fragmentos de bosque en el verano austral, en Córdoba (Argentina). Las
líneas continuas representan los valores esperados y las líneas discontinuas representan las desviaciones
estándar asociadas (± 1 DE; líneas discontinuas). Los círculos representan la riqueza de especies observada.
These results are in agreement with similar studies of dispersal ability for birds in this study. The other
in fragmented habitats where selective extinction possibility is that because colonization has marginal
arises as the most common driver of nestedness importance in driving nestedness structure in our
structure (Wright et al., 1998; Matthews et al., 2015; system, it does not express any significant relationship
García–Quintas and Parada, 2017; De la Hera, with our dispersal ability proxies. Consequently, we
2019). The importance of extinction driven processes could venture to say that the selective colonization
in shaping community assembly has been found in hypothesis only partially explains birds' nestedness
many fragmented landscapes (Martinez–Morales, structure in Espinal forest of Central Argentina. One
2005). It has been suggested that the trigger for possible explanation for the low influence of selective
this kind of patterns is a faunal relaxation process, colonization is that species with low dispersal ability
which is characteristic of highly fragmented or relic- have already become extinct in the study area. We
tual forest ecosystems (Brooks et al., 1999; Ferraz documented this in a previous study in the same area
et al., 2007). where, for example, most large birds have disappea-
The prevalence of colonization driven patterns is red from fragmented forests (Dardanelli et al., 2006).
less frequent in fragmented terrestrial habitats (Wright Moreover, as has been demonstrated in other studies
et al., 1998; Watling and Donnelly, 2006), and it (Watling and Donnelly, 2006; Matthews et al., 2015), it
appears to be an important driver for other isolated is very difficult to find biologically meaningful isolation
habitats such as mountaintops, land–bridge islands effects on assemblage structure. In the case of bird
and oceanic islands (Cook and Quinn, 1995; Wright communities in South America, it is even more cha-
et al., 1998; Watling and Donnelly, 2006; Meyer and llenging considering knowledge of colonization ability
Kalko, 2008; García–Quintas and Parada, 2017). Our or dispersal rate of species is scarce (Faaborq et al.,
results showed that selective colonization seems to 2010; Jahn et al., 2017). It is therefore challenging to
have some influence on community assembly as assess the role of selective colonization hypothesis
distance to nearest fragment was correlated with in the assemblage structure of Espinal forest birds.
fragments nested order. However, species traits Nevethless, it seems to have secondary importance
commonly associated with dispersal ability such as as a driver of nestedness aggregation. This highly
body mass and dispersal ratio were not related to fragmented forest has almost disappeared from
species order. In this regard, it is possible that dis- this region and the few remaining fragments have
persal ratio and body mass were not good indicators undergone faunal relaxation for many years, giving26 Dardanelli and Bellis
50
45
40
35
Species number
30
25
20
15
10
5
0
–3 –2.5 –2 –1.5 –1 –0.5 0
Log (relative area)
Fig. 4. Comparison of observed data to expected values under the random placement model for resident
forest birds of forest fragments in the austral winter, in Córdoba, Argentina. Solid lines represent expected
values and dashed lines represent associated standard deviations (± 1 SD; dashed lines). Open circles
represent observed species richness.
Fig. 4. Comparación de los datos observados y esperados según el modelo de ubicación aleatoria para las
aves forestales residentes en fragmentos de bosque en el invierno austral, en Córdoba (Argentina). Las
líneas continuas representan los valores esperados y las líneas discontinuas representan las desviaciones
estándar asociadas (± 1 DE; líneas discontinuas). Los círculos representan la riqueza de especies observada.
rise to extinction driven biotas. Consequently, we did Protecting the larger and less isolated forest frag-
not find any relationship between proximity indexes ments would be the most effective way to preserve
or any species trait related to dispersal ability with resident birds in this relictual Espinal forests. The
nestedness order. preservation of large and less isolated fragments
Nestedness structure did not vary between sea- would help to protect resident birds with large area
sons. Consequently, seasonality does not seem to requirements, small distribution range size, and high
influence nestedness in our system. These results trophic guilds (i.e. carnivorous and insectivorous
are consistent with the results of Seoane et al. species). For example, by protecting the two largest
(2013), García–Quintas and Parada (2014), Zhou forest fragments it is possible to maintain most spe-
et al. (2014) and De la Hera (2019) who found no cies (97.7 % in summer; 95.3 % in winter) of forest
seasonality effects on nestedness structure of birds in birds in the dataset. As mentioned by other authors,
isolated woodlots in Spain and birds of urban parks nestedness analysis can be used in combination with
in Hong Kong and Spain. Our results, however, con- other approaches to provide valuable recommenda-
tradict the results of Murgui (2010) who found small tions for decision–making when long–term data are
but significant differences in nestedness structure not available. Based on the results of the present
and species–area relationships between seasons study, future landscape management of Espinal fo-
in urban parks in Spain. This author ruled out an rest should ensure the protection of large fragments
increase in mortality outside the breeding seasons as they preserve the largest populations of resident
as they have mild winters. He considered that the forest species throughout the year.
use of alternative habitats outside of parks during
autumn and winter is the most likely explanation for
the observed patterns. The winters in the Espinal Acknowledgements
forest fragments in Central Argentina are mild and
bird species are probably less prone to use alter- We thank G. and M. Esmóris, R. Parra, A. Varselotti
native habitats than birds in urban parks. Another and F. Mansilla for providing access to their proper-
difference is that specialist birds analyzed in our ties. We also thank D. A. Serra and M. Nores for
system are generally more sensitive to disturbances assistance with the bird surveys. Consejo Nacional
and less adaptable than generalist species in urban de Investigaciones Científicas y Técnicas (CONICET)
parks in Spain. provided partial funding.Animal Biodiversity and Conservation 44.1 (2021) 27
References lonization in Nested Species Subsets. Oecologia,
102: 413–424.
Alessio, V. G., Beltzer, A. H., Lajmanovich, R. C., Cutler, A. H., 1991. Nested Faunas and Extinction
Quiroga, M. A., 2005. Ecología alimentaria de in Fragmented Habitats. Conservation Biology,
algunas especies de Passeriformes (Furnariidae, 5: 496–504.
Tyrannidae, Icteridae y Emberizidae): consideracio- – 1994. Nested biotas and biological conservation:
nes sobre algunos aspectos del nicho ecológico. metrics, mechanisms, and meaning of nestedness.
Insugeo, Miscelánea, 14: 441–482. Landscape and Urban Planning, 28: 73–82.
Almeida–Neto, M., Guimaraes, P., Guimarães, P. R., Dardanelli, S., 2006. Dinámica de comunidades de
Loyola, R. D., Ulrich, W., 2008. A consistent metric aves en fragmentos de bosque de la Provincia
for nestedness analysis in ecological systems: de Córdoba. Tesis doctoral, Universidad Nacional
reconciling concept and measurement. Oikos, de Córdoba.
117: 1227–1239. Dardanelli, S., Nores, M., 2001. Extinción y coloni-
Almeida–Neto, M., Ulrich, W., 2011. A straightforward zación de aves en fragmentos de bosque de la
computational approach for measuring nestedness Provincia de Córdoba, Argentina. Boletín de la
using quantitative matrices. Environmental Mode- Academia Nacional de Ciencias, 66: 55–60.
lling & Software, 26: 173–178. Dardanelli, S., Nores, M. L., Nores, M., 2006. Minimum
Atmar, W., Patterson, B. D., 1995. Nested temperature area requirements of breeding birds in fragmen-
calculator: a visual basic program, including 294 ted woodland of Central Argentina. Diversity and
presence absence matrices. The Field Museum, Distributions, 12: 687–693.
Chicago, IL. Davidar, P., Yogananad, K., Ganesh, T., Devy, S.,
– 1993. The Measure of Order and Disorder in the 2002. Distributions of forest birds and butterflies
Distribution of Species in Fragmented Habitat. in the Andaman Islands, Bay of Bengal: nested
Oecologia, 96: 373–382. patterns and processes. Ecography, 25: 5–16.
Baldi, G., Paruelo, J. M., 2008. Land–use and land De la Hera, I., 2019. Seasonality affects avian species
cover dynamics in South American temperate distribution but not diversity and nestedness patterns
grasslands. Ecology and Society, 13: 6. in the urban parks of Vitoria–Gasteiz (Spain). Animal
Barnett, J. M., Pearman, M., 2001. Lista comentada Biodiversity and Conservation, 42: 279–291, Doi:
de las aves argentinas: Annotated checklist of the https://doi.org/10.32800/abc.2019.42.0279
birds of Argentina. Lynx, Barcelona, Spain. Del Hoyo, J., Elliott, A., Sargatal, J., 1992. Handbook
BirdLife International, 2020. IUCN Red List for birds of the birds of the world. Lynx Edicions, Barcelona,
[WWW Document], 2020. URL http://datazone. Spain.
birdlife.org/home [Accessed 3 May 2020]. Dormann, C. F., 2007. Effects of incorporating spatial
Brooks, T. M., Pimm, S. L., Kapos, V., Ravilious, C., autocorrelation into the analysis of species distri-
1999. Threat from deforestation to montane and bution data. Global Ecology and Biogeography,
lowland birds and mammals in insular South–east 16: 129–138.
Asia. Journal of Animal Ecology, 68: 1061–1078. Dunning, J., 2008. CRC handbook of avian body mas-
Brown, J. H., 1978. The theory of insular biogeography ses, 2nd edition. CRC Press, Boca Ratón FL, USA.
and the distribution of boreal birds and mammals. eBird, 2020. eBird: An online database of bird dis-
Great Basin Naturalist Memoirs, 2: 209–227. tribution and abundance [web application]. eBird,
Cabrera, A. L., 1994. Enciclopedia Argentina de agri- Cornell Lab of Ornithology, Ithaca, New York.
cultura y jardinería, Tomo II, Fascículo 1: regiones Available online at: http://www.ebird.org [Accessed
fitogeográficas Argentinas. ACME, Buenos Aires. on June 17th 2020].
Calme, S., Desrochers, A., 1999. Nested bird and Faaborq, J., Holmes, R. T., Anders, A. D., Bildstein, K.
micro–habitat assemblages in a peatland archi- L., Dugger, K. M., Gauthreaux Jr., S. A., Heglund,
pelago. Oecologia, 118: 361–370. P., Hobson, K. A., Jahn, A.E., Johnson, D. H.,
Chao, A., Ma, K. H., Hsieh, T. C., 2016. iNEXT (iN- Latta, S. C., Levey, D. J., Marra, P. P., Merkord, C.
terpolation and EXTrapolation) Online: Software for L., Erica, N. O. L., Rothstein, S. I., Sherry, T. W.,
Interpolation and Extrapolation of Species Diversity. Scott Sillett, T., Thompson III, F. R., Warnock, N.,
Program and User’s Guide, http://chao.stat.nthu. 2010. Recent advances in understanding migra-
edu.tw/wordpress/software_download/ [Accessed tion systems of New World land birds. Ecological
on June 17th 2020] Monographs, 80: 3–48.
Coleman, B. D., 1981. On random placement and Feeley, K. J., Gillespie, T. W., Lebbin, D. J., Walter,
species–area relations. Mathematical Biosciences, H. S., 2007. Species characteristics associated
54: 191–215. with extinction vulnerability and nestedness ran-
Coleman, B. D., Mares, M. A., Willig, M. R., Hsieh, kings of birds in tropical forest fragments. Animal
Y.–H., 1982. Randomness, Area, and Species Conservation, 10: 493–501.
Richness. Ecology, 63: 1121–1133. Ferraz, G., Nichols, J. D., Hines, J. E., Stouffer, P.
Cook, W. M., Lane, K. T., Foster, B. L., Holt, R. D., C., Bierregaard, R. O., Lovejoy, T. E., 2007. A
2002. Island theory, matrix effects and species large–scale deforestation experiment: Effects of
richness patterns in habitat fragments. Ecology patch area and isolation on Amazon birds. Science,
Letters, 5: 619–623. 315: 238–241.
Cook, R. R., Quinn, J. F., 1995. The Influence of Co- Fischer, J., Lindenmayer, D. B., 2005. The sensitivity28 Dardanelli and Bellis of lizards to elevation: A case study from south– Geographic Isolation – a Case–Study. Ecology, eastern Australia. Diversity and Distributions, 11: 76: 458–465. 225–233. Keinath, D. A., Doak, D. F., Hodges, K. E., Prugh, L. Fleishman, E., Donnelly, R., Fay, J. P., Reeves, R., R., Fagan, W., Sekercioglu, C. H., Buchart, S. H. M., 2007. Applications of nestedness analyses to bio- Kauffman, M., 2017. A global analysis of traits pre- diversity conservation in developing landscapes. dicting species sensitivity to habitat fragmentation. Landscape and Urban Planning, 81: 271–281. Global Ecology and Biogeography, 26: 115–127. Frick, W. F., Hayes, J. P., Heady III, P. A., 2009. Lewis, J. P., Noetinger, S., Prado, D. E., Barberis, I. Nestedness of desert bat assemblages: species M., 2009. Woody vegetation structure and com- composition patterns in insular and terrestrial position of the last relicts of Espinal vegetation in landscapes. Oecologia, 158: 687–697. subtropical Argentina. Biodiversity and Conserva- Ganzhorn, J. U., Eisenbei, B., 2001. The the concept tion, 18: 3615–3628. of nested species assemblages and its utility for Li, C., Zhao, B., Wang, Y., 2019. Nestedness of wa- understanding effects of habitat fragmentation. terbird assemblages in the subsidence wetlands Basic and Applied Ecology, 2: 87–99. recently created by underground coal mining. García–Quintas, A., Parada, A., 2014. Effects of Current Zoology, 65: 155–163. migrations on the nestedness structure of bird Lindenmayer, D. B., Fischer, J., 2006. Habitat fragmen- assemblages in cays of the Jardines de la Reina tation and landscape change. CSIRO Publishing, archipelago, Cuba. Animal Biodiversity and Con- Collingwood VIC, Australia. servation, 37: 127–139. Loo, S. E., Mac Nally, R., Quinn, G. P., 2002. An expe- – 2017. Underlying factors promoting nestedness rimental examination of colonization as a generator of bird assemblages in cays of the Jardines de la of biotic nestedness. Oecologia, 132: 118–124. Reina archipelago, Cuba. Animal Biodiversity and Magurran, A., 2004. Measuring biological diversity. Conservation, 40: 7–16, https://doi.org/10.32800/ Blackwell, Oxford. abc.2017.40.0007 Martinez–Morales, M. A., 2005. Nested species as- González–Oreja, J. A., De La Fuente–Díaz, A. A., semblages as a tool to detect sensitivity to forest Hernández–Santín, L., Bonache–Regidor, C., fragmentation: the case of cloud forest birds. Oikos, Buzo–Franco, D., 2012. Can human disturbance 108: 634–642. promote nestedness? Songbirds and noise in ur- Matthews, T. J., Cottee–Jones, H. E. W., Whittaker, R. ban parks as a case study. Landscape and Urban J., 2015. Quantifying and interpreting nestedness Planning, 104: 9–18. in habitat islands: a synthetic analysis of multiple Grau, H. R., Aide, M., 2008. Globalization and land–use datasets. Diversity and Distributions, 21: 392–404. transitions in Latin America. Ecology and society, 13. McAbendroth, L., Foggo, A., Rundle, S. D., Bilton, Haddad, N. M., Brudvig, L. A., Clobert, J., Davies, K. D. T., 2005. Unravelling nestedness and spatial F., Gonzalez, A., Holt, R. D., Lovejoy, T. E., Sexton, pattern in pond assemblages. Journal of Animal J. O., Austin, M. P., Collins, C. D., 2015. Habitat Ecology, 74: 41–49. fragmentation and its lasting impact on Earth's Meyer, C. F., Kalko, E. K., 2008. Bat assemblages ecosystems. Science advances, 1: e1500052. on Neotropical land–bridge islands: nested subsets Henle, K., Lindenmayer, D. B., Margules, C. R., and null model analyses of species co–occurrence Saunders, D. A., Wissel, C., 2004. Species survival patterns. Diversity and Distributions, 14: 644–654. in fragmented landscapes: where are we now? Morello, J., Matteucci, S. D., Rodríguez, A. F. S., 2012. Biodiversity and Conservation, 13: 1–8. Ecorregiones y complejos ecosistémicos argenti- Hinsley, S. A., Bellamy, P. E., Newton, I., 1995. Bird nos, FADU. ed. FADU, Buenos Aires, Argentina. species turnover and stochastic extinction in wood- Murgui, E., 2010. Seasonal patterns of bird crop use land fragments. Ecography, 18: 41–50. in traditional irrigated land (The Huerta of Valencia, Honnay, O., Endels, P., Vereecken, H., Hermy, M., Spain). Ardeola, 57: 87–102. 1999. The role of patch area and habitat diversity Nores, M., 1996. Avifauna de la provincia de Córdo- in explaining native plant species richness in distur- ba. In: Biodiversidad de la Provincia de Córdoba: bed suburban forest patches in northern Belgium. 255–337 (E. di Tada, E. H. Bucher, Eds.). Universi- Diversity and Distributions, 5: 129–141. dad Nacional de Río Cuarto, Córdoba, Argentina. Isaaks, E. H., Srivastava R. M., 1989. Applied geos- Noy–Meir, I., Mascó, M., Giorgis, M. A., Gurvich, D. tatistics. Oxford University Press, New York, USA. E., Perazzolo, D., Ruiz, G., 2012. Estructura y di- Jahn, A.E., Bejarano, V., Cueto, V. R., Di Giacomo, versidad de dos fragmentos del bosque de espinal A. S., Fontana, C. S., 2017. Movement ecology re- en córdoba, un ecosistema amenazado. Boletín de search to advance conservation of South America’s la Sociedad Argentina de Botánica, 47: 119–133. grassland migratory birds. Perspectives in Ecology Nupp, T. E., Swihart, R. K., 2000. Landscape–level and Conservation, 15: 209–215. correlates of small–mammal assemblages in forest Jenkins, D. G., Brescacin, C. R., Duxbury, C. V., Elliott, fragments of farmland. Journal of Mammalogy, J. A., Evans, J. A., Grablow, K. R., Hillegass, M., 81: 512–526. Lyon, B. N., Metzger, G. A., Olandese, M. L., 2007. Patterson, B. D., Atmar, H., 1986. Nested subsets Does size matter for dispersal distance? Global and the structure of insular mammalian faunas Ecology and Biogeography, 16: 415–425. and archipelagos. Biological Journal of the Linnean Kadmon, R., 1995. Nested Species Subsets and Society, 28: 65–82.
Animal Biodiversity and Conservation 44.1 (2021)                                                                   29

R Core Team, 2016. R: A Language and Environ-                Ulrich, W., Gotelli, N. J., 2012. A null model algorithm
   ment for Statistical Computing. Vienna, Austria: R           for presence–absence matrices based on proportio-
   Foundation for Statistical Computing. Available at:          nal resampling. Ecological Modelling, 244: 20–27.
   https://www.R–project.org/                                Verga, E. G., Hümoller, H. L. S., Vergara–Tabares,
Remsen, J. V. J., Areta, J. I., Cadena, C. D., Jaramillo,       D. L., Galetto, L., Peluc, S. I., 2019. Importancia
   A., Nores, M., Pacheco, J. F., Pérez–Emán, J.,               para la conservación de las aves de un relicto de
   Robbins, C. S., Stiles, F. G., Stotz, D. F., Zimmer,         bosque en la región fitogeográfica del Espinal,
   K. J., 2020. A classification of the birds species of        Argentina. Neotropical Biology and Conservation,
   South America [WWW Document]. URL http://www.                14: 241–256.
   museum.lsu.edu/~Remsen/SACCBaseline.htm                   Wang, Y., Bao, Y., Yu, M., Xu, G., Ding, P., 2010.
Sala, O. E., Chapin, F. S., Armesto, J. J., Berlow,             Nestedness for different reasons: The distributions
   E., Bloomfield, J., Dirzo, R., Huber–Sanwald, E.,            of birds, lizards and small mammals on islands
   Huenneke, L. F., Jackson, R. B., Kinzig, A., 2000.           of an inundated lake. Diversity and Distributions,
   Global biodiversity scenarios for the year 2100.             16: 862–873.
   Science, 287: 1770–1774.                                  Wang, Y., Wang, X., Ding, P., 2012. Nestedness of
Salvador, S. A., Salvador, L., Ferrari, C., 2017. Aves de       snake assemblages on islands of an inundated
   la provincia de Córdoba, Argentina. Distribución e           lake. Current Zoology, 58: 828–36.
   historia natural. Docuprint, Buenos Aires, Argentina.     Watling, J. I., Donnelly, M. A., 2006. Fragments as
Santos, T., Tellería, J. L., Carbonell, R., 2002. Bird          Islands: a Synthesis of Faunal Responses to
   conservation in fragmented Mediterranean forests             Habitat Patchiness. Conservation Biology, 20:
   of Spain: Effects of geographical location, habitat          1016–1025.
   and landscape degradation. Biological Conserva-           Watson, D. M., 2003. Long–term consequences of
   tion, 105: 113–125.                                          habitat fragmentation – Highland birds in Oaxaca,
Schoener, A., Schoener, T. W., 1984. Experiments on             Mexico. Biological Conservation, 111: 283–303.
   dispersal: short–term floatation of insular anoles,       Watson, J. E. M., Whittaker, R. J., Dawson, T. P.,
   with a review of similar abilities in other terrestrial      2004. Avifaunal responses to habitat fragmenta-
   animals. Oecologia, 63: 289–294.                             tion in the threatened littoral forests of southeas-
Seoane, J., Villén–Pérez, S., Carrascal, L. M., 2013.           tern Madagascar. Journal of Biogeography, 31:
   Environmental determinants of seasonal changes               1791–1807.
   in bird diversity of Mediterranean Oakwoods. Eco-         Wilcove, D. S., Rothstein, D., Dubow, J., Phillips, A.,
   logical Research, 28: 435–445.                               Losos, E., 1998. Quantifying threats to imperiled spe-
Si, X., Baselga, A., Ding, P., 2015. Revealing beta–            cies in the United States. Bioscience, 48: 607–615.
   diversity patterns of breeding bird and lizard            Wilcox, B.A., Murphy, D. D., Elrich, P. R., Austin, G.
   communities on inundated land–bridge islands by              T., 1986. Insular biogeography of the montane
   separating the turnover and nestedness compo-                butterfly faunas in the Great Basin: comparison
   nents. PloS one, 10: e0127692.                               with birds and mammals. Oecologia, 69: 188–194.
Soga, M., Koike, S., 2012. Relative Importance of            Wright, D. H., Patterson, B. D., Mikkelson, G. M.,
   Quantity, Quality and Isolation of Patches for               Cutler, A., Atmar, W., 1998. A comparative analysis
   Butterfly Diversity in Fragmented Urban Forests.             of nested subset patterns of species composition.
   Ecological Research, 27: 265–271.                            Oecologia, 113: 1–20.
Strona, G., Fattorini, S., 2014. On the methods to as-       Zak, M. R., Cabido, M., Cáceres, D., Díaz, S., 2008.
   sess significance in nestedness analyses. Theory             What drives accelerated land cover change in
   in Biosciences, 133: 179–186.                                central Argentina? Synergistic consequences of
Strona, G., Galli, P., Seveso, D., Montano, S., Fattorini,      climatic, socioeconomic, and technological factors.
   S., others, 2014. Nestedness for Dummies (NeD): a            Environmental Management, 42: 181–189.
   user friendly web interface for exploratory nestedness    Zhou, D., Chu, L.M., 2014. Do avian communities
   analysis. Journal of Statistical Software, 59: 1–9.          vary with season in highly urbanized Hong Kong?
Ulrich, W., Almeida–Neto, M., Gotelli, N. J., 2009. A           The Wilson Journal of Ornithology, 126: 69–80.
   consumer’s guide to nestedness analysis. Oikos,           Zotta, A., 1940. Lista sobre el contenido estomacal de
   118: 3–17.                                                   las aves argentinas. Hornero, 7: 402–411.
You can also read