Deep-learning coupled with novel classification method to classify the urban environment of the developing world - arXiv.org
←
→
Page content transcription
If your browser does not render page correctly, please read the page content below
Deep-learning coupled with novel
                                             classification method to classify the urban
                                                environment of the developing world

                                         ? QianweiCheng1 , ? AKM Mahbubur Rahman2,3 Anis Sarker2 , Abu Bakar Siddik
                                        Nayem2 , Ovi Paul2 , Amin Ahsan Ali2,3 , M Ashraful Amin2,3 , Ryosuke Shibasaki1 ,
arXiv:2011.12847v2 [cs.CV] 7 Jan 2021

                                                                    and ? Moinul Zaber3,4,5
                                                                 1
                                                                 The University of Tokyo, Tokyo, Japan
                                                    2  The Independent University Bangladesh, Dhaka, Bangladesh
                                                           3 The Data and Design Lab, Dhaka, Bangladesh
                                                              4 University of Dhaka, Dhaka Bangladesh
                                             5   United Nations University, E-government Operating Unit (UNU-EGOV),
                                                                         Guimarães, Portugal

                                        Abstract. Rapid globalization and the interdependence of the countries have engendered tremen-
                                        dous in-flow of human migration towards the urban spaces. With the advent of high definition
                                        satellite images, high-resolution data, computational methods such as deep neural network analy-
                                        sis, and hardware capable of high-speed analysis; urban planning is seeing a paradigm shift. Legacy
                                        data on urban environments are now being complemented with high-volume, high-frequency data.
                                        However, the first step of understanding the urban area lies in the useful classification of the urban
                                        environment that is usable for data collection, analysis, and visualization. In this paper, we propose
                                        a novel classification method that is readily usable for machine analysis and it shows the appli-
                                        cability of the methodology in a developing world setting. However, the state-of-the-art is mostly
                                        dominated by the classification of building structures, building types, etc., and largely represents
                                        the developed world. Hence, these methods and models are not sufficient for developing countries
                                        such as Bangladesh where the surrounding environment is crucial for the classification. Moreover,
                                        the traditional classifications propose small-scale classifications, which give limited information,
                                        have poor scalability and are slow to compute in real-time. We categorize the urban area in terms
                                        of informal and formal spaces and take the surrounding environment into account. 50 km × 50 km
                                        Google Earth image of Dhaka, Bangladesh was visually annotated and categorized by an expert
                                        and consequently, a map was drawn. The classification is based broadly on two dimensions the
                                        state of urbanization and the architectural form of the urban environment. Consequently, the ur-
                                        ban space is divided into four classifications: 1) highly informal area 2) moderately informal area
                                        3) moderately formal area and 4) highly formal area. For semantic segmentation and automatic
                                        classification, Google’s DeeplabV3+ model was used. The model uses the Atrous convolution op-
                                        eration to analyze different layers of texture and shape. This allows us to enlarge the field of view
                                        of the filters to incorporate a larger context. Image encompassing 70% of the urban space was used
                                        to train the model and the remaining 30% was used for testing and validation. The model can
                                        segment with 75% accuracy and 60% Mean Intersection over Union (mIoU).

                                        Keywords: Remote Sensing, Satellite Image, Building classification, Urban Environment, Deep
                                        Learning, Semantic Segmentation, Urban Planning, Socio-economic situation, Poverty Estimation.
                                        ?
                                            Equal contribution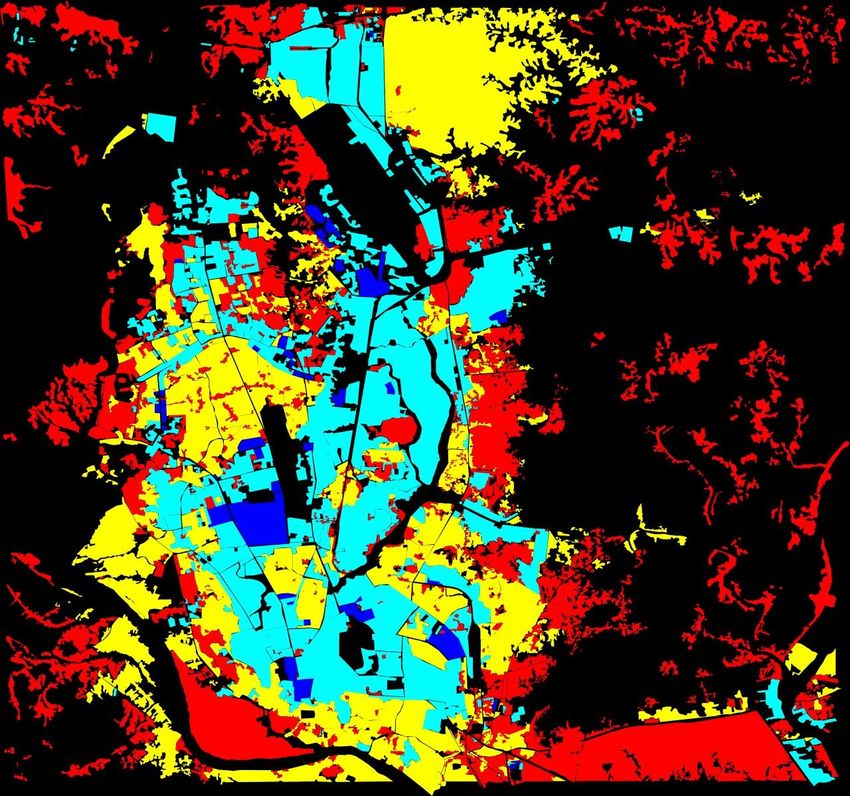
1   Introduction

Rapid globalization has engendered a large number of people in-flow into cities.
More than 50% of the global population lives in urban areas, especially in develop-
ing countries. Therefore, the sustainable development goals of the United Nations
emphasize the demand for information about the physical environment of urban
cities [1]. Categorizing the urban area is a fundamental component of any decision
making process for any kind of urban development. Classification of the urban build-
ing structures offers several benefits for the policymakers. For example, by pointing
out the educational institutes, we can understand people’s access to education in
that specific area [2]. With building classifications mapped to the geo-spatial area,
new educational institutions might be proposed in the desired area. Additionally,
distinguishing industrial area from residential areas can help the planners to build
infrastructures to manage industry wastes, water pollution, and air pollution [3].
    The spatial structure and pattern of the urban environment are diverse and
complex[4]. However, most of the early studies on urban classification were based
on a single dimension: structural characteristics: the types and conditions of indi-
vidual buildings, and building density, building height, building scale, or physical
site characteristics. Many pieces of research are devoted to the analysis of cities on a
spatial scale. For example, Herold et al.[5] combine satellite images with urban spa-
tial scales to simulate urban growth and land-use change. Huang et al.[6] calculated
7 spatial metrics by using the satellite images of 77 cities and obtained 5 different
properties of urban morphology: complexity, centrality, compactness, porosity, and
density respectively.
    A good number of studies have used deep learning to categorize urban areas
from satellite images. Oshri et.al.[7] used Afrobarometer [8] survey data along with
satellite images from Sentinel 1 and Landsat 8 to assess the environmental quality
in Africa. They have also used OpenStreetMap. They have used deep learning
technology to identify the presence of different infrastructures such as electricity,
sewerage, piped water, and road. They have categorized the habitat environment
by identifying the above-mentioned structures.
    Neal et al. [9] have used Convolutional Neural Networks (CNNs) to analyze
satellite images for luminosity at night (“nightlights”) to estimate economic activity
in different areas. Then they have predicted the poverty levels in the targeted
area from the estimated economic activities. Piaggesi et al. used [10] a pre-trained
fully convolutional variant of VGG, fine-tuned with nightlights intensity levels,
baseline VGG and Resnet-50 initialized with ImageNet were used to predict income
of each household. However, very few researches have performed automatic building
classification based on the buildings and their surrounding environments. Manual
classification of a small area has been performed in urban research. But it is not
scalable for a large metropolitan city like Dhaka. Therefore, we propose a novel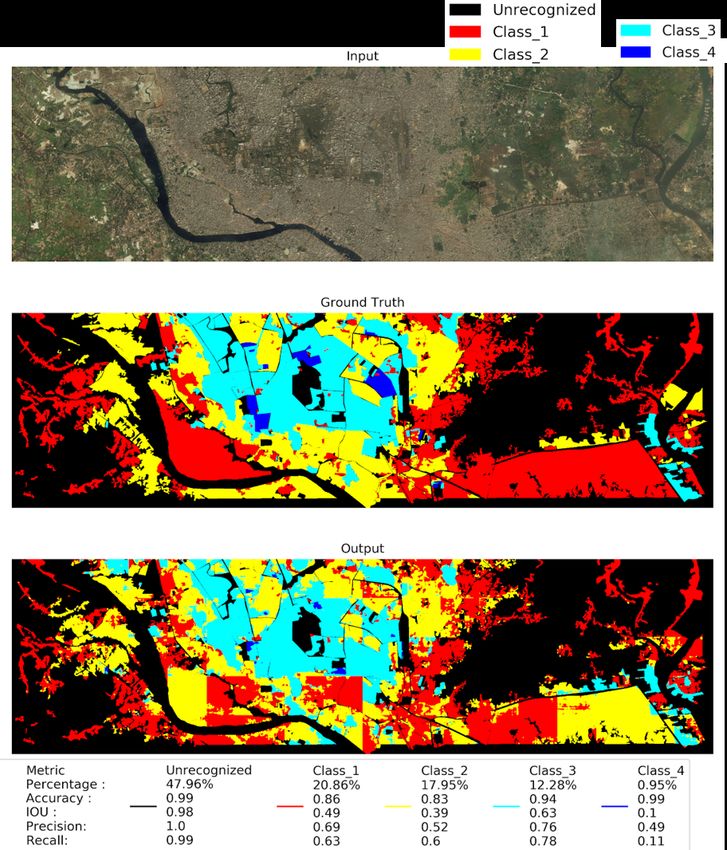
classification and deep learning method for automatic semantic segmentation of
the geospatial images of the city.
    In the early study of the classification model, researchers considered the context
of developed countries that is not suitable for developing countries. Moreover, in
the study of those urban classifications, the surrounding environment and building
structure are not considered together. But in many developing countries with com-
plex urban issues, apart from complex land ownership, urbanization and buildings
are also multifaceted. The building structure is often closely related to the sur-
rounding environment.
In this study, we have designed a method to classify the urban environments. This
classification has the following advantages:
1. It sets up the urbanization process and architectural form as two different axes
   instead of a single index. Then the physical environment of the city is divided
   into 16 classifications. Through this classification method, all kinds of urban
   environmental forms can be summarized.
2. Through manual operation, a large number of high-precision urban classification
   data are obtained that makes the deep learning possible.
3. The scale of this study is large (more than 20 km × 20 km, less than 50 km × 50 km).
   Previous studies were limited to small-scale classification, poor scalability, and
   inability to provide a large amount of information.
     Because of its large scale, this classification method can be used to compare
the level of cities with the data of topography, area, population density, income,
education, etc. as the basis of urban geography and urban poverty research. One
can complete a morphological catalog or even a list of global cities. The method of
visual recognition is used to detect and classify the physical environment of many
cities and draw the map, and then the deep learning algorithm is used to train
the map data set. Then, we use the trained deep learning algorithm to identify the
building classifications in the unseen test data. Particularly we have developed a
transfer learning method to semantically segment the satellite image of Dhaka city
into four different urban areas automatically. The areas are segmented based on
the buildings and their environment. Specifically, we have used a transfer learning
method to categorize the area into 1) highly informal area; 2) moderately informal
area; 3) moderately formal area and 4) highly formal area. Unlike other urban clas-
sification models, we propose the novel urban classification technique that includes
the buildings as well as their surrounding environment. Actually, the texture and
shape differences among various building structures are present in the satellite im-
ages. These textures and shapes can be learned by the state of the art deep learning
models. Consequently, the deep learning models would be able to capture the tex-
ture and shape differences and can segment the satellite images according to the
proposed classifications. In this paper, we have used google’s Deeplabv3+ model.
The model has been trained with 70% area of the Dhaka city and tested on the rest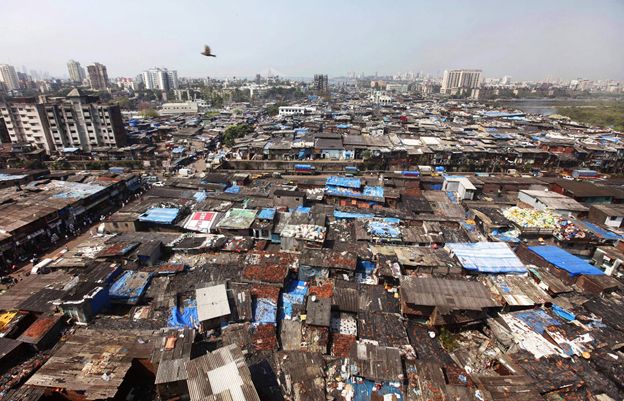
30% area. The DeepLabv3+ model has used convolutional operations to analyze
the textures and shapes in various scales. Therefore our contribution includes 1)
Novel urban classification, 2) Segmentation with Deep Learning.
    In the next section, we discuss the theoretical background of the urban building
classification and deep learning-based automatic methods. Then we describe our
novel classification model with sufficient examples. In the fourth section, we discuss
the deep learning method to semantically categorize the building classifications
automatically from satellite images. Then in the fifth section, we have presented
our results followed by the conclusion.

2     Research Background

2.1    Urban Area

Global economic, social, and political circumstances have transformed the urban
and rural in such a way that it has become very difficult to define urban and
rural area in a distinguishable way. However, here, we intend to define the urban-
rural area in the context of Bangladesh. An urban area can be defined based on
population density, the concentration of administrative bodies, infrastructure, and
a diverse set of livelihood and income generation activities. Additionally, urban
areas must be characterized by high population density when compared to other
areas. In an urban setting, the forms of livelihood and income generation activities
will be diverse and unlike rural areas not bound mainly to agricultural production
[11]. Some cities might be defined by municipal boundaries. But many of the urban
areas are usually characterized by the presence of administrative structures such
as government offices and courts and a relative concentration of services such as
hospitals and financial institutions such as banks.

Urban area of the developing world Urbanization, generally, refers to an in-
creasing shift from agrarian to industrial services and distributive occupations. 50%
of the world’s population lives in urban areas, and this proportion is expected to in-
crease to 68% by 2050. By 2050, the increase in world population may add another
2.5 billion people to urban areas [59]. For example, between 2003 and 2010, the
city of Hyderabad in India experienced a 70% increase in slum areas [12]. Unfor-
tunately, the situation is not unique to India or the global south. UN estimations
show that the global slum population is around one billion at present and may
rise to two billion by 2030 (UN Habitat Report 2016[13]). In developing countries
therefore understanding the socio-economic condition of different regions of a city
can be assisted by the identification of different formal and informal settlements.
Therefore, there has been a lot of focus on the identification and mapping of urban
areas of a city.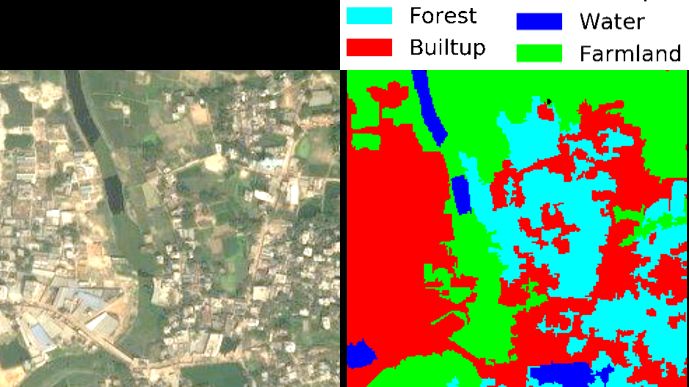
Urban area in Bangladesh In 2019, the urban population for Bangladesh was
37.4%. The urban population of Bangladesh increased from 7.6% in 1970 to 37.4%
in 2019 growing at an average annual rate of 3.33% [14]. The trend of present urban-
ization poses a huge challenge for the sustainable metropolitan city in Bangladesh
[11]. The infrastructural services, basic amenities, and environmental goods, envi-
ronmental degradation, extensive traffic and accidents, violence, and socioeconomic
insecurity are the major challenges for the city. Generally, these challenges are very
common in highly informal and moderately informal areas. Distinguishing these
areas from the formal area on a large scale is the major challenge for a mega city
like Dhaka.

              Fig. 1. The morphological appearance of the urban environment

Urban environment classification In the urban environment, different regions
have different classifications (Figure 1). They are composed of different physical ap-
pearances, such as green spaces, artificially constructed and naturally formed roads;
regular, random, complex and dense buildings, etc. The study of urban morphology
classification can provide important reference for the evolution and boundary divi-
sion of historical regions, and provide in-depth understanding and training for the
practical application fields closely related to urban development, planning, architec-
ture, urban management, public policy, etc. Barke et al. [15] approach understand-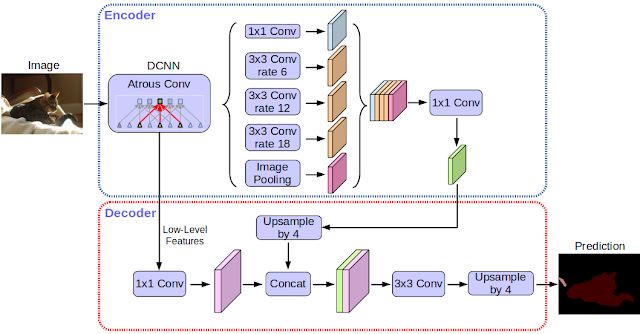
ing urban form and its complexity, linking urban form parameters with its spatial
performance, is an important way for a city to develop well. Kärrholm et al. [16]
and many other authors point out the importance of understanding urban morphol-
ogy as a key element of urban sustainable development. Kevin Lynch’s redefined
urban environment includes a spatial relationship of urban physical characteristics
(natural physical form, established physical form) [17]. Since the 1990s, with the
development of geographic information system, more and more people understand
the complexity of the urban environment from a comprehensive perspective.
    In the urban environment, a consensus is there on the core basic elements of the
form of solid buildings: streets, plots, buildings, etc. Urban form can combine design,
shape, and clarity from the courtyard to cluster scale. In the methods of urban
morphology topology and historical geography, the concept of composition level,
which focuses on specific aspects of architectural form, has been fully developed
[18]. Jwr whitehand extends Conzen’s theory and establishes a historical geographic
approach [19]. Urban classification is the classification of three core elements of
streets, plots, and buildings in a complex urban environment [20]. In general, the
type and conditions of individual buildings [21] and the spatial layout of these
buildings [22] define the urban environment. ISA baud et al. [23] used physical
indicators: layout structure, building density, building scale, and other physical site
characteristics, the building types are divided into four classifications. According to
Taubenbóck et al. [20], firstly, cities are classified according to the physical density of
buildings. Then, in the study of the classification and characteristics of settlement
form, the characteristics of settlement form of five cities are extracted from the
three core elements of building density, building orientation, heterogeneity index,
building scale, and height. Finally, the five cities are divided into nine classifications.
Slums, similar to slums, mixed unstructured and unstructured communities, mixed
structured and unstructured communities, and structured and formally planned
communities [4].

2.2   Machine Learning for understanding Satellite image
There are hundreds of Earth observation satellites providing data at different spec-
tral, spatial, and temporal resolution. ERS 1 and 2, Sentinel 1 and 2 satellites
launched by European Space Agency (ESA), Landsat 1-8 satellites maintained now
by US National Oceanic and Atmospheric Administration (NOAA) have been pro-
viding satellite data for free and have initiated research in this field. Commercial
satellites such as IKONOS, RapidEye, and WorldView 1-4 provide higher spatial
(∼5 meter/pixel) resolution) satellite imagery compared to that of Landsat and
Sentinel (tens to hundreds of meters). The resolution means the actual ground
distance (in meter) that has been sampled by one pixel. It is also called ground
sampling distance. Microsoft corporation has launched a couple of satellites (Bing
Satellites) to provide remote imagery with high resolution (2.22meter/pixel).
As these high-quality images have visual channels (RGB), researchers apply
spatial filters to analyze the textures and shapes of the satellite images to identify
forests, water, buildings, farmlands, and meadows. In [24], the authors proposed
a novel feature-extraction block extract spatial context of each pixel according to
a complete hierarchical multilevel representation of the scene. Then they classify
the features with SVM. Cheng et al. [25] discuss traditional features such as his-
togram of ordered gradients(HOG), scale-invariant feature transform(SIFT), color
histograms(CH), and local binary patterns(LBP) etc. Researchers use these fea-
tures to segment the satellite images for different land covers by exploiting the
support vector machine(SVM). However, due to the high volume, heterogeneity of
satellite data, nowadays, deep learning methods are getting more preference over
traditional manual or statistical methods to explore these data sets [26],[27]. These
methods have been instrumental to explore such data within reasonable time and
cost. Deep learning methods show excellent performance in classifications, image
segmentation, as well as semantic segmentation [28]. The emergence of deep nets
also help segmenting high-resolution satellite images.
2.3 Semantic Segmentation for building classification
Fig. 2. a. Satellite image b. Land use land cover segmented image
Semantic segmentation on satellite data: Satellite images have multiple
channels including the visual ones: red, green, and blue (RGB). The RGB image has
the texture and shape information of the ground. Since texture and shapes can be
captured by deep learning-based semantic segmentation, remote sensing researcherstry to segment specific areas based on different classification tasks. Therefore, they
have approached remote sensing tasks through the use of deep learning methods.
The classification tasks might range from land use land class to slum detection,
from tracking urban expansion to tracking forest degradation, etc.
Semantic segmentation for urban environment development: More re-
cently, machine learning-based automated analysis of satellite imagery has been
used to understand human socio-economic conditions at a local (city, village, or
country level) as well as global level. Both deep learning methods (e.g., Convolu-
tional Neural Networks (CNN)) and shallow learning methods (e.g., Support vec-
tor machines and Random Forests) are being extensively used in predicting socio-
economic indicators using daytime optical satellite imagery, radar data, and Night
Time Light (NTL) emission captured by satellite sensors. However, to train such
models one needs both large quantities of satellite images, as well as non-satellite
data from different sources such as census, household and agricultural surveys, ad-
ministrative data, and other environmental and meteorological data [29]. Machine
learning methods have been used to estimate crop yields [30], land cover and land
cover changes [27], slum detection [31], mapping urban growth predicting and map-
ping poverty [32], population estimation [33], estimation of GDP etc.
Authors in [29] provides a comprehensive review of the potential use of earth
observation data (both satellite and aerial imagery) to estimate socio-economic in-
dicators set by the UN’s Sustainable Development Goals and the ‘proxy’ indicators.
In the following we discuss the major directions that research has been conducted
in this field of study, focusing on Bangladesh’s context. Various CNN’s have been
used to classify land use and land cover in many different types of satellite image
datasets[UC Merced [34], OSM Land Use Data, Climate Change Initiative (CCI)
[35], Global Land Survey etc.] in addition with other tabular and/or temporal data.
Oshri et.al. [7] used Afrobarometer [8] survey data along with satellite images from
Sentinel 1 and Landsat 8 to assess infrastructure quality in Africa. They propose
multi-channel inputs that utilize all available channels from respective satellites in-
stead of using only the RGB bands. Pretrained Imagenet weights have been used
for the RGB channel and the novel channels are initialized with Xavier Initializa-
tion. A Residual Network based architecture (ResNet101) has been used with some
minor modifications in their work which achieves better classification performance
than Nightlights [36] based works, OSM, and some other baseline methods. While
predicting poverty from satellite image as a socio-economic indicator of city ar-
eas, images from DigitalGlobe[37] platform and the google maps have been used
as input imagery where the spatial resolution used was .5 m/pixel and 2.5 m/pixel
respectively [10]. A pretrained fully convolutional variant of VGG fine tuned with
nightlights intensity labels, baseline VGG and Resnet-50 initialized with ImageNet
has been used to predict income of each household. The ground truth data has
been produced from EOD (Encuesta Origen Destino de Viajes), a mobility surveyrealized from July 2012 to November 2013 by assignment of the Chilean Ministry of
Transport and Telecommunications[38]. Resnet-50 performed better overall yielding
slightly better accuracy.
3 Detail Description of Novel urban classification
It is generally accepted that urban areas and buildings are the basic types for
analyzing urban forms.Frey et al. have pointed out that the structure and form
of traditional cities developed slowly and gradually without formal planning and
design. Marshall [39]) also pointed out that the physical characteristics of streets,
plots, and buildings are different. An important part of seeking to understand how
cities develop and evolve is to determine the specific combination of these elements.
In ordinary human settlement planning, roads and blocks are planned first, and then
buildings are constructed according to the divided blocks. On the other hand, in
unplanned areas, buildings are planned first, and then the streets are planned.
But the formation of towns is not limited to these two modes. There are two
other more mixed modes, in which unplanned buildings are built in the planned
road network, and then roads naturally appear in this unplanned building group;
Construct planned buildings in areas where the road network is not planned.
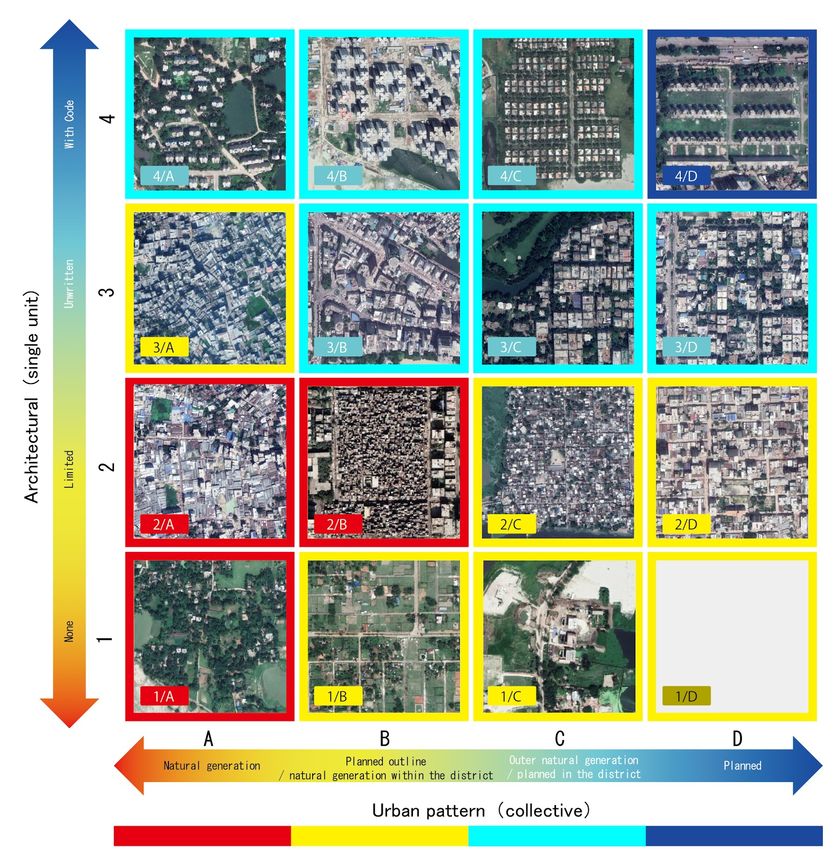
Based on the concept mentioned above, in this study, the physical environment
of the city is classified by two indicators: diversity of buildings and street patterns
(aggregate). The diversity of buildings is expressed as a single building, and it is
divided into four categories. The fully planned buildings which in the same code are
defined as “with code”, and the number is marked (4); Untyped buildings are de-
fined as “unwritten”, and the number is marked (3), It is usually expressed in histor-
ical buildings, old blocks, factories, public buildings, etc; The use of cheap materials,
inferior buildings with technical and economic constraints, and self-construction are
defined as “limited”, and the number is marked (2); High-quality housing in the
suburbs and rural buildings, which have no technical, economic, or social restric-
tions, are defined as “none” and marked as a number (1). Building types with codes
and unwritten rules are relatively easy to distinguish, but the criteria for distin-
guishing building types with technical and economic constraints are not designed
according to a prescribed layout. While its form looks random, it uses temporary,
irregular, and diverse building materials. And these forms of buildings are land-risk
slopes, lowlands, along rivers, around industrial areas may be identified. A type of
“none” indicates a state when a building type having technical and economic con-
straints is free from the limitation. For another indicator, street mode (collection),
the planned street network is defined as “planned” and marked with a letter (D);
naturally generated roads are defined as “natural generation” and marked with a
letter (A); in addition, According to the regularity of the street pattern, the outside
is the planned street network, and the inside is the naturally generated road net-
work. The type is defined as “planned outline + local natural generation”, markedFig. 3. Urban environment topology
with the letter (B); the external road network is natural Generated, the planned
type of the internal road network is defined as “Outer natural generation + Planned
in the district”, marked with a letter (C).
    After that, the four types of indicators “diversity of buildings” (marked with
numbers 1, 2, 3, and 4 from the bottom of the vertical axis) and the four types of
indicators “street patterns” (marked on the left side of the horizontal axis as The
combination of letters A, B, C, D), the combination of two indicators forms a total
of 16 types. The obtained matrix is used as a standard criterion for categorizing
every urban area with a scale of 400 m×400 m. According to this classification
method, we classify the urban environment of Dhaka City, Bangladesh(Figure 3).
    In cities in developing countries, it is often possible to distinguish between for-
mal areas characterized by appropriate spatial planning and facilities (buildings,
green space, road infrastructure) and informal areas without urban development.
Informal areas are usually composed of irregular and restricted buildings, located
near dangerous land, industry, garbage, swamps, and flood-prone areas [60].
    Considering the relationship between urban environment type and formal/informal
degree, three types of 2/A, 2/B and 1/A located at the lower-left pole are the street
pattern of “natural generation (A)”. Alternatively, it is inferred that the street pat-
tern of “planned outline + natural generation in the district (B)” contains “limited
(3)” buildings, and the degree of formalness is extremely high. This classify was
Color1. At the top right pole is a 4/D where the same street is lined with buildings
with the same code on the planned street. The remaining 12 types are assumed
to be informal degrees, and the 1/B, 1/C, 1/D, 2/C, 2/D, and 3/A groups are
indicated by Color2. The 3/B, 3/C, 3/D, 4/A, 4/B, and 4/C groups were referred
to as Color 3 below and were classified into four types of urban environment types.
The selection colors of urban environment topology is shown in Table 1.

                Table 1. Selection of colors for urban environment topology

                      Urban Environment
                                          Classification    Color
                           Topology
                             Red
                                         Highly Informal
                        (1/A.2/A.2/B)
                       Yellow(1/B.1/C.
                                        Moderately Informal
                      1/D.2/C.2/D.3/A)
                        Cyan(3/B.3/C.
                                        Moderately Formal
                      3/D.4/A.4/B.4/C)
                             Blue
                                          Highly Formal
                            (4/D)
Fig. 4. Input Satellite image for Dhaka city - Source: BING satellite imagery
4 Automatic Building-classification using Deep Learning
4.1 Data Collection, Annotation and Preprocessing
We use the freely available Bing satellite imagery for our building classification
task. The Microsoft Corporation provides high-resolution imagery for public uses
from the Bing satellites. Satellite image of the Dhaka metropolitan area has been
downloaded at a zoom level of 17 which has a spatial resolution of 2.26 m/pixel.
Even though the city administrative boundaries are not of a perfect rectangular
shape, we produce an estimated rectangular shapefile of Dhaka city by using its
respective administrative shapefile for the sake of simplified grid preprocessing.
Images are downloaded with geolocation metadata so that further analysis by geo-
referencing can be done later. ArcMap GIS Software has been used to superimpose
the shapefile of rectangular boundary and crop the region of interest from down-
loaded image(Figure 4) and the ground truth(Figure 5) image respectively.
It can be seen from the ground truth of Dhaka, that the boundaries of most
informal areas are quite obvious, usually in the forms of segmented patches orclusters, rather than continuous areas. They are mainly distributed near rivers, lakes and other waters, around airports, and at the junction of urban and rural areas. But there are also informal areas in densely populated urban areas where commercial and residential communities live. There are large formal areas near Ramna Thana and Lalmatia. Fig. 5. Ground truth for building classification. Red: Highly informal area (Arrival city); Green: Moderate Informal Area; Cyan: Moderate Formal Area; Blue: Highly Formal Area ; Black: Unrec- ognized Area 4.2 DeepLabV3+ for semantic segmentation DeepLabV3+(Figure 6) is the state of the art model for semantic segmentation. This model has some unique modules that would help efficient and correct segmen- tation of satellite images. It uses ImageNet’s pre-trained ResNet-101 with atrous convolutions as its main feature extractor. In the modified ResNet model, the last ResNet block uses atrous convolutions with different dilation rates. Atrous con- volution with different dilation rate enables the model to extract image features
in different scales. Moreover, it uses Atrous Spatial Pyramid Pooling (ASPP)and
bilinear upsampling for the decoder module on top of the modified ResNet block.
ASPP helps the model to see satellite images from a different point of view. Ana-
lyzing the satellite images from a different view is crucial for good segmentation.
ASPP helps the DeepLabV3+ model to extract features from different levels: rang-
ing from very low-level pixel data to high-level contextual information. Therefore,
the ASPP is the major contributing module to our semantic segmentation.

                          Fig. 6. Architecture of DeeplabV3+

    The overall architecture has two main modules: encoder and decoder. The en-
coder is based on an output stride (ratio of the original image size to the size of
the final encoded features) of 16. In the encoder, the ResNet 101 convolution layers
are used. Moreover, the ASPP has been exploited in the encoder to fuse features in
different scales. In the decoder, instead of using bilinear upsampling with a factor
of 16, the encoded features are first upsampled with a factor of 4 and concate-
nated with corresponding low-level features from the encoder module having the
same spatial dimensions. In the decoder, before concatenating, 1×1 convolutions
are applied on the low-level features to reduce the number of channels. After con-
catenation, a few 3×3 convolutions are applied and the features are upsampled by
a factor of 4. This gives the output of the same size as that of the input image.
4.3 Creating training data with 70% overlap
The convolution layers of the DeeplabV3+ are pre-trained with Imagenet. However,
the Imagenet is the data-set of objects. In order to use the model for satellite image
segmentation, we need to fine-tune the model weights by applying the sufficient
training set.
Therefore, we split the ground truth and the input image into two parts. One
part for the training and the other for the testing. The training part consists of
the 70% of the Dhaka image that includes the upper part of the Dhaka city. Now
before feeding the image into the network, some required pre-processing of the data
is needed.
In the first step, both the input image and its target image needs to be grid into
513×513 because this is the required width and height to feed into DeepLabV3+.
But this grid will be done using 70% overlap of the previous image. This 70%
overlap grid will be done both vertically and horizontally. The reason for overlapping
is to increase the training data. Doing the overlap increases the data drastically.
Afterward, mapping of the input image is done using the ground truth image data.
Mapping the unrecognized image helps to prevent misclassification, we projected
the unrecognized part on the input image. This will now classify the black region
as only unrecognized. After all the pre-processing is done, the images are feed into
the DeepLabV3+.
4.4 Training Procedure
Training When the training data are ready we feed those data into the model. The
model that we used in our training is DeeplabV3+. We used resnet[40] and xception
[41] as backbone. First, the model takes an image as input where the dimension is
513 × 513 × 3. It goes into the backbone where the batch normalization is done. The
image data then downsampled with respect to the given strides and dilations. Then
the output of the backbone is fed to the aspp where the atrous convolution happens.
We used 4 aspp modules and the output is pooled by global average pooling at the
end of the aspp which is later interpolated in bilinear interpolation and sent to
the decoder part. From the encoder part, aspp sends the low-level features to the
decoder by doing 1 × 1 convolution and backbone sends the output and these two
are concatenated. Later the images are upsampled.
Hyperparameters Then we calculate weights over the total number of classes for
balancing the class weights. We used Stochastic Gradient Descent (SGD) as our
optimizer. We have 5 classes in our training dataset. We train the model with a
learning rate of 0.007, the number of epochs 26.4.5 Testing Procedure
For the test data, we use the lower 30% of the original image as shown in Figure
4. The same method of pre-processing is done but in this case, during grid, no
overlapping of the image is done since it would be only used for testing.
After the testing is done, DeepLabV3+ generates output images. Those output
images are later converted to RGB images for both calculation and visual repre-
sentation. All the images are then stitched back to their original dimension.
Both the output image and ground truth image are used to generate a confusion
matrix. This matrix is used to generate results.
Calculating the confusion matrix gives us the accurate accuracy of our clas-
sification model whether it is getting right and the types of errors it is making.
We compare this output image with our original ground truth image, in this case,
we use the pixel by pixel accuracy which is known as pixel-wise classification. We
use a confusion matrix to describe the performance of the model and derive other
performance metrics from it.
Accuracy: Accuracy is calculated by summing the number of correctly classified
pixel values and divided by the total number of pixel values.
IoU : IoU is calculated by dividing the area of overlap by the area of union.
We compute the area of overlap in the numerator and the area of union in the
denominator.
Recall: Recall is a measure of completeness; what percentage of positive pixels
are predicted as such.
Precision: Precision is the measure of exactness; what percentage of pixels are
predicted as such.
The equation of these measurements given below:
tp+tn
– Accuracy: tp+tn+f p+f n
target ∩ prediction
– IoU score: target ∪ prediction
tp
– Recall: tp+f n
tp
– Precision: tp+f p
where tp = true positive, tn = true negative, fp = false positive, and fn = false
negative.
5 Result
Figure 7 shows the performance of the segmentation. The top sub-image is the test
image that has been used as the input to the trained model. The bottom imageFig. 7. Top: Test image, Middle: Ground truth, Bottom: Predicted output - Testing with 30%
bottom part of Dhaka
is the output from the segmentation model. The middle one is the ground truth
image where different colors represent different building classifications.
It can be easily noticed that the model can segment the Highly informal area
(Class-1) with 86% accuracy. The precision and recall are also very high. We can
also see that the Highly Formal area has also 99% accuracy. Moderately Informalarea (Class-2) is a little bit difficult and error-prone compared to other classes. In
contrast, moderately formal areas can be segmented effectively with 94% accuracy
with reasonable precision and recall. Therefore, the deep learning model can cat-
egorize urban areas with an average of 90.5%. So, the automatic classification by
the deep learning model facilitates large scale classification over different cities in
developing countries.
6 Conclusion
In this study, we have classified the urban environment into 16 classes using a novel
method. The method classifies an urban space using two axes of architectural form
and urbanization process and mapped a large range (50 km ×50 km) of urban envi-
ronment based on satellite images incorporating human visual recognition method.
Deep learning method is used to automate the entire classification process. This
classification method allows us to match spatial knowledge with urban location
information of possible locations, combine topography, area, population density,
income, and education data, and adopt a more systematic and consistent method
to locate the urban population globally. For semantic segmentation and automatic
classification, we have used Google’s DeeplabV3+. satellite image encompassing
70% of the urban Dhaka was used to train the model and the remaining 30% was
used for testing. We observe that the segmentation model can segment with 75%
accuracy and 60% Mean Intersection over Union (mIoU). Our proposed methods
should be a valuable contribution to urban geography and urban poverty research
and pave the way to conduct a cost-effective computational approach to conduct a
morphological catalog of the global urban environment.
Acknowledgment
This paper is a result of the project ”SmartEGOV: Harnessing EGOV for Smart
Governance (Foundations, methods, Tools) / NORTE-01-0145-FEDER-000037”,
supported by Norte Portugal Regional Operational Programme (NORTE 2020),
under the PORTUGAL 2020 Partnership Agreement, through the European Re-
gional Development Fund (EFDR). It was also partially funded by ICT Division of
ICT Ministry, Bangladesh.
References
1. . United nations,transforming our world: The 2030 agenda for sustainable development. tech-
nical report. , 2015.
2. I. Tingzon, A. Orden, K. Go, S. Sy, V. Sekara, Ingmar Weber, M. Fatehkia, Manuel Garcı́a-
Herranz, and D. Kim. Mapping poverty in the philippines using machine learning, satellite
imagery, and crowd-sourced geospatial information. ISPRS - International Archives of the
Photogrammetry, Remote Sensing and Spatial Information Sciences, XLII-4/W19:425–431, 12
2019.3. Prabal Kanti Roy and Seiji Hayakawa. Characteristics of Air Pollution Condition in Dhaka
City. Journal of Agricultural Meteorology, 1997.
4. Hannes Taubenböck, Ines Standfuß, Martin Klotz, and Michael Wurm. The physical density
of the city—deconstruction of the delusive density measure with evidence from two european
megacities. ISPRS International Journal of Geo-Information, 5:206, 11 2016.
5. Martin Herold, Helen Couclelis, and Keith Clarke. ”the role of spatial metrics in the analysis
and modeling of urban land use change”. Computers Environment and Urban Systems, pages
369–399, 07 2005.
6. Jingnan Huang, X. X. Lu, and Jefferey M. Sellers. A global comparative analysis of urban
form: Applying spatial metrics and remote sensing. Landscape and Urban Planning, 2007.
7. Barak Oshri, Annie Hu, Peter Adelson, Xiao Chen, Pascaline Dupas, Jeremy Weinstein, Mar-
shall Burke, David B. Lobell, and Stefano Ermon. Infrastructure quality assessment in africa
using satellite imagery and deep learning. CoRR, abs/1806.00894, 2018.
8. Afrobarometer, 2014, round 6 survey manual, (2014).
9. Sang Michael Xie, Neal Jean, Marshall Burke, David B. Lobell, and Stefano Ermon. Transfer
learning from deep features for remote sensing and poverty mapping. CoRR, abs/1510.00098,
2015.
10. Simone Piaggesi, Laetitia Gauvin, Michele Tizzoni, Ciro Cattuto, Natalia Adler, Stefaan Ver-
hulst, Andrew Young, Rhiannan Price, Leo Ferres, and Andre Panisson. Predicting city poverty
using satellite imagery. In The IEEE Conference on Computer Vision and Pattern Recognition
(CVPR) Workshops, June 2019.
11. Md Masud Parves Rana. Urbanization and sustainability: Challenges and strategies for sus-
tainable urban development in bangladesh. Environment Development and Sustainability,
13:237–256, 02 2011.
12. Oleksandr Kit, Matthias Lüdeke, and Diana Reckien. Defining the bull’s eye: Satellite imagery-
assisted slum population assessment in hyderabad, india. Urban Geography, 34:413–424, 05
2013.
13. UN-Habitat. Urbanization and development: emerging futures. World cities report 2016. UN-
Habitat, 2016.
14. Md Siddiqy. Urban environment and major challenges in sustainable development: Experience
from dhaka city in bangladesh. South East Asia Journal of Public Health, 7:12, 12 2017.
15. Michael Barke. The Importance of Urban Form as an Object of Study, pages 11–30. , 01 2018.
16. Mattias Kärrholm. The territorialization of a pedestrian precinct in malmö: Materialities
in the commercialisation of public space. Urban Studies, 45(9):1903–1924, 2008. accepted for
publication in 2008. The information about affiliations in this record was updated in December
2015. The record was previously connected to the following departments: Building Functions
Analysis (011037000).
17. Kevin Lynch. Good city form, 1984.
18. Ivor Samuels, Phillippe Panerai, Jean Castex, and Jean Charles Depaule. Urban forms. Rout-
ledge, 2012.
19. Leise Oliveira, Betty Barraza, Bruno Bertoncini, Cassiano Isler, Dannúbia Pires, Ellen
Madalon, Jessica Lima, Jose Vidal Vieira, Leonardo Meira, Lilian Bracarense, Renata Ban-
deira, Renata Oliveira, and Suellem Ferreira. An overview of problems and solutions for urban
freight transport in brazilian cities. Sustainability, 10:1233, 04 2018.
20. Hannes Taubenböck, Nicolas Kraff, and Michael Wurm. The morphology of the arrival city - a
global categorization based on literature surveys and remotely sensed data. Applied Geography,
92, 02 2018.
21. M. Shashi and Kamal Jain. Use of Photogrammetry in 3D modeling and visualization of
buildings. Journal of Engineering and Applied Sciences, 2007.
22. Lionel Gueguen. Classifying compound structures in satellite images: A compressed representa-
tion for fast queries. IEEE Transactions on Geoscience and Remote Sensing, 53(4):1803–1818,
2014.23. Isa Baud, Monika Kuffer, Karin Pfeffer, Richard Sliuzas, and Sadasivam Karuppannan. Un-
derstanding heterogeneity in metropolitan india: The added value of remote sensing data for
analyzing sub-standard residential areas. International Journal of Applied Earth Observation
and Geoinformation, 2010.
24. Lorenzo Bruzzone and Lorenzo Carlin. A multilevel context-based system for classification of
very high spatial resolution images. IEEE Transactions on Geoscience and Remote Sensing,
2006.
25. Gong Cheng, Junwei Han, Kaiming Li, Zhenbao Liu, Shuhui Bu, and Jinchang Ren. Effective
and efficient midlevel visual elements-oriented land-use classification using vhr remote sensing
images. IEEE Transactions on Geoscience and Remote Sensing, 53:1–12, 07 2015.
26. John E. Ball, Derek T. Anderson, and Chee Seng Chan. A comprehensive survey of
deep learning in remote sensing: Theories, tools and challenges for the community. CoRR,
abs/1709.00308, 2017.
27. Keiller Nogueira, Otávio A.B. Penatti, and Jefersson A. dos Santos. Towards better exploiting
convolutional neural networks for remote sensing scene classification. Pattern Recognition,
61:539–556, Jan 2017.
28. Abu Bakar Siddik Nayem, Anis Sarker, Ovi Paul, Ali Amin, Ashraful Amin, and AKM Mah-
bubur Rahman. LULC Segmentation of RGB Satellite Image Using FCN-8. , 2019.
29. Ana Andries, Stephen Morse, Jim Lynch, Emma Woolliams, J Fonweban, and R.J. Murphy.
Translation of remote sensing data into sustainable development indicators (isdrs24 conference
messina italy june 2018). In , 06 2018.
30. Jiaxuan You, Xiaocheng Li, Melvin Low, David Lobell, and Stefano Ermon. Deep gaussian
process for crop yield prediction based on remote sensing data. In Proceedings of the Thirty-
First AAAI Conference on Artificial Intelligence, AAAI’17, page 4559–4565. AAAI Press,
2017.
31. Ron Mahabir, Andrew Crooks, Anthony Stefanidis, Arie Croitoru, and Peggy Agouris. A
critical review of high and very high-resolution remote sensing approaches for detecting and
mapping slums: Trends, challenges and emerging opportunities. Urban Science, 2, 01 2018.
32. Magdalena Benza, John Weeks, Douglas Stow, David Lopez-Carr, and Keith Clarke. A
pattern-based definition of urban context using remote sensing and gis. Remote Sensing of
Environment, 183:250–264, 09 2016.
33. Caleb Robinson, Fred Hohman, and Bistra Dilkina. A deep learning approach for population
estimation from satellite imagery. CoRR, abs/1708.09086, 2017.
34. Yi Yang and Shawn Newsam. Bag-of-visual-words and spatial extensions for land-use classi-
fication. In , pages 270–279, 01 2010.
35. Rainer Hollmann, Chris J Merchant, Roger Saunders, Catherine Downy, Michael Buchwitz,
Anny Cazenave, Emilio Chuvieco, Pierre Defourny, Gerrit de Leeuw, René Forsberg, et al. The
esa climate change initiative: Satellite data records for essential climate variables. Bulletin of
the American Meteorological Society, 94(10):1541–1552, 2013.
36. Neal Jean, Marshall Burke, Michael Xie, W. Matthew Davis, David B. Lobell, and Ste-
fano Ermon. Combining satellite imagery and machine learning to predict poverty. Science,
353(6301):790–794, 2016.
37. Digitalglobe, https://www.digitalglobe.com/.
38. Eod (encuesta origen destino de viajes), http://www.sectra.gob.cl/encuestas movilidad/ en-
cuestas movilidad.htm.
39. Stephen Marshall. Cities design and evolution. Routledge, Abingdon, Oxon New York, NY,
2009.
40. Kaiming He, Xiangyu Zhang, Shaoqing Ren, and Jian Sun. Deep residual learning for image
recognition. In Proceedings of the IEEE Computer Society Conference on Computer Vision
and Pattern Recognition, 2016.
41. François Chollet. Xception: Deep learning with depthwise separable convolutions. In Pro-
ceedings of the IEEE conference on computer vision and pattern recognition, pages 1251–1258,
2017.You can also read