Delivering Value. Kinross Gold Corporation - March 2021
←
→
Page content transcription
If your browser does not render page correctly, please read the page content below
March 2021

Delivering Value.
Kinross Gold Corporation
March 2021

Cautionary Statement on Forward-Looking
Information
All statements, other than statements of historical fact, contained or incorporated by reference in or made in giving this presentation and responses to questions, including but not limited to any information as to the future performance of Kinross, constitute “forward looking statements” within the meaning of
applicable securities laws, including the provisions of the Securities Act (Ontario) and the provisions for “safe harbor” under the United States Private Securities Litigation Reform Act of 1995 and are based on expectations, estimates and projections as of the date of this presentation. Forward-looking
statements contained in this presentation include those statements on slides with, and statements made under, the headings “Why Kinross?”, “2021E Outlook”, “Exciting Future for Kinross”, “Strengths of a Global Portfolio”, “Growth Drivers Support Long-Term Outlook”, “Advancing Project Pipeline”,
“Prioritizing Resource Conversion”, “Strong Liquidity and Financial Flexibility”, “Leading Free Cash Flow Profile”, “Manageable Capital Expenditure Profile”, “Manageable Debt Profile”, “Competitive Production and AISC Profile”, “Attractive Value Opportunity”, “Kinross Investment Case”, “Detailed Overview of
Operations and Development Projects”, “West Africa”, “Russia”, and all slides in “Appendix” and include, without limitation, statements with respect to our guidance for production, production costs of sales, cash flow, free cash flow, all-in sustaining cost of sales, and capital expenditures; the declaration,
payment and sustainability of the Company’s dividends; optimization of mine plans; identification of additional resources and reserves; the schedules and budgets for the Company’s development projects; mine life and any potential extensions; the Company’s capital reinvestment program and continuous
improvement initiatives and project performance or outperformance, as well as references to other possible events, the future price of gold and silver, the timing and amount of estimated future production, costs of production, operating costs; capital expenditures, costs and timing of the development of
projects and new deposits, estimates and the realization of such estimates (such as mineral or gold reserves and resources or mine life), success of exploration, development and mining, currency fluctuations, capital requirements, project studies, government regulation permit applications and conversions,
restarting suspended or disrupted operations; environmental risks and proceedings; and resolution of pending litigation. The words “2021E”, “anticipated”, “estimate”, “expect”, “extending”, “focus”, “forecast”, “goal”, “growth projects”, “guidance”, “opportunity”, “outlook”, “plan”, “potential”, “priority”, “promising”,
“prospective”, “target”, “trending” or “upside”, or variations of or similar such words and phrases or statements that certain actions, events or results may, can, could, would, should, might, indicates, or will be taken, and similar expressions identify forward looking statements. The estimates, models and
assumptions of Kinross referenced, contained or incorporated by reference in this news release, which may prove to be incorrect, include, but are not limited to, the various assumptions set forth herein and in our Management’s Discussion and Analysis (“MD&A”) for the year ended December 31, 2020, and
the Annual Information Form dated March 30, 2020 as well as: (1) there being no significant disruptions affecting the operations of the Company, whether due to extreme weather events (including, without limitation, excessive or lack of rainfall, in particular, the potential for further production curtailments at
Paracatu resulting from insufficient rainfall and the operational challenges at Fort Knox and Bald Mountain resulting from excessive rainfall, which can impact costs and/or production) and other or related natural disasters, labour disruptions (including but not limited to strikes or workforce reductions), supply
disruptions, power disruptions, damage to equipment, pit wall slides (in particular that the effects of the pit wall slides at Fort Knox and Round Mountain are consistent with the Company’s expectations) or otherwise; (2) permitting, development, operations and production from the Company’s operations and
development projects being consistent with Kinross’ current expectations including, without limitation: the maintenance of existing permits and approvals and the timely receipt of all permits and authorizations necessary for the operation of Tasiast, and the development and operation of the 24k Project;
operation of the SAG mill at Tasiast; land acquisitions and permitting for the construction and operation of the new tailings facility, water and power supply and continued operation of the tailings reprocessing facility at Paracatu; the Lobo-Marte project; commencement of production at the La Coipa project;
approval of an enhanced mine plan at Fort Knox; in each case in a manner consistent with the Company’s expectations; and the successful completion of exploration consistent with the Company’s expectations at the Company’s projects; (3) political and legal developments in any jurisdiction in which the
Company operates being consistent with its current expectations including, without limitation, the impact of any political tensions and uncertainty in the Russian Federation or any related sanctions and any other similar restrictions or penalties imposed, or actions taken, by any government, including but not
limited to amendments to the mining laws, and potential power rationing and tailings facility regulations in Brazil, potential amendments to water laws and/or other water use restrictions and regulatory actions in Chile, new dam safety regulations, potential amendments to minerals and mining laws and energy
levies laws, the enforcement of labour laws in Ghana, new regulations relating to work permits, potential amendments to customs and mining laws (including but not limited to amendments to the VAT) and the potential application of revisions to the tax code in Mauritania, the European Union’s General Data
Protection Regulation or similar legislation in other jurisdictions and potential amendments to and enforcement of tax laws in Russia, Ghana and Mauritania (including, but not limited to, the interpretation, implementation, application and enforcement of any such laws and amendments thereto), and the
impact of any trade tariffs being consistent with Kinross’ current expectations; (4) the completion of studies, including optimization studies, improvement studies; scoping studies and pre-feasibility and feasibility studies, on the timelines currently expected and the results of those studies being consistent with
Kinross’ current expectations, including the completion of the Lobo-Marte and Manh Choh feasibility studies and Udinsk pre-feasibility study; (5) the exchange rate between the Canadian dollar, Brazilian real, Chilean peso, Russian rouble, Mauritanian ouguiya, Ghanaian cedi and the U.S. dollar being
approximately consistent with current levels; (6) certain price assumptions for gold and silver; (7) prices for diesel, natural gas, fuel oil, electricity and other key supplies being approximately consistent with the Company’s expectations; (8) production and cost of sales forecasts for the Company meeting
expectations; (9) the accuracy of: the current mineral reserve and mineral resource estimates of the Company including the accuracy and reliability of the pre-acquisition mineral resource estimates of Manh Choh and Kinross’ analysis thereof being consistent with expectations (including but not limited to ore
tonnage and ore grade estimates), future mineral resource and mineral reserve estimates being consistent with preliminary work undertaken by the Company, mine plans for the Company’s current and future mining operations, and the Company’s internal models; (10) labour and materials costs increasing
on a basis consistent with Kinross’ current expectations; (11) the terms and conditions of the legal and fiscal stability agreements for the Tasiast and Chirano operations being interpreted and applied in a manner consistent with their intent and Kinross’ expectations and without material amendment or formal
dispute (including without limitation the application of tax, customs and duties exemptions and royalties); (12) goodwill and/or asset impairment potential; (13) the regulatory and legislative regime regarding mining, electricity production and transmission (including rules related to power tariffs) in Brazil being
consistent with Kinross’ current expectations; (14) access to capital markets, including but not limited to maintaining our current credit ratings consistent with the Company’s current expectations; (15) that the Brazilian power plants will operate in a manner consistent with our expectations; (16) that drawdown
of remaining funds under the Tasiast project financing will proceed in a manner consistent with our current expectations; (17) potential direct or indirect operational impacts resulting from infectious diseases or pandemics such as the ongoing COVID-19 pandemic; (18) the effectiveness of preventative actions
and contingency plans put in place by the Company to respond to the COVID-19 pandemic, including, but not limited to, social distancing, a travel restrictions, business continuity plans, and efforts to mitigate supply chain disruptions; (19) changes in national and local government legislation or other
government actions, particularly in response to the COVID-19 outbreak; (20) litigation, regulatory proceedings and audits, and the potential ramifications thereof, being concluded in a manner consistent with the Corporation’s expectations (including without limitation the audit of mining companies in Ghana
which includes the Corporation’s Ghanaian subsidiaries, litigation in Chile relating to the alleged damage of wetlands and the scope of any remediation plan or other environmental obligations arising therefrom, the ongoing litigation with the Russian tax authorities regarding dividend withholding tax and the
ongoing Sunnyside litigation regarding potential liability under the U.S. Comprehensive Environmental Response, Compensation, and Liability Act); (21) that the Company will enter into definitive documentation with the Government of Mauritania substantially in accordance with the terms and conditions of
the term sheet, on a basis consistent with our expectations and that the parties will perform their respective obligations thereunder on the timelines agreed; (22) that the exploitation permit for Tasiast Sud will be issued under the terms and on timelines consistent with our expectations; (23) that the benefits of
the contemplated arrangements related to the agreement in principle will result in increased stability at the Company’s operations in Mauritania; and (24) the Company’s financial results, cash flows and future prospects being consistent with Company expectations in amounts sufficient to permit sustained
dividend payments. Known and unknown factors could cause actual results to differ materially from those projected in the forward-looking statements. Such factors include, but are not limited to: the inaccuracy of any of the foregoing assumption, sanctions (any other similar restrictions or penalties) now or
subsequently imposed, other actions taken, by, against, in respect of or otherwise impacting any jurisdiction in which the Company is domiciled or operates (including but not limited to the Russian Federation, Canada, the European Union and the United States), or any government or citizens of, persons or
companies domiciled in, or the Company’s business, operations or other activities in, any such jurisdiction; reductions in the ability of the Company to transport and refine doré; fluctuations in the currency markets; fluctuations in the spot and forward price of gold or certain other commodities (such as fuel and
electricity); changes in the discount rates applied to calculate the present value of net future cash flows based on country-specific real weighted average cost of capital; changes in the market valuations of peer group gold producers and the Company, and the resulting impact on market price to net asset
value multiples; changes in various market variables, such as interest rates, foreign exchange rates, gold or silver prices and lease rates, or global fuel prices, that could impact the mark-to-market value of outstanding derivative instruments and ongoing payments/receipts under any financial obligations;
risks arising from holding derivative instruments (such as credit risk, market liquidity risk and mark-to-market risk); changes in national and local government legislation, taxation (including but not limited to income tax, advance income tax, stamp tax, withholding tax, capital tax, tariffs, value-added or sales
tax, capital outflow tax, capital gains tax, windfall or windfall profits tax, production royalties, excise tax, customs/import or export taxes/duties, asset taxes, asset transfer tax, property use or other real estate tax, together with any related fine, penalty, surcharge, or interest imposed in connection with such
taxes), controls, policies and regulations; the security of personnel and assets; political or economic developments in Canada, the United States, Chile, Brazil, Russia, Mauritania, Ghana, or other countries in which Kinross does business or may carry on business; business opportunities that may be
presented to, or pursued by, us; our ability to successfully integrate acquisitions and complete divestitures; operating or technical difficulties in connection with mining, development or refining activities; employee relations; litigation or other claims against, or regulatory investigations and/or any enforcement
actions, administrative orders or sanctions in respect of the Company (and/or its directors, officers, or employees) including, but not limited to, securities class action litigation in Canada and/or the United States, environmental litigation or regulatory proceedings or any investigations, enforcement actions
and/or sanctions under any applicable anti-corruption, international sanctions and/or anti-money laundering laws and regulations in Canada, the United States or any other applicable jurisdiction; the speculative nature of gold exploration and development including, but not limited to, the risks of obtaining
necessary licenses and permits; diminishing quantities or grades of reserves; adverse changes in our credit ratings; and contests over title to properties, particularly title to undeveloped properties. In addition, there are risks and hazards associated with the business of gold exploration, development and
mining, including environmental hazards, industrial accidents, unusual or unexpected formations, pressures, cave-ins, flooding and gold bullion losses (and the risk of inadequate insurance, or the inability to obtain insurance, to cover these risks). Many of these uncertainties and contingencies can directly or
indirectly affect, and could cause, Kinross’ actual results to differ materially from those expressed or implied in any forward-looking statements made by, or on behalf of, Kinross, including but not limited to resulting in an impairment charge on goodwill and/or assets. There can be no assurance that forward-
looking statements will prove to be accurate, as actual results and future events could differ materially from those anticipated in such statements. Forward-looking statements are provided for the purpose of providing information about management’s expectations and plans relating to the future. All of the
forward-looking statements made in this presentation are qualified by this cautionary statement and those made in our other filings with the securities regulators of Canada and the United States including, but not limited to, the cautionary statements made in the “Risk Analysis” section of our MD&A for the
year ended December 31, 2020 and the Annual Information Form dated March 30, 2020. These factors are not intended to represent a complete list of the factors that could affect Kinross. Kinross disclaims any intention or obligation to update or revise any forward-looking statements or to explain any
material difference between subsequent actual events and such forward-looking statements, except to the extent required by applicable law.

Other information

Where we say "we", "us", "our", the "Company", or "Kinross" in this presentation, we mean Kinross Gold Corporation and/or one or more or all of its subsidiaries, as may be applicable.

The technical information about the Company’s mineral properties contained in this news release has been prepared under the supervision of Mr. John Sims who is a “qualified person” within the meaning of National Instrument 43-101.Mr. Sims was an officer of Kinross until December 31, 2020. Mr. Sims
remains the Company’s qualified person as an external consultant.

All dollar amounts are expressed as U.S. dollars, unless otherwise noted.

                                                                                                                                                                                                                                                                                                                             2
Table of Contents

             Gold Price                     4
             Company Overview               6
             Operations and Projects        31
                    Americas                32
                    West Africa             48
                    Russia                  55
             Corporate Responsibility       62
             Appendix                       69

                                        3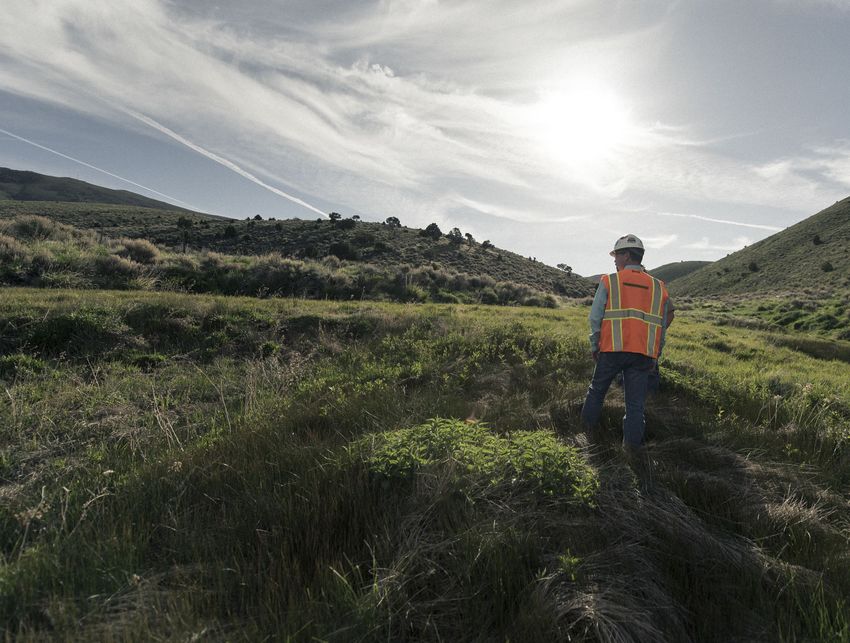
Gold Price                                                                                                                                                            March 2021

                         Supportive Backdrop for Gold Price
                         Low real rates and significant increases in money supply provide long-term support
                         for gold price
                                       U.S. 10-Year Real Rate                                                                       Gold Price vs. U.S. Money Supply
                                          vs. Gold Price(i)                                                                             (M2) Year/Year change(i)
                         -2.0                                                           $2,500                                           30                                                           $2,500

                         -1.0                                                                                                            25
                                                                                        $2,000                                                                                                        $2,000
U.S. 10-Year Real Rate

                                                                                                                      M2, Y/Y % change
                                                                                                 Gold Price ($/oz.)

                                                                                                                                                                                                               Gold Price ($/oz.)
                         0.0                                                                                                             20
                                                                                        $1,500                                                                                                        $1,500
                         1.0                                                                                                             15
                                                                                        $1,000                                                                                                        $1,000
                         2.0                                                                                                             10

                                                                                        $500                                                                                                          $500
                         3.0                                                                                                              5

                         4.0                                                            $0                                                -                                                           $0
                                2005

                                             2010

                                                            2015

                                                                             2020

                                                                                                                                              2006

                                                                                                                                                     2008

                                                                                                                                                            2010

                                                                                                                                                                   2012

                                                                                                                                                                          2014

                                                                                                                                                                                 2016

                                                                                                                                                                                        2018

                                                                                                                                                                                               2020
                                         Gold Price                U.S. Real Rate                                                                            Gold Price                 M2 - Y/Y

                                            (i) Source: TD Securities Equity Research                                                                                                                      4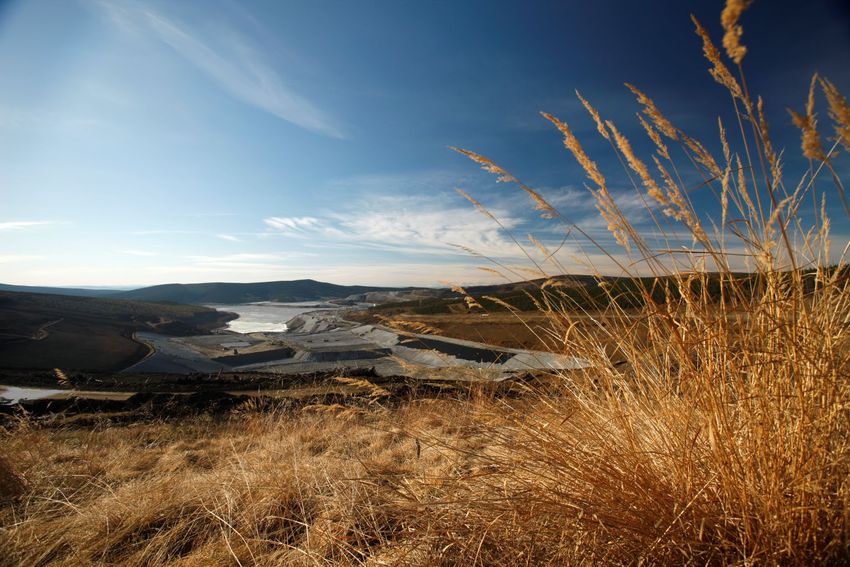
Gold Price                                                                                                                          March 2021

Superior Leverage to Gold
Kinross offers among the purest exposure to gold of the peer group

                                               Revenue by Commodity 2020-22E(i)
                                                                     (% of Total)
 100%

  90%

  80%
             Kirkland Lake

                                                                                                                           Yamana
                                     Kinross

                                                                                           Gold Fields

                                                                                                                 Newmont
                                                        AngloGold

                                                                       Agnico Eagle

                                                                                                                                     Barrick
                                                            Gold    Silver            Copper             Other

                      (i) Source: RBC Equity Research                                                                                          5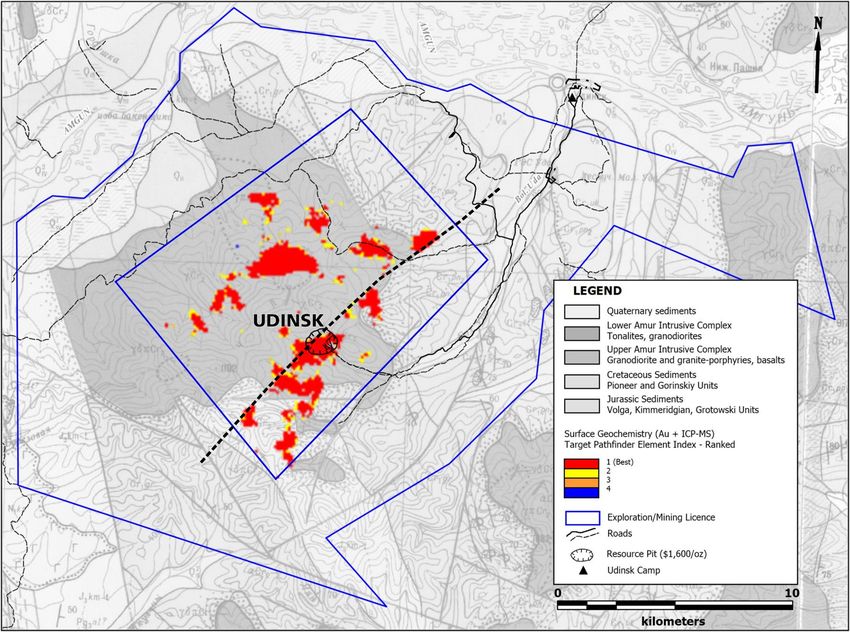
Kinross Gold Corporation
Kinross Gold Corporation                                                                                                March 2021

       Why Kinross?

                              GLOBAL                            2.4Moz.
                                 PORTFOLIO                           Portfolio
                                                                 PRODUCER
                                                                               (1)

                                              8 mines               GROWING TO
                                              3 regions                  2.9Moz.
                                                                                      (ii)

                                                                                               FINANCIALLY
 LARGE GOLD                 GEOGRAPHICALLY    EXCELLENT                                                                     COMMITTED TO
                                                                                               STRONG WITH
  PRODUCER,                   DIVERSIFIED  OPERATING TRACK                                                                  RESPONSIBLE
                                                                                                ATTRACTIVE
 HIGHLY LIQUID                PRODUCER         RECORD                                                                          MINING
                                                                                                VALUATION
• ~$8.5 billion                  • Success                      • Met or exceeded            • $2.8 billion of liquidity   • ESG performance
  market                           operating in                   annual guidance for                                        consistently ranks in
                                                                                             • Investment grade
  capitalization                   numerous                       production, costs and                                      the top quartile of
                                                                                               balance sheet
                                   jurisdictions                  capital expenditures                                       the peer group
• +$150 million of
                                                                  for 9 consecutive          • Generated over $1
  trading liquidity per
                                                                  years                        billion of free cash
  day(i)                                                                                       flow in 2020
                                                                                             • Compelling value
                                                                                               relative to peers

                          (1) Refer to endnote #1
                          (i) Source: Bloomberg, last 30 days                                                                            7
                          (ii) Expected production in 2023
March 2021
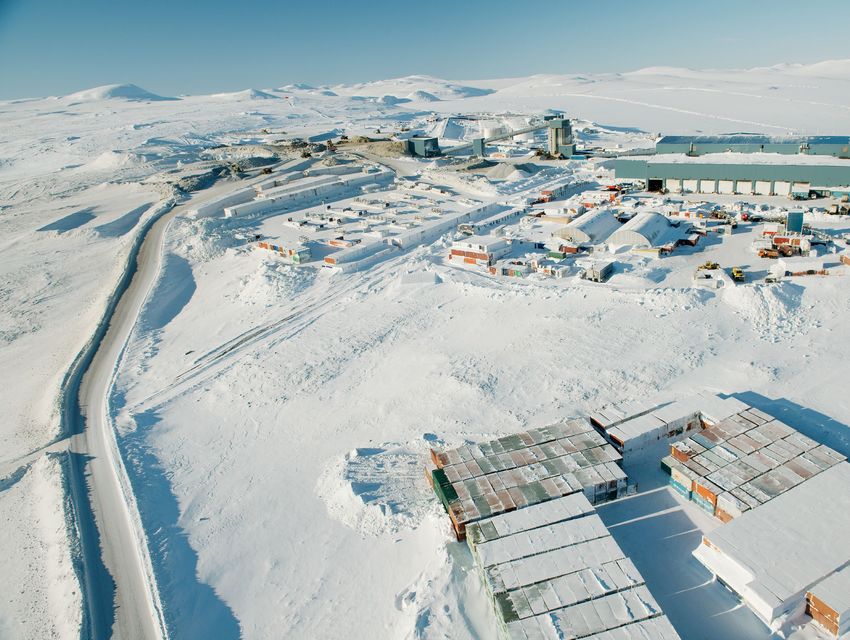
Diversified Portfolio of Assets
Portfolio of mines and development projects located in three core regions
Kupol-Dvoinoye, Russia
Fort Knox, U.S.A.
Manh Choh, U.S.A.
Udinsk,
Russia Bald Mountain,
U.S.A.
Round Mountain,
2020 Gold Equivalent U.S.A.
Production(1)
Tasiast, Mauritania
22%
Chirano, Ghana
Approximate
2.4M
Annual Production (koz.)(i)
Paracatu, Brazil
55% < 300 300–400 > 400
ounces Operating
23% Assets La Coipa, Chile
< 300 300–400 > 400 Lobo-Marte, Chile
Development
Projects
Americas West Africa Russia
(1) Refer to endnote #1
(i) Annual production level for “Operating Assets” based on 2020 gold equivalent production.
8
Annual production level for “Development Projects” based on previously disclosed total life-of-mine
production divided by total mine life.
Kinross Gold Corporation March 2021
Nine Consecutive Years of Meeting Guidance
Kinross has met or exceeded guidance for production, costs and capital
expenditures for the past nine years, despite impacts from COVID-19
2012 2013 2014 2015 2016 2017 2018 2019 2020
Met or exceeded annual
production guidance
Met or came in under
annual cost guidance
Met or came in under
annual capital expenditures
guidance
9
Kinross Gold Corporation                                                                                                                         March 2021
                                                          (2)

    2021E Outlook
     Expected 2021 production and capex in-line with 2020; costs up on
     temporary factors

                                                    2020 Guidance                               2020 Full-year                            2021 Guidance
                                                                (+/- 5%)                           Results                                          (+/- 5%)

Gold equivalent
production                                                2.4 million                               2.4 million                                2.4 million
(ounces)(1)

Production cost of sales
($ per gold equivalent ounce)(1,3)
                                                                $720                                      $723                                      $790

All-in sustaining cost
($ per gold equivalent ounce)(1,3)
                                                                $970                                      $987                                      $1,025

Capital expenditures
($ millions)
                                                                $900                                      $916                                      $900

                    Assumptions within 2021 production cost of sales include: $1,500/oz. gold; $20/oz silver; $55/bbl oil; 5.0BRL; 1.30CAD; 70RUB
                    (1) Refer to endnote #1
                    (2) Refer to endnote #2                                                                                                                    10
                    (3) Refer to endnote #3
Kinross Gold Corporation March 2021
Exciting Future
Production growth of 20% from 2021 to 2023(2)
Three drivers underpinning and
extending current production… Growing Production Profile
• Recent capital reinvestment phase
enables leveraging of existing
2.9
infrastructure
• Continuous improvement programs 2.7
(Million Au eq. oz. +/- 5%)
enabling profitable mine life extensions
Production(1)
• Exploration strategy around existing
operations, successfully adding three 2.4
years of mine-life at Chirano, and one
year at both Kupol and Paracatu
…allowing growth assets to drive
production 500koz. higher
• Incremental production roughly evenly 2021 2022 2023
split between Tasiast and La Coipa
(1) Refer to endnote #1
(2) Refer to endnote #2 11Kinross Gold Corporation March 2021
Growth Drivers Support Long-Term Outlook
Expecting average annual production of ~2.5 million gold equivalent ounces(1)
over the decade, with additional opportunities that could drive it higher
(i)(ii)
(i) 2024-2029 is an illustrative trend
(1) Refer to endnote #1
(ii) Gold equivalent calculated using $1,200/oz. gold price and $16/oz. silver price 12Kinross Gold Corporation March 2021
Production Plans and Project Pipeline
Base Case Expected Growth Additional Pipeline
Production Projects Opportunities
Kupol: regional exploration,
Kupol-Dvoinoye Chulbatkan: Udinsk mine life extensions
Tasiast: satellites, West
Tasiast 24k
Branch depth extension
Chirano 2025 extension Fort Knox: Tasiast Sud dump leach
Manh Choh Chirano: Obra & Suraw underground
Paracatu and other extensions
Paracatu: Northwest Extension
Fort Knox + Gil satellites
Round Mountain: Fort Knox: Northwest Bulge
Round Mountain Phase S Round Mountain: Phase X
Additional Bald Mountain deposits
Bald Mountain
La Coipa: Can Can, Coipa
La Coipa: Phase 7 Lobo-Marte Norte, Puren, Catalina
Kettle River: Curlew
Base Case Production implies projects and operations in execution or at a pre-feasibility study level of
confidence or higher.
Expected Growth Projects implies projects and operations ranging from scoping through feasibility study
level of confidence.
Additional Pipeline Opportunities imply projects spanning a range from exploration targets through 13
conceptual to a pre-feasibility study level of confidence.Kinross Gold Corporation March 2021
Manageable Capital Expenditure Profile
Forecast capex requirements are manageable for Kinross’ size
Precise amounts tied to long-term production levels
~$300/oz. for 3Moz. long-term
$ 900
production
~$300/oz. for 2.5Moz. long-term
production
$ 600
US$ million
$900
$800
$700
$ 300
-
2021 2022 2023
Base Case Expected Growth Projects
Notes:
1. Base Case capital includes Udinsk project 14Kinross Gold Corporation March 2021
Advancing the Project Pipeline
Expected project milestones at growth projects that span all three operating regions
H1 2021 >> H2 2021 >> 2022 >> 2023+
La Coipa Restart Q4 Round Mountain: Mid-2023
Tasiast 24k
Commence Chulbatkan: Udinsk Phase S
Phase 7 pre-stripping Pre-feasibility study Commence stripping Throughput to reach
24ktpd
Fort Knox:
Gil Satellites
Q4
Fort Knox:
Mid-2022
La Coipa Restart 2024
Feasibility study Gil Satellites First production Fort Knox: Manh Choh
Potential first production First production
Q2 H2 2022
Round Mountain: Chulbatkan: Udinsk 2025
Q4
Phase S Feasibility study Lobo-Marte
Lobo-Marte
Feasibility study Potentially commence
Feasibility study
End of 2022 construction
Q2 End of 2021 Fort Knox: Manh Choh
Fort Knox: Manh Choh 2025
Tasiast 24k Feasibility study
Scoping study Chulbatkan: Udinsk
Throughput to reach
First production
Project Location 21ktpd
Americas 2027
Lobo-Marte
West Africa Potential first production
Russia
Note: timing for milestones may change and are subject to study results and Board approval where required 15Kinross Gold Corporation March 2021
Prioritizing Resource Conversion
(i)
Significant potential for mine life extension at existing assets
25
20
15
Years
10
5
-
Expected Reserve Life Expected Resource Life
(i) See Appendix
Notes:
- Excludes Kettle River and Maricunga 16
- Incorporates internal assumptions for recovery rates
- “Resource Life” based on Measured and Indicated estimated resources as of year-end 2020Kinross Gold Corporation March 2021
Strong Liquidity and Financial Flexibility
Well-positioned to fund portfolio of mines and growth projects
Liquidity Position Financial Flexibility
• Available liquidity of ~$2.8 billion, including
over $1.2 billion of cash
• Made final Chulbatkan payment of $142
As at
million in cash subsequent to year-end
December 31, 2020
$2.8B • Next debt maturity of $500 million in
September 2021, which we expect to repay
• Further strengthened net debt to EBITDA
Cash & cash equivalents Available credit
17Kinross Gold Corporation March 2021
Leading Free Cash Flow Profile
Portfolio of mines expected to generate exceptional free cash flow
• Attractive forecast free cash Analysts Forecast Strong
flow yield relative to peers Free Cash Flow Yield vs. Peers(i)
attributed to:
20%
o past investments in
organic growth projects 15%
o culture of continuous 10%
improvement
5%
o attractive valuation
0%
2021 2022 2023
Kinross Peer Average
Source: FactSet – March 5, 2021
(i) Peer group consists of: Agnico Eagle, AngloGold, Barrick, Gold Fields, Kirkland Lake, Newcrest, Newmont, Yamana 18Kinross Gold Corporation March 2021
Disciplined Capital Allocation Strategy
Defined by our three pillars:
Reinvesting in our Business 2021 Guidance
• Sustaining capex – maintaining our existing operations
$340 million
safely and to world-class environmental standards
• Expansion projects – pursuing attractive returns by
leveraging existing infrastructure and experience in $560 million
operating jurisdictions to minimize execution risk
• Targeted exploration - capitalizing on opportunities to
$120 million
extend or grow production
Maintaining Financial Strength
• Continuing to repay debt upon maturity, maintaining Planned
investment grade credit ratings repayment of
$500 million in
• Continuing to reduce net debt senior notes
Returning Capital to Shareholders
• Sustainable quarterly dividend ~$150 million per
annum
19Kinross Gold Corporation March 2021
Measured Acquisition Track Record
Disciplined approach to M&A over the past 8 years, focused on assets
that leverage operating expertise in existing regions
Bald Mountain & 50% Hydroelectric
of Round Mountain(i) Power Plants Chulbatkan Manh Choh(ii)
Nevada, U.S.A. Brazil Russia Alaska, U.S.A.
2016 2018 2019 2020
• $588 million cash • $257 million cash • $283 million cash • $94 million cash
• Two high-quality, producing • Secures long-term, low- • Large, near surface • Leverages Fort Knox
mines with upside potential cost power for Tier 1 resource, with mill
• Expands portfolio in Paracatu mine extensive exploration • Adds high-grade
Nevada, a world-class • Expected to lower potential production and cash
mining jurisdiction production cost of sales • Leverages operating flow in top-tier
by ~$80/oz life of mine and regional expertise jurisdiction
(i) Remaining 50% interest that Kinross did not already own
(ii) 70% interest 20Kinross Gold Corporation March 2021
Manageable Debt Profile
Kinross’ senior notes are rated investment grade with the next repayment
planned for September of this year Debt Ratings
Debt Schedule Agency Rating
S&P BBB- (Stable)
$72 Moody’s Baa3 (Stable)
$32
Fitch BBB- (Stable)
$500 $500 $500
Debt Breakdown
$ millions
Interest Rate Amount Due
Due 2021 5.125% $500M
$250
Due 2024 5.950% $500M
$76 Due 2027 4.500% $500M
$20 Due 2041 6.875% $250M
-
$0 $0
Senior Notes 5.432% $1,750M
Tasiast Project LIBOR +
$200M
Financing 4.38%
Senior Notes Tasiast Project Financing (Drawn) Total - $1,950M
21Kinross Gold Corporation March 2021
Global Mining Leader in ESG
Prioritizing the effective management of ESG risks through our principled
approach to sustainability and strong on-the-ground performance at our operations
• ESG performance consistently
RobecoSAM
ranks in top quartile of peer group, (0-100, 100 is best)
irrespective of scoring
methodology
• Long history of participation in 75 80 85 90 95
ESG – first reported to the CDP(i) Sustainalytics
in 2005 (0-100, 100 is best)
• Covered by Sustainalytics which
has informed Kinross’ listing on
75 80 85 90 95
the Jantzi Social Index since 2007
ISS Governance
(1-10, 1 is best)
0
5 1
4 3
2 2
3 41 0
5
Peer Median Kinross
Source: Bloomberg as of September 2020 22
(i) CDP is a not-for-profit charity running the global disclosure system for investors, companies, cities, states and regions to manage their
environmental impacts.Kinross Gold Corporation March 2021
Global Mining Leader in ESG
Environment Social Governance
98.5% 630,000
TAILINGS MANAGEMENT of workforce hired from beneficiaries of INDEPENDENT BOARD
• Kinross has no upstream facilities within host country community investments • 8 of 9 Board members are
• Maintained record of zero reportable independent
incidents at nine active, five inactive • All of our Board committees are
and three closed tailings facilities composed of 100% independent
• All facilities meet or exceed regulatory $2.1 billion $3.2 billion directors
and international requirements spent on goods and spent in-country through
services in host taxes, wages,
countries procurement &
Three-Year Water Intensity Rates
community investments
(litres/tonne of ore processed) TOP TIER GOVERNANCE
438
428 The highest-rated mining
419 Benchmarking TRIFR 2019(i)(ii) company in The Globe and Mail’s
annual corporate governance survey
0.67
2017 2018 2019 in 2020
Benchmarking GHG Emissions
Five-Year Average(i)
(kg CO2e/tonne of ore processed) 0.29
33% DIVERSITY RATIO
56.7 • Achieved 33% target for Board
11.6 gender diversity
• Signatory to the BlackNorth
Gold Sector Peers Kinross Gold Sector Peers Kinross Initiative
(i) Peers include: Agnico Eagle, AngloGold, Barrick, Gold Fields, Harmony, Newcrest, Newmont, Polyus
(ii) Total Reportable Injury Frequency Rate includes all employees and contractors per 200,000 hours worked. Harmony excluded 23
from peer group as their metric is not reported.Kinross Gold Corporation March 2021
Competitive Production and AISC Profile
2020A Production 2020A All-In Sustaining Cost
(million ounces) ($ per ounce)
6.0 $1,100
5.0
$1,000
4.0
3.0 $900
2.0
$800
1.0
- $700
Barrick
Kirkland Lake
Barrick
Kirkland Lake
Newmont
AngloGold
Gold Fields
Agnico Eagle
AngloGold
Agnico Eagle
Newmont
Gold Fields
Newcrest
Newcrest
Yamana
Yamana
Kinross
Kinross
Source: FactSet 24Kinross Gold Corporation March 2021
Attractive Value Opportunity
Relative to peers, considering Kinross’ annual production growth, cost
structure and track record
P / 2021E Operating CF EV / 2021E EBITDA
6.6
7.8 7.7 6.3 6.2
7.5
5.8
6.2
5.9 4.7 4.6
5.2 5.1
3.8 3.8 3.7
4.5
4.2
Barrick
Kirkland Lake
Agnico Eagle
Newmont
AngloGold
Gold Fields
Newcrest
Yamana
Kinross
Barrick
Kirkland Lake
Agnico Eagle
Newmont
AngloGold
Gold Fields
Newcrest
Yamana
Kinross
Source: FactSet analyst consensus – March 5, 2021 25Kinross Gold Corporation March 2021
Discounted Valuation Not Justified by Quality of Assets
Kinross has two of the world’s thirteen Tier One assets, with the target of
re-establishing Kinross Russia as a third
Global Tier One Assets by Total Cash Costs
$ 800
$ 600
$ 400
$ 200
-
Percent of 2019 Production from Number of Tier One Assets
58% Tier One Assets 3
40% 37% 2 2
34%
26% 1 1
11%
- - - - - - -
Note: “Tier One” defined as a gold mine with 2021E production more than 500koz., greater than 10 years of mine life and on the lower half
of the Total Cash Cost curve. Kinross Russia based on year when Kupol and Udinsk are operating simultaneously. 26
Source: WoodMac, Kinross Gold Technical ReportsKinross Gold Corporation March 2021
Discounted Valuation Not Justified by Operating Jurisdictions
P/NAV vs. Fraser Institute Ranking (Weighted by NAV)
1.4x
Agnico
1.3x
Analyst Consensus P/NAV
1.2x
Newmont
Barrick
1.1x
Kirkland Lake
1.0x
Gold Fields
0.9x
Newcrest
AngloGold Yamana
0.8x
Kinross
0.7x
60 65 70 75 80
NAV-Weighted Geopolitical Score
1 Market data as at February 17, 2021. Corporate P/NAV based on analyst consensus estimates.
2 Asset-level NAV based on disclosed analyst consensus estimates.
Note: Based on the 2020 Fraser Institute Investment Attractiveness Index. 2019 Fraser Institute Investment Attractiveness Index used for Suriname and 2018 rankings for the
Philippines given the unavailability of 2020 data. Average of all African countries used for selected African countries that do not have 2019 or 2018 Fraser Institute data,
including the Ivory Coast. 27
Source: CIBC Capital Markets, Fraser Institute, Bloomberg Financial Markets, and Thomson One Analytics.Kinross Gold Corporation March 2021
Proven Track Record in Mauritania
Successfully operated for over 10 years
Cumulative production of over 2 million gold equivalent ounces
Established $300 million political risk insurance policy with MIGA
A member of the World Bank
Constructed Phase One
Project successfully commissioned on time and on budget
Operation outperforming expectations
Record annual production and cost of sales in 2020
Approved the capital efficient Tasiast 24k project
Offers attractive returns, increased production and lower costs
$300 million project financing agreement with the IFC, EDC, and two commercial banks
First draw of $200 million received in April 2020
Enhanced partnership with Government administration
Alignment and cooperation during COVID-19
Agreement in principle reached with the Government
Negotiations conducted in environment of mutual fairness; definitive agreements progressing well
28Kinross Gold Corporation March 2021
Proven Track Record in Russia
Kinross has a long and successful 26-year track record investing in Russia
Significant operating experience 2019 Statistics:
• Operated four mines, including the high-grade, low Kinross Investments in Russia
cost Kupol and Dvoinoye mines
98.2% of employees are Russian
o Completed development of Kupol in 2008, and
Dvoinoye in 2013, both on time and on budget
$220 million spent on local goods
• Track record of mine life extensions at both and services providers in Russia
operations $171 million in taxes and royalties
paid to the local and federal
• Continue to prioritize exploration around Kupol and
governments
Dvoinoye
$85 million in wages and benefits
• Understand regulatory and permitting environment paid to employees
• Robust network of suppliers in-country Received a top ranking in
environmental transparency among
• Excellent workforce with strong mining acumen
mining companies by World Wildlife
Fund Russia for four consecutive
years(i)
(i) 2020 statistic 29Kinross Investment Case
Operational Excellence Financial Strength & Flexibility
Diverse portfolio of mines consistently meeting Maintaining a strong balance sheet continues to
or outperforming operational targets be a priority objective
9
Available liquidity of ~$2.8 billion
Met or exceeded Attractive net debt to EBITDA $2.8
annual guidance Investment grade debt billion
Consecutive
Years Quarterly dividend of $0.03/sh Cash Available credit
(i)
Rising Production Robust Free Cash Flow Yield
Growth through low-risk, brownfields projects Analysts forecast an industry-leading profile
Kinross Peer Average
(Million Au eq. oz. +/- 5%)
2.9
Expected Production(1)
20%
2.7
15%
2.4 10%
5%
0%
2021 2022 2023 2021 2022 2023
(1) Refer to endnote #1 Figures for cash and available credit are as at December 31, 2020 30
(i) Free Cash Flow Yield Source: FactSet (March 5, 2021)
Peer group consists of: Agnico Eagle, AngloGold, Barrick, Gold Fields, Kirkland Lake, Newcrest, Newmont, Yamana 30Operations and Projects
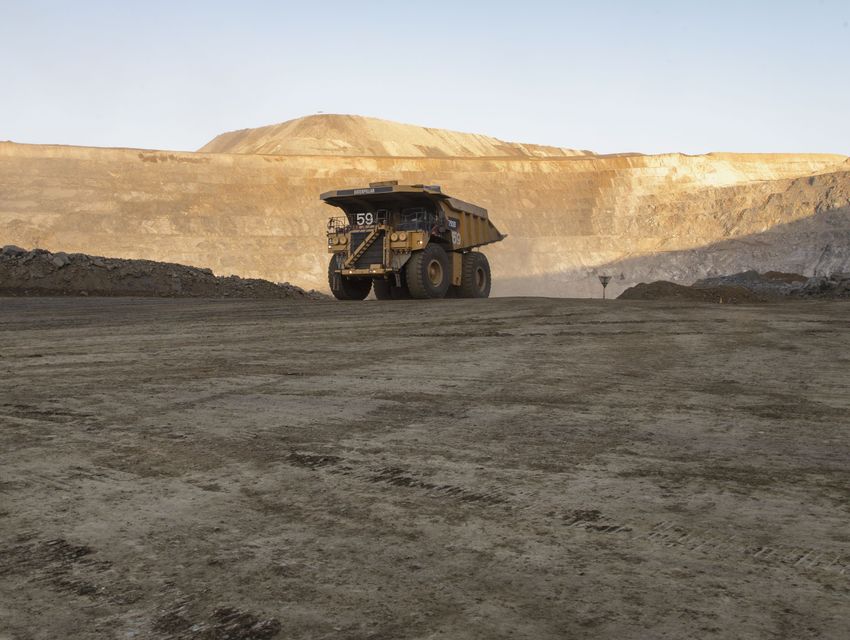
March 2021

     Americas
    2020 Gold Equivalent Production(1)                               Country   Highlights
                                                       Paracatu,               Our largest mine, Paracatu,
                                                       Brazil
                                                                               boasts an attractive cost
                                        23%
                                                                     Brazil    structure supported by
              22%
                                                                               favourable foreign exchange

                      2.4M
                                                        Fort Knox,             ~1/3rd of our production comes
                                                        Alaska                 from Nevada and Alaska – two
                         ounces               10%                    U.S.A.
            23%
                                                                               of the world’s top mining
                                                                               jurisdictions
                                          8%
                           14%
Round Mountain,                                  Bald Mountain,                Planned return to production
Nevada                                           Nevada              Chile     in a favourable mining
                                                                               jurisdiction in 2022
        Americas     West Africa              Russia

                    (1) Refer to endnote #1                                                          32
Americas March 2021
Paracatu, Brazil (100%)
Tier 1 gold mine with a long mine life that extends to 2032
Operating Results(3)
• Paracatu is among the world’s largest 2018 2019 2020
gold operations, with annual throughput
Production
of ~60Mt (Au eq. oz.)
521,575 619,563 542,435
• Continued outperformance driven by: Production cost of
$822 $666 $663
sales ($/oz.)
o improved throughput
o more ounces from the
reprocessing of tailings 2020 Gold Reserve & Resource Estimates(i)
o higher grade ounces from Tonnes Grade Ounces
accelerated mining of the western (thousands) (g/t) (thousands)
area of the pit 2P Reserves 591,559 0.4 8,023
• Potential mine life extensions in light of M&I Resources 309,070 0.3 2,974
the strong operating performance and Inferred
91,262 0.3 914
sizeable resource Resources
(3) Refer to endnote #3
(i) See Appendix 33Americas March 2021
Paracatu – Northwest Extension
Mineralization extends to the west of the existing reserve pit, with the potential
to extend mine life by approximately 4 years
NW Ph1B
Multiple
NW Ph2 pushbacks
being
evaluated to
the west of
Au (g/t)
NW Ph1A A – A’ existing
reserve pit
A’
A
Reserve Pit
34Americas March 2021
Round Mountain, U.S.A. (100%)
Strong cash flow generator with mine life expected to extend to at least 2027
• Estimated mine life: 2024 (mining); Operating Results(3)
2018 2019 2020
2027 (stockpile milling / residual
leaching) Production
385,601 361,664 324,277
(Au eq. oz.)
• Studying potential for future expansions Production cost of
to extend mining into the next decade $728 $695 $688
sales ($/oz.)
with Phase S and Phase X
o Includes pushbacks to the southeast
(S) and to the west (X) beyond Phase 2020 Gold Reserve & Resource Estimates(i)
W Tonnes Grade Ounces
(thousands) (g/t) (thousands)
• Feasibility study for Phase S expected to 2P Reserves 89,168 0.8 2,245
be complete in Q2 2021
M&I Resources 173,376 0.7 3,734
• Scoping study for Phase X expansion Inferred
96,437 0.5 1,563
shows potential at $1,400/oz. Resources
(3) Refer to endnote #3
(i) See Appendix 35Americas March 2021
Round Mountain – Phase S
Potential next pushback on the south side of the Round Mountain pit
Plan view of Round Mountain
• May extend open pit operations until Phase X
2029 and mill life to early 2030s
• Pit optimization scoping study
suggests potential indicated
resource of 900koz. from 2024 to Phase W
2031
• Planning to submit environmental
Phase S
approval in early 2021 for potential
start of mining in 2022
o Drilling is complete Phase S Resources(i)
Tonnes Grade Ounces
o Geotechnical feasibility study (thousands) (g/t) (thousands)
returned favourable results Indicated 39,890 0.71 911
Inferred 1,730 0.33 18
(i) See Appendix 36Americas March 2021
Round Mountain – Phase X
Assessing mineability of potential resource beyond Phase W
• Studying potential for incremental mine • Encountering ounces in Phase W upper deposit
life extensions at $1,400/oz. or higher - potential to add ounces in upper Phase X in
gold prices future model updates
• Infill drilling and conceptual evaluation of
underground potential ongoing
Section view of Phase W and X (facing North)
Phase X Phase W
Current topography
Illustrative
0.2 - 0.5 g/t Heap Leach Ore
> 0.5 g/t Heap Leach Ore
0.4 - 0.9 g/t Mill Ore
> 0.9 g/t Mill Ore
Underground
target
37Americas March 2021
Fort Knox, U.S.A. (100%)
With completion of the Gilmore project, mine life is expected to extend to 2030
• Successfully operating one of the Operating Results(3)
world’s few cold weather heap leaches 2018 2019 2020
• Future production growth driven by Production
255,569 200,263 237,925
(Au eq. oz.)
enhancements to the mine plan,
including accelerating production at the Production cost of
$837 $1,067 $1,054
sales ($/oz.)
Gilmore project to bring ounces forward
• Expect a continuation of strong results
going forward 2020 Gold Reserve & Resource Estimates(i)
• Gilmore construction completed on time Tonnes Grade Ounces
(thousands) (g/t) (thousands)
and under budget
2P Reserves 230,015 0.3 2,471
o First gold poured in January 2021
M&I Resources 267,020 0.3 2,589
Inferred
128,115 0.3 1,057
Resources
(1) Refer to endnote #1
(3) Refer to endnote #3 38
(i) See AppendixAmericas March 2021
Fort Knox – Gil Satellite Pits
Expected to provide near-term, higher grade ore to Fort Knox operation
• Permitting is underway, and feasibility
study results are expected in H1
2021; anticipated first ore to the mill
in Q4 2021
N
Sourdough
• Located 13 km east of Fort Knox North Gil
1 km
• Expected Fort Knox mine plan to
include an estimated 10 million
tonnes of indicated resources at an
average mined grade of 0.60 g/t, at a 2020 Gold Resource Estimates(i)
$1,200/oz. Au planning price Tonnes Grade Ounces
(thousands) (g/t) (thousands)
• Scoping study estimates indicate a
Indicated 29,516 0.56 533
modest $40 million of initial capital
Inferred 4,026 0.49 63
(i) See Appendix 39Americas March 2021
Fort Knox – Manh Choh (formerly Peak, 70%)
High grade, open pit project that is expected to extend Fort Knox’s mill operations
• Development plan contemplates
crushing ore at the project and 2020 Gold Resource Estimates(i)
trucking material to the Fort Knox mill
for processing Tonnes Grade Ounces
(thousands) (g/t) (thousands)
o No special permit required for Measured &
6,441 4.1 846
trucking Indicated
Inferred 941 2.7 81
• Total expected production of
approximately 1 million Au eq.
ounces(i) over 4.5 years at average
mined grade of approximately 6 g/t Metric Kinross Estimate(iii)
(100% basis)
Au eq.
First production 2024
• Expected to extend Fort Knox’s mill Life of mine 4.5 years
life with high grade ounces (~8x the
current average mill grade at Fort Total production (Au eq. oz.) ~1 million
Knox) and increase site cash flow Average AISC(3) (Au eq. oz.) ~$750/oz.
Mined gold grade ~6 g/t
• Near-mine exploration targets on
2,732 km2 mineral lease with goal of Initial capital expenditures ~$110 million
extending mine life
(i) See Appendix
(ii) Production is 100% basis.
(3) Refer to endnote #3 (iii) Preliminary scoping-level Kinross estimates at $1,200 per ounce gold price; 40
scope of project may change following feasibility studyAmericas March 2021
Bald Mountain, U.S.A. (100%)
Forecasting strong near-term cash flow with significant upside potential
• Large mineral resource base with Operating Results(3)
multiple sources of potential mineral 2018 2019 2020
reserve additions that could extend mine Production
life beyond mid-2020s 284,646 187,961 191,282
(Au eq. oz.)
• Mine plan optimized for cash flow Production cost of
$547 $768 $836
sales ($/oz.)
• Expected higher production over the next
three years from the North area
2020 Gold Reserve & Resource Estimates(i)
o Majority of production in 2021 and
2022 from Vantage and Top pits Tonnes Grade Ounces
(thousands) (g/t) (thousands)
o Expansions at North and South 2P Reserves 58,647 0.6 1,143
Duke, Royale and Saga pits
M&I Resources 206,465 0.5 3,592
support 2023 and 2024 output
Inferred
47,776 0.5 695
• Additional studies anticipated to provide Resources
a path to further mine life extensions
(3) Refer to endnote #3
(i) See Appendix 41Americas March 2021
Bald Mountain
Numerous targets within the large land package
• 1.1 million ounces of reserves at $1,200/oz. Resource Pits –
Expected Mine
Potential
Plan to 2024
• Potential to add significant mine life at gold Extensions
prices above $1,200/oz.
N. Duke Royale
o Potential expansions at North and South N. Duke Exp. Royale Exp.
Numbers
Duke, Royale and Saga S. Duke
LJ Ridge
o Further upside could be realized from Winrock
projects at Redbird, Top underground, Galaxy
Yankee satellite deposits and a second Redbird
Bida
pushback at Vantage Rat
Top2B OP
• The large land package offers significant LBM Top UG
exploration upside, with multiple known
mineralized bodies confirmed with drilling Saga 6
Vantage 1 Saga 6 Exp.
o Further work required to delineate these Vantage 2 Gator
resources and potential
Yankee
42Americas March 2021
A Return to Production in Chile
Construction is underway at the La Coipa Restart project and studies are progressing at
Lobo-Marte, which could enable production in a favourable mining jurisdiction beyond 2040
• La Coipa and Lobo-Marte are located in Chile’s Atacama N
(Region III), approximately 650 km north of Santiago
• Both deposits are in the Maricunga Belt, with good access and La Coipa Restart
many mining projects in the area project
50 km
• La Coipa is approximately 50 km northwest of Lobo-Marte and
is fully permitted Water wells
o Construction at La Coipa began in Q1 2020
Lobo-Marte
o Opportunity to share infrastructure and equipment from project
Kinross’ projects in the region – e.g. water supply,
processing equipment and camp
• Combined, the projects have over 7.5 million gold equivalent
ounces(i) of estimated mineral reserves and approximately 3 50 km
million gold equivalent ounces(i) of estimated measured and
Maricunga mine
indicated mineral resources(ii)
33 km
(i) Converted using an 70:1 Au:Ag ratio
(ii) See Appendix 43Americas March 2021
La Coipa Restart Project
Pre-stripping commenced in January 2021; first production on-track for mid-2022
• Leverages existing infrastructure, including plant
and Maricunga mine fleet
• Potential to extend mine life through satellite
deposits
• Project is on schedule:
o Camp refurbishments completed in
December 2020
o Fleet refurbishments over 50% complete
o Mobilization of the project management
team and of the first major contractors for
plant refurbishments have started on
schedule
44Americas March 2021
La Coipa Restart Feasibility Study Results
Project expected to generate a 28% IRR at an assumed gold price of $1,200/oz.
Feasibility Study Estimates
Life of mine production (2022 to 2024) 690,000 gold equivalent ounces
Average production cost of sales(3) $575 per gold equivalent ounce
Average all-in sustaining costs(3) $670 per gold equivalent ounce
Initial capital costs (2020-2021) $225 million
Sustaining capital (2022-2024) $25 million(i)
Au and Ag Price Sensitivity Estimates(4)
$1,200/oz. Au $1,400/oz. Au $1,600/oz. Au $1,800/oz. Au
$17/oz. Ag $18/oz. Ag $19/oz. Ag $20/oz. Ag
IRR 28% 39% 50% 59%
NPV(ii) $118 million $177 million $233 million $290 million
(3) Refer to endnote #3 (i) Excludes sustaining capitalized stripping
(4) Refer to endnote #4 (ii) Based on a 5% discount rate 45Americas March 2021
Lobo-Marte
Project has the potential to support Kinross’ long-term production profile with
attractive all-in sustaining costs
• Substantial resource with 6.4 million higher-
grade gold ounces of estimated probable 2020 Gold Reserve & Resource Estimates(i)
mineral reserves(i)
Tonnes Grade Ounces
• PFS contemplates an open pit, heap leach (thousands) (g/t) (thousands)
and SART plant operation 2P Reserves 146,771 1.4 6,394
• Construction could begin in 2025, with the M&I Resources 98,925 0.7 2,167
opportunity for first production in 2027 after
the conclusion of mining at La Coipa Inferred Resources 13,974 0.6 269
• Reserve grade at Lobo-Marte approximately
2x the average for Kinross’ other mines IRR and NPV estimates at $1,200/oz. gold price pit design(ii)
Kinross Consensus
o ‘Effective grade’(iii) the highest amongst reserve price long-term price Spot price
Kinross’ open pits ($1,200/oz.) (~$1,500/oz.) (~$1,800/oz.)
• Attractive upside given strong leverage to IRR 7% 14% 21%
higher gold prices – mine plans, IRRs and NPV $150 M $770 M $1,355 M
NPVs at various gold prices all use a
$1,200/oz. pit design
(i) See Appendix
(ii) Calculated from January 1, 2024; NPVs based on a 5% discount rate. Key assumptions include: $1,200/oz. gold price, $45/bbl oil price, 800 Chilean
peso to the U.S. dollar, and $2.40/lb copper price. 46
(iii) ‘Effective grade’ factors in strip ratio, calculated as contained gold / tonnes minedAmericas March 2021
Lobo-Marte Pre-Feasibility Study Results
Feasibility study expected to be complete in Q4 2021
Pre-Feasibility Study Estimates Initial Capital Costs ($M)
Life of mine production (million Au oz.) 4.5
Mine equipment $100
Life of mine ore processed (million tonnes) 147
Average grade processed (Au g/t) 1.35 Site development $205
Strip ratio 2.2
Process facilities $210
Average production cost of sales (per Au oz.)(3)(i) $545
Average all-in sustaining costs (per Au oz.)(3)(i) $745 Heap leach $70
Average recovery rate Au 71%
Indirect and other $180
Average processing cost (per tonne) $9.85
Average mining cost (per tonne mined)(ii) $2.20 Sub-total $765
Life of mine average G&A costs (million per year) $30
Sustaining capital, millions per annum(1) Contingency $230
• Infrastructure (average over life of operation) $30
• Stripping (average over 12 years of mining) $45 Total $995
(3) Refer to endnote #3
(i) Calculated with copper production applied as a by-product credit and incorporates a 1.05% NSR royalty (which is capped at $40
million) owned by Sandstorm Gold Royalties. All-in sustaining cost excludes corporate overhead costs. 47
(ii) Includes capitalized stripping costs of $1.10 per tonneMarch 2021
West Africa
2020 Gold Equivalent Production(1) Country Highlights
Tier 1 mine with a large gold
resource located in a
Tasiast, 22%
Mauritania prospective district; 24k
Mauritania project progressing well
2.4M ounces 55% Ghana
Recent exploration success
resulted in mine life extension
17% to at least 2025
6%
Chirano,
Ghana
Americas West Africa Russia
(1) Refer to endnote #1 48West Africa March 2021
Tasiast, Mauritania (100%)
Low-cost mine with a large gold resource located in a prospective district
• Estimated mine life: 2033 Operating Results(3)
2018 2019 2020
• New records set in 2020:
Production
250,965 391,097 406,509
(Au eq. oz.)
o Q4 production of ~111koz.
Production cost of
o Annual production of ~407koz. $976 $602 $584
sales ($/oz.)
o Cost of sales per ounce of $584/oz.(3)
• Lowest cost of sales per ounce of the 2020 Gold Reserve & Resource Estimates(i)
operating portfolio for both Q4 and 2020(3)
Tonnes Grade Ounces
(thousands) (g/t) (thousands)
24k project advancing on schedule
2P Reserves 111,474 1.8 6,330
• ~60% complete as of early February 2021
M&I Resources 75,271 1.1 2,753
• Mechanical work on the processing plant Inferred
4,392 1.9 267
and construction of the power plant both Resources
proceeding well
(3) Refer to endnote #3
(i) See Appendix 49West Africa March 2021
Advancing the Tasiast 24k Project
Building off success of Phase One and continued outperformance of the SAG mill
Project overview Project financing in place
• Modification to existing grinding circuit • Signed $300 million IFC-led project financing
• Additional leaching and thickening capacity agreement in December 2019; first funds of $200
million received in April 2020
• Incremental additions to on-site power
generation and water supply o Non-recourse to Kinross
• Addition of a new larger ball mill no longer Expected Project Milestones
required as 24k project optimizes the grinding
circuit End of 2021 Throughput to ramp up to 21k t/d
• Incorporates operational efficiencies identified in
areas of maintenance, mining, supply chain and
processing Mid-2023 Throughput to reach 24k t/d
Phase One Tasiast 24k Project
Gyratory Ore SAG Additional Existing CIL plant & New tails
crusher stockpile mill Existing leaching refinery thickening
ball mills capacity
50West Africa March 2021
Tasiast 24k Project Feasibility Study Results
The value-enhancing Tasiast 24k project offers attractive estimated returns,
increased production and lower costs
Operating Estimates
Throughput capacity 24,000 t/d
Average annual production (2022 – 2028) 563,000 gold ounces
Production cost of sales(3) (2022 – 2028) $485 per gold ounce
All-in sustaining cost(3) (2022 – 2028) $560 per gold ounce
Mine life 2033
Economics (assuming $1,200 per ounce gold price and $55 per barrel oil price)
Initial capital expenditures $150 million
Note: the $150 million of initial capital shown above does not include non-sustaining capitalized stripping from 2020 – 2029,
which is expected to average approximately $95 million per year.
Internal rate of return(i) 60%
(incremental)
Net present value $1.7 billion
(after tax, 5% discount rate)
(3) Refer to endnote #3 (i) Incremental to 15,500 t/d throughput. 51West Africa March 2021
Tasiast Exploration
World-class orebody and highly prospective district
Northern satellites
• Multiple low strip(i) oxide deposits located 5 - 12 km north
of the Tasiast operation
• Fennec, C67, and C68 are prospective targets for further
drilling
o High grade satellite ore could be milled, deferring
lower grade stockpile feed to after 2025
o Lower grade material could be dump leached
June 2020 500m
West Branch Depth Extension Surface
$1,200/oz
• Higher gold prices could unlock an $1,400/oz
Reserve
Design
additional pushback or inclusion of
Resource
Pit
an underground resource at Tasiast
West Branch
(i) Less than 0.9x 52 52You can also read