Investigating the 7th February, 2021 Landslide Triggered Flash Flood in the Himalayan Region Using Geospatial Techniques
←
→
Page content transcription
If your browser does not render page correctly, please read the page content below

RESEARCH ARTICLE
 European Journal of Environment and Earth Sciences
 www.ej-geo.org

                Investigating the 7th February, 2021 Landslide
            Triggered Flash Flood in the Himalayan Region Using
                            Geospatial Techniques
                             Giribabu Dandabathula, Srinivasa Rao Sitiraju, and Chandra Shekhar Jha

          ABSTRACT
              On 7th February 2021 just before noon, news reports came in regarding a
              flash flood in Rishi Ganga/Dhauli Ganga River in Chamoli district of            Published Online: August 28, 2021
              Uttarakhand state, India. This brief report puts forth the probable causes      ISSN: 2684-446X
              for this flash flood that has originated in the Nanda Devi Biosphere Reserve
                                                                                              DOI :10.24018/ejgeo.2021.2.4.170
              using geospatial datasets and techniques. Datasets obtained from MODIS,
              Sentinel-2B, SRTM, ICESat-2 and ERA5 have been effectively utilized to
              infer the details about this event. Slow drizzle to severe snowfall has been    Giribabu Dandabathula*
              witnessed during 3rd to 6th February 2021 in various parts of the Himalayan     Regional Remote Sensing Centre – West,
              region; even the Rishi Ganga witnessed a heavy snowfall during this time.       National Remote Sensing Centre, Indian
              Data acquired on 10th February shows a scar developed due to a landslide on     Space Research Organisation, Jodhpur,
                                                                                              342001, India.
              the shoulder of Ronti Mountain that was situated on the western rim of the
              Nanda Devi sanctuary. There was a gradual rise in temperature on 7th            (e-mail: dgb.isro@gmail.com)
                                                                                              Srinivasa Rao Sitiraju
              February 2021 at the surroundings of Ronti Mountain that consequently led       Regional Remote Sensing Centre –West,
              to a landslide. The landslide perpetuated a movement under the influence of     National Remote Sensing Centre, Indian
              gravity from ~5900 m to ~3900 m with a mass envelope of ~0.290 km² and a        Space Research Organisation, Jodhpur,
              velocity of 198 m/s that may have taken ~20 seconds to hit the Ronti bank.      342001 India.
              Due to the virtue of heat energy generated during this process resulted in      Chandra Shekhar Jha
              contributing huge moraine filled flood water, that has accelerated towards      Regional Centres Head Quarters, National
              the downstream of Rishi Ganga River and there after Dhauli Ganga River.         Remote Sensing Centre, Indian Space
              Elevation profiles from the ICESat-2 and satellite imageries confirm the pre-   Research      Organisation,  Hyderabad,
                                                                                              500037, India.
              existing conditions of landslide that is inclusive of weathering and erosion
              that led to the unstable condition at transportation back-slope of the Ronti
              Mountain. The triggering factors that influenced this landslide event and       *Corresponding Author
              related causes were investigated in this study and reported herewith.

              Keywords: Dhauli Ganga, Himalayas, India, Landslide, Nanda Ghunti, Rapid
              Snowmelt, Rishi Ganga, Ronti Mountain.

                                                                    Videos circulated on WhatsApp showing water gushing
                        I. INTRODUCTION                             downstream was reported through the media. There were
   Himalayas, stands as the highest mountain peak on Earth          videos that represented the ground events like a wall of water
where snow and icy environmental conditions stands rival to         breaking the bridge and eventually surging into the dams,
those existing at the Polar Regions that are known as the roof      were widely circulated. Initially, various reasons like glacier
of the world, the third pole and water tower of Asia [1]-[3].       break, avalanche and glacial lake outburst floods were
The third pole region influences social and economic                suspected to have caused this flash flood. The flash flood has
development pertaining to the countries that depend on it like      resulted in human loss, sweeping away a 35 MW
India as it plays a pivotal role in ‘water-ice-air-ecosystem-       Hydroelectric project (Run of River type) at the downstream
human’ interactions [1]. In recent times it was reported that       of Ronti Gad (or Raunthi/Rounti Gad), severely damaging an
there has been a significant loss in snow cover change,             under construction Vishnugad hydropower project of 520
permafrost degradation, changing stream flows, decreased            MW in the Tapovan area on Dhauli Ganga River and a large-
precipitation, glacier shrinkage, expansion of glacier lakes        scale devastation along the downstream of Rishi
and increased frequency of extreme climatic events in the           Ganga/Dhauli Ganga. It was later reported that water levels
Himalayan region; all these consequences were attributed to         have significantly reduced in the later part of the day.
climate change and anthropogenic activities [4]-[10]. Mal et           This brief report outlines the probable causes for the flash
al. [11] and Kumar et al. [12] have quantified the amount of        flood that took place on 7th February 2021 in the Rishi Ganga/
recent glacier changes using remote sensing methods.                Dhauli Ganga River streams that had originated in Nanda
   On 7th February 2021 just before noon, news reports              Devi Biosphere Reserve after investigation had been carried
emerged regarding a flash flood in Rishi Ganga/Dhauli               out by using various geospatial data.
Ganga River in Chamoli district of Uttarakhand state, India.

  DOI: http://dx.doi.org/10.24018/ejgeo.2021.2.4.170                                                   Vol 2 | Issue 4 | August 2021   75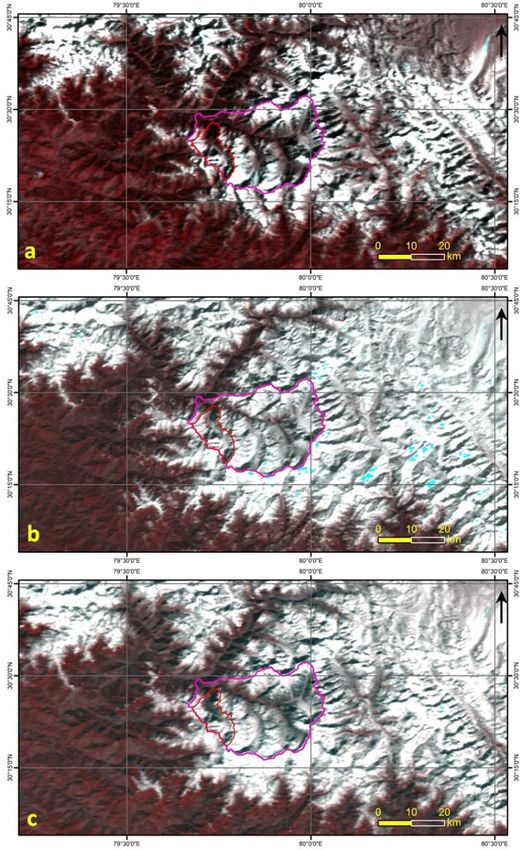
RESEARCH ARTICLE
 European Journal of Environment and Earth Sciences
 www.ej-geo.org

                         II. STUDY AREA                                      Bethartoli, Trishul, Dakshni (South) Nanda Devi and Ronti.
   Nanda Devi group of glaciers falls within the upper Rishi                 Glacier systems containing North Nanda Devi, South Nanda
Ganga catchment (a tributary of Dhauli Ganga river), Central                 Devi, Changabang and Ramani give rise to streams thereby
Himalaya, covering an area of ~690 km 2. Yuji [13] and Jain                  leading to the formation of the Rishi Ganga River. With the
et al. [14] have provided extensive reports pertaining to the                Nanda Devi as a peak (7817 m, 7434 m East) in the region,
geological details of the Nanda Devi region; the area is                     the other peaks like Ronti, Nanda Ghunti and Trisul lies on
composed of rocks belonging to the centre crystalline of the                 the western-south rim of the Nanda Devi; from here, the Ronti
Vaikrita Group like garnetiferous mica schist and garnet mica                Gad stream forms a sub catchment of the Rishi Ganga. Rishi
schists which are well exposed along the Rishi Ganga                         Ganga River enters the lower gorge to merge with the Dhauli
catchment. The catchment is dominated by Higher                              Ganga near Rini village. Fig. 1 shows the extent of Ronti Gad
Himalayan rugged topography with high elevation ridges                       sub-watershed boundary, Rishi Ganga catchment, relief map
adjacent to deep glacial valleys. Prominent glaciers in this                 of Nanda Devi Biosphere Reserve and the location of dams
area are Uttari (North) Nanda Devi, Changbang, Ramni,                        that were damaged due to the flash floods on 7 th February
                                                                             2021.

   Fig. 1. Location of Ronti watershed, Rishi Ganga catchment and the dams that got damaged due to 7th February 2021 flash floods: (a) Map of India
   highlighting Uttarakhand state. (b) Uttarakhand state map highlighting the Rishi Ganga catchment. (c) Ronti Gad watershed boundary, Rishi Ganga
     catchment, dam locations and area where landslide happened shown in a relief map (generated from SRTM) and overlaid with OpenStreetMaps.

  DOI: http://dx.doi.org/10.24018/ejgeo.2021.2.4.170                                                                Vol 2 | Issue 4 | August 2021     76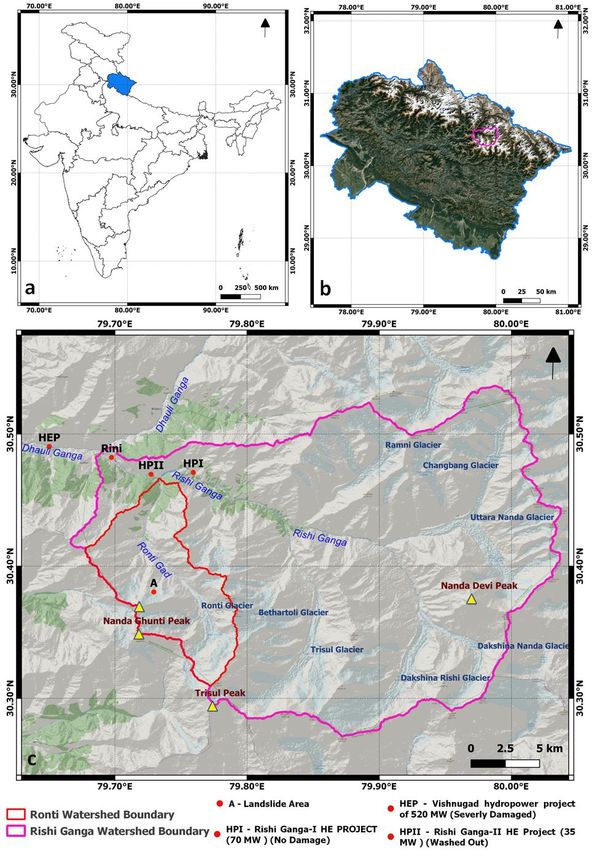
RESEARCH ARTICLE
 European Journal of Environment and Earth Sciences
 www.ej-geo.org

   Earlier scholars like Aitken [15], Bisht [16] and Kapadia
[17] have briefly mentioned the record of historical
summiteers to Nanda Devi region and emphasized the
difficult topographic conditions in this area in terms of
accessibility. Dr. T.G. Longstaff is credited as the first
explorer in this region during 1905 and was later followed by
the surveyors Tilman and Shipton in 1934 [18]. Shipton [19]
has mentioned the experiences of his survey emphasising the
interiors of Rishi Ganga catchment. Lamba [20] and Bisht
[16] have elaborated the details of flora and fauna of Nanda
Devi National Park. Emmons [18], Luvkumar [21] and
Lamba [20] during their independent surveys in this region
have observed collapsed heaps of rubble and glacial debris at
the lower stretches of Ronti glacier giving a hint about the
retreating of the glaciers. Lavkumar [21] mentioned the
existence of coniferous forests growing in the lower stretches
of Ronti valley which is open to moisture-bearing winds from
the lower Dhauli gorge.

    III. DATASETS AND METHOD OF INTERPRETATIONS
   Multi-platform and multi-sensor satellite data, open source
Digital Elevation Models (DEM), space-borne Laser
Altimeter and reanalysed weather data that are disseminated
from various web portals have been used in this study for
identifying the areas of damage, moraine accumulation and
the extent of area where the actual event happened. Table I
                                                                               Fig. 2. Associated datasets and the method of interpretations were done to
shows the summary of datasets that were used in this                            analyse the disaster event occurred on 7th February 2021 in the region of
investigation and Fig. 2 represents the method of                                   Nanda Devi glaciers, Chamoli district, Uttarakhand state, India.
interpretations.

                     TABLE I: DETAILS OF DATASETS USED TO STUDY THE LANDSLIDE EVENT OCCURRED ON 7TH FEBRUARY 2021
                                           IN THE NANDA DEVI BIOSPHERE REGION OF HIMALAYAS.
   S. No.                Dataset                       Specifications                                  Remarks
      1      Moderate Resolution Imaging MOD09QG daily data with 250 Data pertaining to pre and post events were used to
             Spectroradiometer (MODIS)       m spatial resolution which visually interpret and to assess the snow conditions
                                             provides      surface     spectral from 2nd to 8th February 2021.
                                             reflectance      corrected     for
                                             atmospheric conditions in
                                             Red and NIR bands
     2       Sentinel-2B                     Visible and NIR bands @ 10 m Used to assess the areas that got damaged and moraine
                                             spatial resolution                 accumulation due to the landslide event. Data acquired
                                                                                on 1st January 2021, 16th January 2021 and 10th
                                                                                February, 2021 were used in the study.

                                                                                    Additionally, time series analysis has been done using
                                                                                    Sentinel-2B data from the year 2017 till 2020 to
                                                                                    understand the peak seasons for accumulation and
                                                                                    ablation process as well as to understand the snowline
                                                                                    conditions
     3       SRTM                               30 m Digital Elevation Model        Used to understand the topographic features like
                                                                                    elevation, slope and aspect of the study area.
     4       NASA’s       ICESat-2     return   Elevation information from the      High precision elevation profiles were generated from
             photons data                       return photon along-track for       ICESat-2 ATL03 product to understand detailed
                                                every 70 cm.                        topography of Ronti Mountain.
     5       ECMWF        Reanalysis     5th    Regular latitude-longitude grids    ERA5 datasets have been used to assess the surface air
             Generation (ERA5) data             at 0.250*0.250 resolution           temperature in the study area. Hourly datasets from 1 st
                                                                                    to 8th February 2021 were used to analyse the surface
                                                                                    temperature in the Ronti Mountain and surroundings.
     6       News reports and shared videos     --                                  The information from news reports and the shared
             from WhatApp app                                                       videos of WhatsApp were used to assess the ground
                                                                                    situation.

                                                                            250 m spatial resolution has provided an opportunity to assess
                                                                            the snow conditions during pre and post disaster of the event.
  Daily data from MODIS product namely MOD09GQ with                         Satellite imagery of 10 m spatial resolution from Copernicus

  DOI: http://dx.doi.org/10.24018/ejgeo.2021.2.4.170                                                                  Vol 2 | Issue 4 | August 2021   77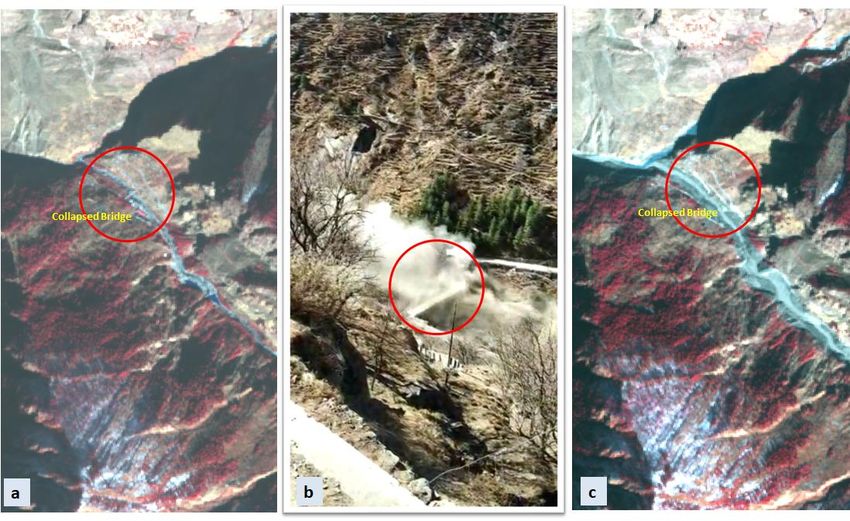
RESEARCH ARTICLE
 European Journal of Environment and Earth Sciences
 www.ej-geo.org

Sentinel-2 mission dated 1st and 16th January 2021, and 10th       Ronti bank. Ronti Mountain is situated on the western rim of
February 2021 have enabled to interpret the core of the event.     Nanda Devi Sanctuary with the elevation peak at 6029 m and
Digital Elevation Models from SRTM and high resolution             has a prominence of 435 metres. Ronti lies 2.4 km North of
along-track profiles from ICESat-2 photon data were used to        Nanda Ghunti (6272 m) which is its nearest higher neighbour.
understand the elevation profiles, slope, and aspect of the        The other neighbours are Bethartoli (6352 m) that lies 6.6 km
study area. Surface air temperature from the climatic              towards East-Northeast, which is 8.4 km North-Northwest of
reanalysis data has helped in assessing the weather settings in    Trisul-1 (7120 m). Nanda Ghunti Glacier flowing west to east
the     study      area      and       finally   the      field    joins Ronti Glacier that flows from south to north. Both the
information/News/WhatsApp videos were used to correlate            glaciers drain down through Ronti Gad and join Rishi Ganga
the reported events in the satellite data.                         after travelling nearly for 5 km. Fig. 5 shows the perspective
                                                                   view of Ronti Mountain and highlights the scar developed
                                                                   due to the landslide event.
  IV. INITIAL ASSESSMENT OF SNOW CONDITIONS IN THE
                    STUDY AREA
   It is understood from various news reports, that heavy to
severe snowfall has been witnessed during 3rd to 6th February
2021 in various sections of Himalayan region; Rishi Ganga
too received fresh snowfall during this period [22], [23].
Daily data of MOD09QG with 250 m spatial resolution
provides the surface spectral reflectance corrected for
atmospheric conditions of Red and NIR bands were used for
assessing the snow conditions in the Nanda Devi Biosphere
region from 2nd to 8th February 2021. Notarnicola et al. [24]
has mentioned the advantages of MOD09GQ products of
MODIS in assessing the snow covered area due to its spatial
resolution and high temporal availability. Fig. 3 shows the
satellite data dated 2nd, 6th and 8th February 2021 over Rishi
Ganga catchment and its surroundings. Severe snowfall that
occurred in the Nanda Devi and surrounding regions is
evident from the data acquired on 6th February 2021. Data
acquired on 8th February 2021 (one day after the disaster)
shows not only the reduction of the snow in the region but
also moraine accumulation happened due to the flash flood at
Ronti Gad, Rishi Ganga and Dhauli Ganga streams. At the
banks of Rishi Ganga (near Rini village), loss of vegetation/or
covered with dust has been observed through the data
acquired on 8th February 2021.
  A. Interpretations and Assessments from the High
  Resolution Satellite Data: Emphasis to find the Cause of the
  Event
   Fig. 4 (a) and 4 (c) shows the satellite data acquired on two
dates, i.e., 16th January and 10th February 2021 pertaining to
Ronti bank and Rishi Gad/Rishi Ganga downstream. Fig. 4
(b) and 4 (d) shows the extent of Ronti Mountain where
before and after the landslide has happened. Changes in the
vegetation cover, moraine accumulation and movement of               Fig. 3. MOD09GQ product of MODIS with spatial resolution of 250 m
boulders have acted as keys to interpret the changes in the        acquired over Nanda Devi Biosphere Reserve in the Himalayan region. (a)
                                                                       Data dated 2nd February 2021. (b) Data dated 6th February showing
satellite data belonging to these two dates. Moraine                 accumulation of high to severe snow fall in the Rishi Ganga region. (c)
accumulation due to flash flood that occurred on 7th February      Data dated 8th February 2021 showing moraine accumulation at the mouth
2021 along Ronti gad/Rishi Ganga stretch is evident as shown                                    of Rishi Ganga.
in Fig. 4 (b). The disturbance caused due to the event has
                                                                      The dimensions of the scar developed due to the landslide
actually been observed from the edge of the Ronti bank
                                                                   event that are measured from the satellite data are ~570 m
(evident from Fig. 4 (d)). It is observed that, beyond the toe
                                                                   (width) and ~1090 m (length) and the total area of the scar
of Ronti bank and towards Nanda Ghunti bank, there are no
                                                                   retrieved from the satellite data is ~ 0.290 km² (~290333 m²).
significant signs of damage. This clearly shows that actual
                                                                   The shape of the scar is in inverted triangular with irregular
impact due to the damage has started from the toe of Ronti
                                                                   sides. The impact area due to the mass fall after the landslide
bank. Thus, emphasis has been given to check for the changes
                                                                   at the toe of Ronti bank is evident in Fig. 4 (d).
in the Ronti Mountain situated on the left side to the toe of

  DOI: http://dx.doi.org/10.24018/ejgeo.2021.2.4.170                                                     Vol 2 | Issue 4 | August 2021   78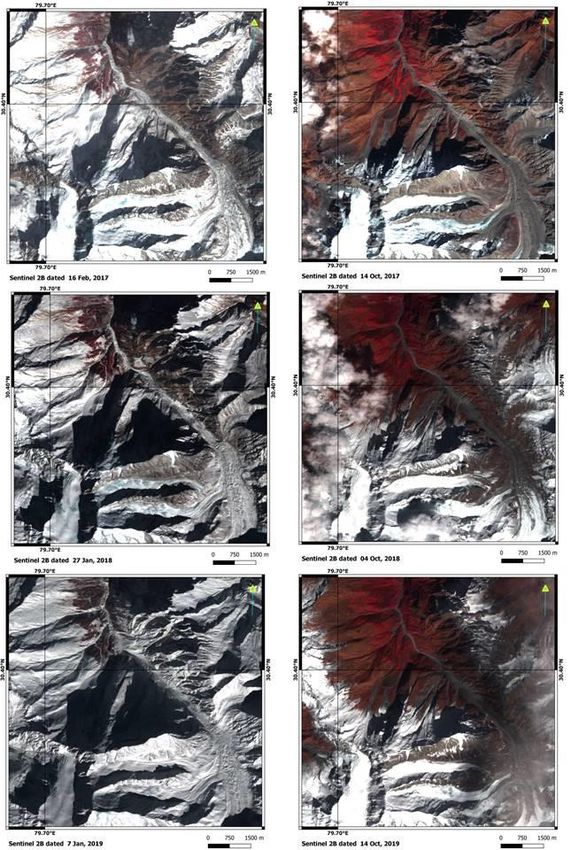
RESEARCH ARTICLE
 European Journal of Environment and Earth Sciences
 www.ej-geo.org

  Fig. 4. (a) Satellite data dated 16th January 2021 showing vegetation cover along the Ronti Gad stream. (b) Fragile part of the area (indicated with yellow
 arrow lines) where landslide happened on 7th February 2021 as seen in the satellite data dated 16th January 2021. (c) Satellite data dated 10th February 2021
showing moraine accumulation due to flash floods that occurred on 07th Feb 2021. The disturbance caused due to the event has actually seen from the toe of
Ronti bank (earmarked in the image in yellow curved line). (d) Part of the area induced with the landslide on 7th February 2021 (indicated with yellow arrow
                                                     lines) as seen in satellite data dated 10th February 2021.
                                  Note the impact area (indicated with olive green) at the toe of Ronti bank due the debris flow.

Fig. 5 Perspective view of Ronti Mountain generated using Digital Elevation Model (DEM) from Shuttle Radar Topography Mission (SRTM) overlaid with
 the satellite data (Sentinel-2B) dated 10th February 2021. Scar developed due to the landslide event on 7 th February 2021 is earmarked with red circle. The
                 yellow-dashed arrow lines represent the fall direction of mass due to the landslide that directed towards the toe of Ronti bank.

   DOI: http://dx.doi.org/10.24018/ejgeo.2021.2.4.170                                                                     Vol 2 | Issue 4 | August 2021   79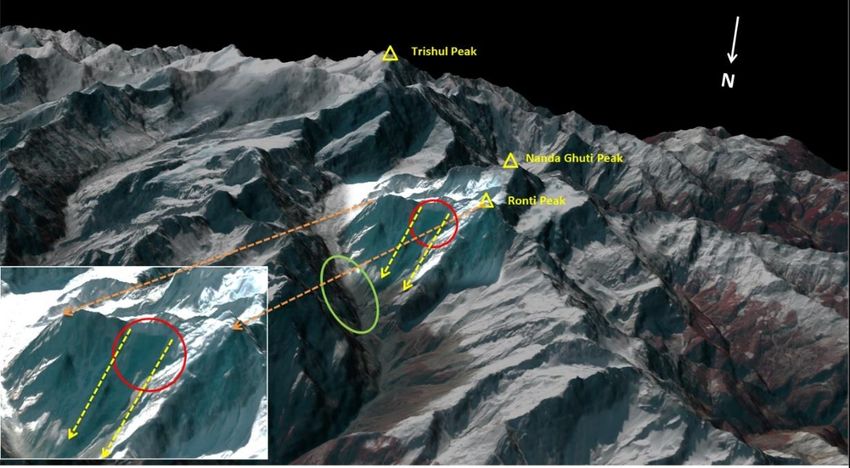
RESEARCH ARTICLE
 European Journal of Environment and Earth Sciences
 www.ej-geo.org

                                                                               45º (with occasional slope cells containing more than 60º) and
  B. Terrain Characteristics of Ronti Mountain using SRTM
                                                                               majority of the mountain’s shoulder is of North-Northeast
  DEM
                                                                               aspect with elevation starting from ~5800 m and touching the
   Global DEMs like SRTM height models are an important                        toe of Ronti bank at 3900 m with a down-travel distance of
component pertaining to the knowledge about our spatial                        2.9 km. The main scarp of the landslide area is starting from
environment and its’ accuracy is sufficient for several                        5600 m from the crest of Ronti Mountain. From the toe of
applications in the fields of ecology, volcanology, glaciology,                Ronti bank with an elevation of 3900 m and along the Ronti
geomorphology and hydrology [25], [26]. In order to perform                    Gad till Rishi Ganga River, the average slope is 33º and
the landslide susceptibility mapping and to study the                          merges with Rishi Ganga at an elevation of 2350 m. Rishi
parameters related to the landslide conditioning factors, the                  Ganga passes through Rini village and merges with Dhauli
terrain information from the DEMs, especially elevation,                       Ganga at an elevation of 1950 m; all along with varying
slope, aspect, gradient and curvature are highly useful [27].                  sloped conditions. Figure 6 shows the terrain profile of Ronti
   In this study, terrain characteristics of Ronti Mountain                    Mountain drawn along the probable track of mass movement
were deduced using SRTM v.3 DEM with 30 m resolution.                          occurred due to 7th February 2021 and also, the profile from
The average slope of the Ronti Mountain’s shoulder where                       the toe of Ronti Mountain bank, along Ronti Gad and Rishi
the scar developed due to the landslide event is approximately                 Ganga stream up to the confluence point at Dhauli Ganga.

Fig. 6. Terrain characteristics of Ronti Mountain were generated using SRTM Digital Elevation Model along the probable track of mass movement occurred
 due to 7th February 2021. (a) Elevation profile of Ronti Mountain starting at 5800 m and reaching the toe of Ronti bank at 3900 m with down travel of 2.9
 km. (b) Pencil sketch of Ronti Mountain illustrating snow melt triggered landslide. (c) Elevation profile from the toe of Ronti Mountain bank, along Ronti
                                           Gad and Rishi Ganga stream up to the confluence point at Dhauli Ganga.

                                                                               namely Advanced Topographic Laser Altimeter System
  C. High Resolution Precise Elevation Profiles from
                                                                               (ATLAS) instrument with return photon counting technology
  ICESat-2 Return Photons over Ronti Mountain
                                                                               [30]. The ATLAS instrument transmits a green (532 nm) laser
   NASA’s Ice, Cloud, and Land Elevation Satellite-2                           pulses at 10 kHz and the spacecraft velocity from the
(ICESat-2) is a continuation to the mission targeted for                       ICESAT-2 nominal ~500 km yields one transmitted laser
studying the Earth’s polar region based on the operational                     pulse for every 70 cm along track. It was reported that
principles of LiDAR technology [28]. Launched in 2018, the                     accuracy at centimetres level can be achieved using ICESat-
applications of ICESat-2 were proposed to extend to other                      2 return photon data by the researchers [31]. Sometimes,
landforms as the data is acquired pertaining to all the surface                based on the surface feature the photons may not reflect back
types like oceans, land, vegetation, and inland water-bodies                   to the sensor; as an example, concave sloped mountain, free
[29]. The speciality of ICESat-2 is that it hosts a solo sensor                face cliffs and crevasses in glaciers [32]-[34].

   DOI: http://dx.doi.org/10.24018/ejgeo.2021.2.4.170                                                                  Vol 2 | Issue 4 | August 2021   80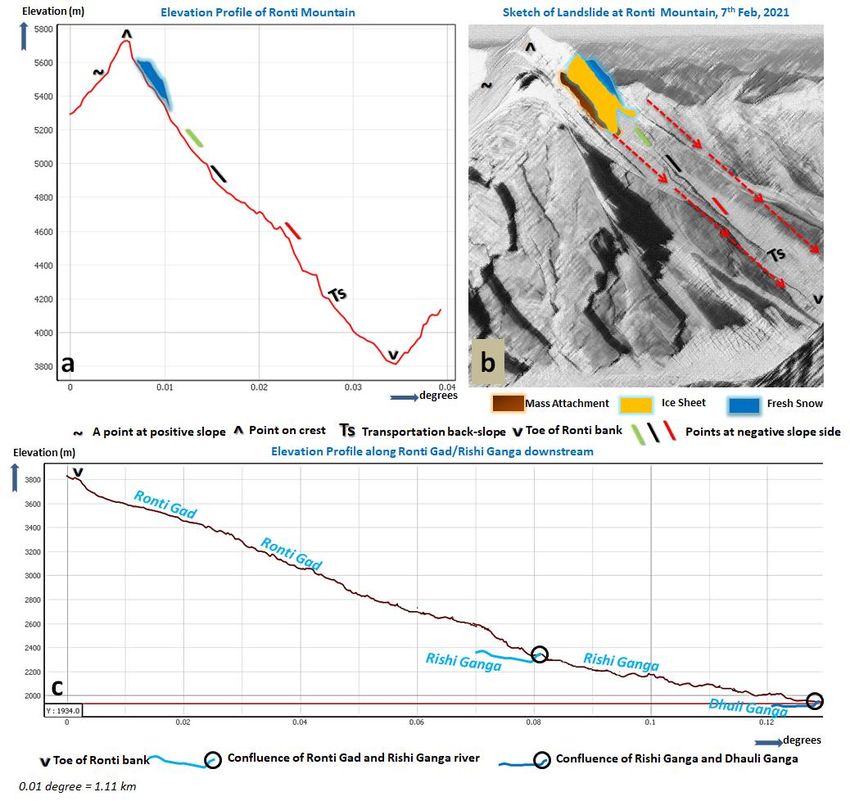
RESEARCH ARTICLE
 European Journal of Environment and Earth Sciences
 www.ej-geo.org

   Fig. 7 shows the elevation profiles that were generated                     disseminated by the European Centre for Medium-Range
from ICESat-2 data for Ronti Mountain using the beams of                       Weather Forecasts (ECMWF) functions as an hourly data on
three separate grounds tracks acquired on different dates                      many atmospheric, land-surface and sea-state parameters
falling in the vicinity to the identified scar. These elevation                through the project namely ECMWF Reanalysis 5 th
profiles confirm the existence of free face cliff for ~200 m of                Generation (ERA5) [35]. ERA5 data is available on regular
length from the crest of the mountain. Incidentally the scar                   latitude-longitude grids at 0.25º * 0.25º resolution, with
observed in the satellite data dated 10th February 2021 was                    atmospheric parameters at 37 pressure levels and offers the
just 200 m below the crest of the Ronti Mountain.                              best agreement and correlation with the real time data [36]. In
                                                                               this investigation, surface air temperature from ERA5 has
  D. Surface Air Temperature before and during the
                                                                               been retrieved near the vicinity of Ronti Mountain from 1 st to
  Landslide Event
                                                                               8th February 2021. Table II gives the reading of surface air
   A climate reanalysis gives a numerical description of the                   temperature and Fig. 8 shows the temperature profiles from
recent climate, assisted by combining models with                              midnight (0100 hrs.) to afternoon (1300 h).
observations. The latest climate reanalysis products

  Fig. 7. High resolution precise elevation profiles from ICESat-2 return photons over Ronti Mountain (a) Satellite data overlaid with the three beams of
photon streams from ICESat-2’s ATLAS sensor over Ronti Mountain. (b) Elevation profile for the ground track dated 27 th March 2019. (c) Elevation profile
   for the ground track dated 24th December 2019. (d) Elevation profile for the ground track dated 12 th Nov 2019. Note the presence of free face cliff of
                                                  approximately 200 m below the crest of Ronti Mountain.

     TABLE II: HOURLY AIR TEMPERATURES RETRIEVED FROM ERA5 FOR RONTI MOUNTAIN AND SURROUNDINGS FROM 1ST TO 8TH FEBRUARY 2021
       Date/Time
                     0100    0200   0300     0400    0500   0600     0700   0800    0900   1000    1100       1200    1300
          (hrs.)
       01-02-2021    -21.8   -21.9  -22.1    -22.2  -22.1   -22.4    -22.1 -19.2    -15.7  -13.5   -12.4      -11.9  -11.6
       02-02-2021    -21.1   -21.3  -21.3    -21.4  -21.6   -21.6    -20.9 -20.9    -17.8  -14.7   -12.7      -11.9  -11.5
       03-02-2021    -22.2   -22.7  -23.5    -23.9  -24.1   -24.4    -24.2 -21.3    -18.2  -16.6   -15.5      -15.2  -14.9
       04-02-2021    -20.7   -21.7  -22.7    -24.4  -23.4   -23.7    -22.8 -20.6    -18.1  -16.6   -15.5      -14.9  -14.6
       05-02-2021    -18.5   -18.5  -18.6    -18.6  -19.2   -19.9    -22.4 -21.5    -19.1  -17.9   -17.5      -17.2  -17.1
       06-02-2021     -25    -25.3  -25.2    -24.5  -24.7   -24.8    -24.4 -21.5    -18.3  -16.7   -15.9       -15   -14.6
       07-02-2021    -20.8   -20.6  -20.6    -20.4    -20   -19.6    -18.9   -16    -12.5  -10.2     -9        -8.4   -7.9
       08-02-2021    -16.5   -16.4  -16.3    -16.1  -16.2   -16.4    -15.8 -12.8     -9.3   -7.4    -6.6       -6.3   -6.1

   DOI: http://dx.doi.org/10.24018/ejgeo.2021.2.4.170                                                                 Vol 2 | Issue 4 | August 2021   81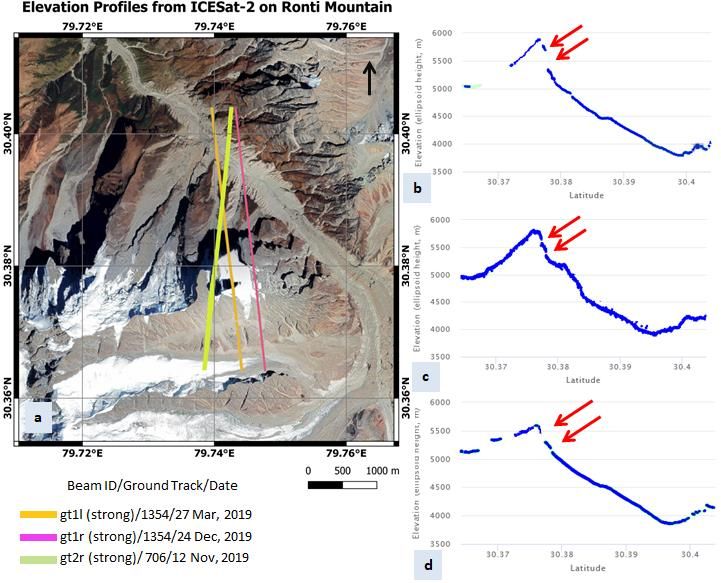
RESEARCH ARTICLE
 European Journal of Environment and Earth Sciences
 www.ej-geo.org

  Fig. 8. Profiles of surface air temperatures based on the hourly data retrieved from ERA5 data for Ronti Mountain and surroundings. Note the abnormal
                           temperatures on 7th February 2021 which is almost 5 ºC greater than the mean temperature of past 5 days.

   The minimum and maximum temperatures recorded from
2nd to 6th Februray 2021 in the region are highly conductive                                              V. DISCUSSION
for snow accumulation; whereas on 7th February 2021 the                          Works done by Lamba [20] and Mal et al. [11] mentioned
temperature settings during sunrise happens to be around 5 ºC                 about Ronti basin as a part of their studies in the Himalayan
which is more than the previous day’s temperature. And by                     region and reported its participation in the glacier retreat
0900 h., the difference with respect to previous day’s                        process and also highlighted the presence of lateral moraines
temperatures is 6 ºC higher.                                                  at the toe of Ronti bank; the participation of retreat process
  E. Dynamics of Snow Accumulation and Ablation over                          and the presence of lateral moraines at the toes indicates the
  Ronti Mountain through Time-series Data                                     overall bedrock erosion and evacuation of rocks/sediments in
   Visual analysis through a time series of Sentinel-2B data                  glaciated basins over several years or decades [41]. A closure
has been performed for Ronti Mountain by giving emphasis                      looks at the Ronti Mountain, in a perspective view composed
on glacier retreat process. At high altitudes, glaciers pile up               with the recent high resolution satellite data and DEM shows
large amounts of snow and ice through the accumulation                        steep walls with eroded and a disintegrated vertical rock face
process during winters. The amount of precipitation leads to                  that gives the evidence of resultant situation of past glacier
snowfall, freezing rain, or wind-drifted snow that accounts                   and erosion activities due to mechanical weathering (like
for the mass accumulation in the glaciers; similarly in the                   freeze-thaw). Over a period of time, hallows due to the
summer, ablation process makes the glaciers to melt,                          disintegration of rocks associated with earlier mass
evaporate, or calving. If the accumulated snow survives for                   movement are filled with the snow and thereby initiates a
one melt season, it forms a denser, more compressed layer                     nivation phenomenon [42]. The shoulder of Ronti Mountain
called firn [37], [38]. The snow and firn are further                         exhibits similar frost conditions in line with its nearest
compressed by overlying snowfall, and then the buried layers                  mountain neighbour Nanda Ghunti (western Trisul Massif)
slowly grow together to form a thickened mass of ice [39],                    and thus, has a similar snow line with that area where scar
[40]. Fig.9 shows the process of accumulation and ablations                   resulted due to the landslide on 7th February 2021. Also, the
in the Ronti Mountain from the years 2017 to 2019. It is                      North-northeast aspect of the Ronti Mountain has made a
observed that the peak of accumulation in Ronti Mountain                      provision of perpetual snow line; however, the lower part of
keeps happening during January and February, and the                          Ronti Mountain is observed to have undergone rigorous
ablation process is completed towards the end of September.                   adjustments due to seasonal snow cover.
The analysis relating to this time series of this accumulation                   Studies from the high resolution elevation profiles
and ablation process has resulted in concluding that the                      generated from ICESat-2 photons in this investigation
North-Northeast facing part of the Mountain’s shoulder, part                  confirm that the part of area where landslide happened is
of free face cliff and upper part of transportation back-slope                overhanging on a steep slope as there is a detachment from
are having perennial snow surfaces. This clearly gives the                    the free face that is aligned to the Crestline of Ronti
evidence of yearly accumulation of layers of compressed                       Mountain; thus the part of area which has induced the
firns and buried layers of thickened mass of ice. A closer                    landslide has to rely on the support of slope strength of the
observation of the high resolution data of recent times reveal                mountain. Heavy to severe snowfall which happened from the
a gap between the free face cliff and the part where scar has                 3rd to 6th February 2021 has resulted in accumulating
developed due to the landslide at the Ronti Mountain.                         snowpack in the study area. Analysis done on the hourly
                                                                              temperature profiles in the study area confirms a rapid
                                                                              increase of temperature in the early noon of 7th February 2021
                                                                              which in turn is the reason for the rapid snowmelt; the case is

  DOI: http://dx.doi.org/10.24018/ejgeo.2021.2.4.170                                                                  Vol 2 | Issue 4 | August 2021   82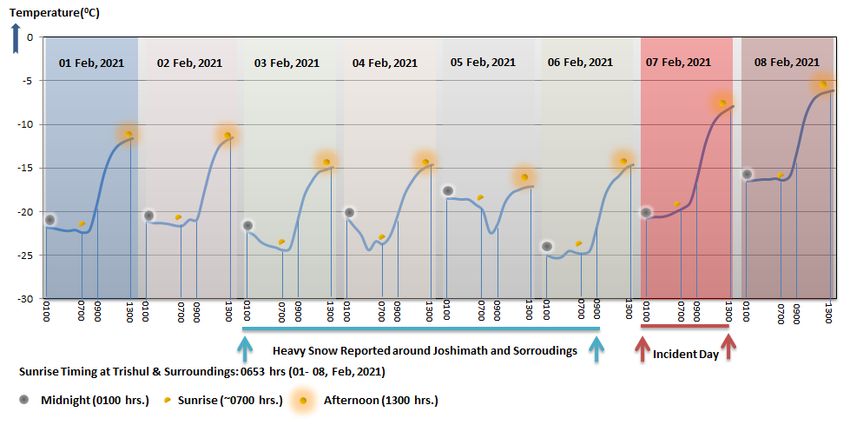
RESEARCH ARTICLE
 European Journal of Environment and Earth Sciences
 www.ej-geo.org

similar to the one mentioned by Pack [43] related to the                         watershed snow cover [44]. Studies done by Cardinali et al.
triggering of landslides in the State of Utah. Rapid snowmelt                    [45] concluded that continuous snowfall regime followed by
runoff is extremely unlikely except in environmentally                           a rapid increase in temperature can trigger landslides where
homogeneous watersheds or during unusual weather                                 fragile zones exist. Similar settings might have triggered
sequences in which sensible heat and condensation heat                           Ronti mountain landslide on 7th February 2021.
energy are added rapidly and uniformly to the entire

  Fig. 9. Process of accumulation (during January-February) and ablations (towards end of September) in Ronti Mountain for the years 2017 to 2019. The
time series analysis of this accumulation and ablation process has resulted in concluding that the North-Northeast facing parts of the shoulder, parts of full-
                                  face cliff and upper part of transportation back-slope are having perennial snow surfaces.

  DOI: http://dx.doi.org/10.24018/ejgeo.2021.2.4.170                                                                       Vol 2 | Issue 4 | August 2021    83
RESEARCH ARTICLE
European Journal of Environment and Earth Sciences
www.ej-geo.org
Ritchie [46] has recognised certain conditions of potential landslide trigger [48]. Melting of a winter snowpack by
landslides where the frozen ground subjected to local thawing sudden warming spells leads to increased infiltration of water
effect by running water. Water from the rapid thawing effect into hillside slopes, thus triggering the landslide activity [47].
and consequent snowmelt may have induced erosion on slope Similar pre-existing conditions and triggering mechanism
support at the shoulder of the Ronti Mountain; thus, the area might have caused the Ronti Mountain’s landslide.
may have lost the support from the slope that is needed for It is evident from the elevation profiles that triggering
the mass attachment at mountain-flank beneath the area factors are functional in initiating the landslide with a mass
where landslide took place. movement influenced by gravity from ~5900 m to ~3900 m
A landslide can result due to geological, morphological, with a mass envelope of ~ 0.290 km² (equivalent to ~55
physical, and human processes; without actually being football fields). With a velocity of 198 m/s (on application of
triggering factors, pre-existing conditions that set the stage free falling object equation) it takes roughly 20 seconds to hit
for triggering of landslides are extremely important [47]. In the toe of Ronti bank, where heat energy generated due to the
the case of Ronti Mountain’s landslide, the pre-existing fall might have generated huge moraine filled water (snow
conditions include weathering and erosion that made the and ice melted) leading to a flash flood. The speed of flood
transport slope completely unstable. water can accelerate and steer its direction based on the
Usually, the triggering mechanisms refer to the external available slope downstream. Thus, the content of flood
stimulus caused by varied reasons and one such reason is material in the form of moraine and water had gushed towards
rapid snowmelt. These external stimuli cause an immediate Rishi Ganga and finally towards Dhauli Ganga River. Figure
or near-immediate response in the form of landslide activity 10 shows the satellite data dated 16th January 2021 and 10th
by rapidly increasing shear stress or pore pressure that February 2021 at the extent of a bridge at Rini Village
furthermore increases the ground acceleration by removing situated at the downstream of Rishi Ganga which got washed
lateral support, reducing the strength of slope materials, and away due to the flash flood that took place on 7th February
initiating the debris-flow activity. However, the short time 2021.
frame of cause and effect is the critical element in defining a
Fig. 10. (a) Satellite data dated 16th January 2021 showing the bridge at Rini Village situated at downstream of Rishi Ganga. (b) A screenshot frame from
WhatsApp video showing the flash flood breaking the bridge at Rini village on 07 th February 2021. (c) Satellite data date 10th February 2021 showing
completely collapsed bridge at Rini village due to flash flood occurred on 7th February 2021.
drawn from this investigation.
VI. CONCLUSIONS • Part of the shoulder belonging to Ronti Mountain
This report sheds light on the possible causes of the flash situated on the western side to the toe of Ronti Bank
flood that happened on 7th February 2021 originating in was the core area of the incident
Nanda Devi region containing a group of glaciers. In order to • There is a presence of a 200 m free face cliff from
instil this, various geospatial data and techniques have been the crest of Ronti Mountain; part of the landslide
utilised to study the environmental settings, triggering occurred on 7th February 2021 that is just below this
factors, identification of landslide site and to understand the free face cliff; concluding that the part is not having
post disaster sequence. The following key findings were any support from the crest
DOI: http://dx.doi.org/10.24018/ejgeo.2021.2.4.170 Vol 2 | Issue 4 | August 2021 84RESEARCH ARTICLE
European Journal of Environment and Earth Sciences
www.ej-geo.org
•Traces of past glacier and erosion activities with considering anthropogenic and climate change aspects. IOP
Conference Series: Materials Science and Engineering. 1020, 012013.
mass movements were inferred at Ronti Mountain [8] Singh, V., Jain, S. K., Goyal, M. K. (2021). An assessment of snow-
through high resolution satellite data glacier melt runoff under climate change scenarios in the Himalayan
• Accumulation of heavy snow for four days before basin. Stochastic Environmental Research and Risk Assessment.
[9] Mir, B.H., Lone, M.A., Kumar, R., Khoshouei, S.R. (2021). Review of
the event and increase of temperature on 7th the implications of changing climate on the water productivity of
February 2021 at the surroundings of Ronti Himalayan Glaciers. Water Productivity Journal, 1, 23-30.
Mountain led to the rapid snowmelt and acted as [10] Nie, Y. et al. (2021). Glacial change and hydrological implications in
the Himalaya and Karakoram. Nature Reviews Earth & Environment.
trigger to the landslide. 2, 91–106.
• The transportation back-slope which was covered [11] Mal, S., Singh, R. B., Schickhoff, U. (2016). Estimating Recent Glacier
with fresh snow accumulation from the previous Changes in Central Himalaya, India, Using Remote Sensing Data. In
Climate Change, Glacier Response, and Vegetation Dynamics in the
four days snowfall and the colluvial foot-slope Himalaya. Springer, Cham. pp. 205–218.
which is approximately at a distance of 2.8 km from [12] Kumar, V., Shukla, T., Mehta, M., Dobhal, D. P, Singh, Bisht, M. P.,
the starting of the landslide scar clearly shows the Nautiyal, S. (2020). Glacier changes and associated climate drivers for
the last three decades, Nanda Devi region, Central Himalaya, India.
effect of destructive impact at the toe of Ronti bank Quaternary International.
due to the large mass movement [13] Yuji, M. (1979). Geology and metamorphism of the Nanda Devi
• Heat energy generated due to this landslide has region, Kumaun higher Himalaya,India. Himalayan Geology, 9, 3-17.
[14] Jain, A.K., Shreshtha, M., Seth, P., Kanyal, L., Carosi, R., Montomoli,
further generated huge moraine filled flood water C., Iaccarino, S., Mukherjee, P.K., Law, R., Singh, S., Rai, S. M.
that has accelerated downstream towards the mouth (2014). The Higher Himalayan Crystallines, Alaknanda–Dhauli Ganga
of Rishi Ganga and later towards Dhauli Ganga Valleys, Garhwal Himalaya, India. In: Montomoli C, Carosi R, Law R,
Singh S, Rai SM (eds) Geological field trips in the Himalaya,
River
Karakoram and Tibet, Journal of the Virtual Explorer.
• The slope conditions at Rishi Ganga have attributed [15] Aitken, B. (1994). The Nanda Devi Affair. Penguin Books India.
to the acceleration of this flash flood downstream [16] Bisht, H. (1994). Tourism in Garhwal Himalaya: With special reference
to mountaineering and trekking in Uttarkashi and Chamoli districts.
towards Dhauli Ganga River especially at Topovan Indus Publishing. India.
The study has harnessed the potential of remote sensing [17] Kapadia, H. (1999). Across Peaks & Passes in Kumaun Himalaya.
and geospatial techniques which has allowed investigation of Indus Publishing. India.
the spatially explicit components of landscape level disaster. [18] Emmons, A.B. (1938), Mapping in the Nanda Devi Basin.
Geographical Review, 28, 59-67.
Integration of optical remote sensing and DEM, have acted as [19] Shipton, E. (1937). More explorations round Nanda Devi.
key tools that allowed undertaking this study in Himalayan Geographical Journal, XC(2), 97-110.
rugged topography. [20] Lamba, B. S. (1987). Status Survey of Fauna. Nanda Devi National
Park. Occasional Paper No. 103. Zoological Survey of India, Calcutta,
India.
[21] Lavkumar, K. S. (1978). Nanda Devi Sanctuary. Journal of the Bombay
ACKNOWLEDGEMENTS Natural History Society, 75, 868-887.
[22] ABPLive. (2021). Snowfall Continues At Kedarnath Dham In
The authors are grateful to Director, National Remote Uttarakhand. https://www.abplive.com/states/up-uk/snowfall-
Sensing Centre, Hyderabad for providing necessary facilities continues-at-kedarnath-dham-in-uttarakhand-1758894. (last accessed
February 2021).
and encouragement to carry out this work. The authors would [23] Amarujala. (2021). Hilly Areas Covered with Thick Layer of Snow.
also like to express their sincere gratitude to Dr. John https://www.amarujala.com/dehradun/uttarakhand-weather-snowfall-
Mathew, ISRO Hq., Bengaluru for his valuable insights news-update-today-hilly-areas-covered-with-thick-layer-of-snow. (last
accessed February 2021).
provided for this work. Authors are indebted to Dr. A.K. [24] Notarnicola, C., Duguay, M., Moelg, N., Schellenberger, T., Tetzlaff,
Bera, Dr. B.K. Bhadra, Suparn Pathak, Dr. Rakesh Paliwal, A., Monsorno, R., Costa, A., Steurer, C., Zebisch, M. (2013). Snow
Sushil Rehpade and Manish Verma of Regional Remote Cover Maps from MODIS Images at 250 m Resolution, Part 1:
Algorithm Description. Remote Sensing, 5, 110–126.
Sensing Centre – West, Jodhpur for critical and helpful
[25] Passini, R. & Jacobsen, K. (2007) Accuracy Analysis of SRTM Height
comments with respect to this study. Models. In Proceedings of 2007 American Society for Photogrammetry
and Remote Sensing Annual Conference, Tampa, FL, USA, 7–11 May
2007. pp. 25–29.
[26] Zandbergen, P. (2008). Applications of Shuttle Radar Topography
REFERENCES Mission Elevation Data. Geography Compass, 2, 1404–1431.
[1] Bahadur, J. (1993). The Himalayas: a third polar region. In Snow and [27] Saleem, N., Huq, M., Twumasi, N. Y. D., Javed, A., Sajjad, A. (2019).
glacier hydrology. Proc. international symposium, Kathmandu, 1992. Parameters Derived from and/or Used with Digital Elevation Models
IAHS; Publication, 218 pp. (DEMs) for Landslide Susceptibility Mapping and Landslide Risk
[2] Yao, T. et al. 2012. Third Pole Environment (TPE). Environmental Assessment: A Review. ISPRS International Journal of Geo-
Development, 3, 52–64. Information. 8, 545.
[3] Bandyopadhyay, J. (2013). Securing the Himalayas as the Water Tower [28] Schutz, B. E., Zwally, H. J., Shuman, C. A., Hancock, D., DiMarzio, J.
of Asia: An Environmental Perspective. Asia Policy, 16, 45–50. P. (2005). Overview of the ICESat Mission. Geophysical Research
[4] Zhang, G., Yao, T., Xie, H., Wang, W., Yang, W. (2015). An inventory Letters, 32.
of glacial lakes in the Third Pole region and their changes in response [29] Brown, M. E., Delgodo, Arias, S., Neumann, T., Jasinski, M. F., Posey,
to global warming. Global and Planetary Change, 131, 148–157. P., Babonis, G., Glenn, N. F., Birkett, C. M., Escobar, V. M., Markus,
[5] Yao, T. et al. (2020). Third Pole climate warming and cryosphere T. (2016). Applications for ICESat-2 Data: From NASA’s Early
system changes. Wolrd Meteorological Organisation Bulletin 69, 35- Adopter Program. IEEE Geoscience and Remote Sensing Magazine, 4,
38. 24–37.
https://library.wmo.int/index.php?lvl=bulletin_display&id=4057#.YD [30] Neuenschwander, A., Pitts, K. (2019). The ATL08 land and vegetation
zERHnhVaR. (last accessed February 2021). product for the ICESat-2 Mission. Remote Sensing of Environment.
[6] Negi, V.S., Thakur, S., Dhyani, R., Bhatt, I. D., Rawal, R. S. (2021). 221, 247–259.
Climate change observations of indigenous communities in the Indian [31] Neuenschwander, A.L., Magruder, L. A. (2019). Canopy and Terrain
Himalaya. Weather, Climate, and Society, 13, 245-257. Height Retrievals with ICESat-2: A First Look. Remote Sensing 11,
[7] Lepcha. P.T., Pandey, P.K., Ranjan, P. (2021). Hydrological 1721.
significance of Himalayan surface water and its management
DOI: http://dx.doi.org/10.24018/ejgeo.2021.2.4.170 Vol 2 | Issue 4 | August 2021 85RESEARCH ARTICLE
European Journal of Environment and Earth Sciences
www.ej-geo.org
[32] Markus, T. et al. (2017). The Ice, Cloud, and land Elevation Satellite-2
(ICESat-2): Science requirements, concept, and implementation.
Remote Sensing of Environment. 190, 260–273.
[33] Herzfeld UC, Trantow TM, Harding D, Dabney PW. (2017). Surface-
Height Determination of Crevassed Glaciers—Mathematical
Principles of an Autoadaptive Density-Dimension Algorithm and
Validation Using ICESat-2 Simulator (SIMPL) Data. IEEE
Transactions on Geoscience and Remote Sensing 55:1874–1896.
Available from: http://dx.doi.org/10.1109/TGRS.2016.2617323.
[34] Smith, B. et al. (2019). Land ice height-retrieval algorithm for NASA’s
ICESat-2 photon-counting laser altimeter. Remote Sensing of
Environment, 233, 111352.
[35] Hersbach, H et al. (2020). The ERA5 global reanalysis. Quarterly
Journal of the Royal Meteorological Society, 146, 1999–2049.
[36] Ramon, J., Lledó, L., Torralba, V., Soret, A., Doblas‐Reyes, F. J.
(2019). What global reanalysis best represents near‐surface winds?
Quarterly Journal of the Royal Meteorological Society, 145, 3236–
3251.
[37] Dibb, J. E. (2004). Snow accumulation, surface height change, and firn
densification at Summit, Greenland: Insights from 2 years of in situ
observation. Journal of Geophysical Research, 109.
http://dx.doi.org/10.1029/2003JD004300.
[38] Shamir, E., Georgakakos, K. P. (2006). Distributed snow accumulation
and ablation modeling in the American River basin. Advances in Water
Resources, 29, 558–570.
[39] Mott, R., Vionnet, V., Grünewald, T. (2018). The Seasonal Snow
Cover Dynamics: Review on Wind-Driven Coupling Processes.
Frontiers in Earth Science. 6.
[40] NSIDC. (2021). The Life of a Glacier.
https://nsidc.org/cryosphere/glaciers/life-glacier.html. (last accessed
February 2021).
[41] Hallet, B., Hunter, L., Bogen, J. (1996). Rates of erosion and sediment
evacuation by glaciers: A review of field data and their implications.
Global and Planetary Change 12, 213–235.
[42] Bendle, J. M, Glasser. N. F. (2012). Palaeoclimatic reconstruction from
Lateglacial (Younger Dryas Chronozone) cirque glaciers in
Snowdonia, North Wales. Proceedings of the Geologists’ Association,
123, 130–145.
[43] Pack, R. T. (1984). Debris flow initiation in Davis County, Utah, during
the spring snowmelt period of 1983. In Twenty-first Annual
Engineering Geology and Soil Engineering Symposium: University of
Idaho, Moscow. pp. 59-78.
[44] Hendrick, R.L., Filgate, B.D., Adams, W. M. (1971) Application of
Environmental Analysis to Watershed Snowmelt. Journal of Applied
Meteorology, 10, 418–429.
[45] Cardinali M, Ardizzone F, Galli M, Guzzetti F, Reichenbach P (2000).
Landslides triggered by rapid snow melting: the December 1996–
January 1997 event in Central Italy. In Proceedings 1st Plinius
Conference on Mediterranean Storms (pp. 439-448). Bios: Cosenza.
http://geomorphology.irpi.cnr.it/publications/repository/public/procee
dings/2000/landslides-triggered-by-rapid-snow-melting-the-
december-1996-january-1997-event-in-central-italy.pdf. (last accessed
February 2021).
[46] Ritchie, A. M. (1958). Recognising and Identification of Landslides.
In: Eckel EB (ed) Landslides and Engineering Practice, Special Report,
29. Washinton. 20-68.
[47] Schuster, R. L., Wieczorek, G. F. (2002), Landslides triggers and types.
In: Stemberk R, Wagner (eds) Proceedings of the 1st European
conference on landslides, Prague. Balkema, Rotterdam. 59–78.
[48] Wieczorek, G. F. (1996). Landslide triggering mechanisms. In:
Landslides: investigation and mitigation (Turner AK, Schuster RL,
eds). Washington DC: Transportation Research Board, National
Research Council, special report. 76–90.
[49] eoPortal. (2021). ICESat-2 (Ice, Cloud and land Elevation Satellite -2).
https://eoportal.org/web/eoportal/satellite-missions/content/-
/article/icesat-2. (last accessed February 2021).
DOI: http://dx.doi.org/10.24018/ejgeo.2021.2.4.170 Vol 2 | Issue 4 | August 2021 86You can also read