Pyrenosetins A-C, New Decalinoylspirotetramic Acid Derivatives Isolated by Bioactivity-Based Molecular Networking from the Seaweed-Derived Fungus ...
←
→
Page content transcription
If your browser does not render page correctly, please read the page content below
marine drugs
Article
Pyrenosetins A–C, New Decalinoylspirotetramic Acid
Derivatives Isolated by Bioactivity-Based Molecular
Networking from the Seaweed-Derived Fungus
Pyrenochaetopsis sp. FVE-001
Bicheng Fan 1 , Pradeep Dewapriya 1 , Fengjie Li 1 , Martina Blümel 1          and
Deniz Tasdemir 1,2, *
 1   GEOMAR Centre for Marine Biotechnology (GEOMAR-Biotech), Research Unit Marine Natural Products
     Chemistry, GEOMAR Helmholtz Centre for Ocean Research Kiel, Am Kiel-Kanal 44, 24106 Kiel, Germany;
     bfan@geomar.de (B.F.); pdewapriya@geomar.de (P.D.); fli@geomar.de (F.L.); mbluemel@geomar.de (M.B.)
 2   Faculty of Mathematics and Natural Sciences, Kiel University, Christian-Albrechts-Platz 4, 24118 Kiel,
     Germany
 *   Correspondence: dtasdemir@geomar.de; Tel.: +49-431-600-4430

 Received: 5 December 2019; Accepted: 9 January 2020; Published: 11 January 2020

 Abstract: Marine algae represent a prolific source of filamentous fungi for bioprospecting.
 In continuation of our search for new anticancer leads from fungi derived from the brown alga Fucus
 vesiculosus, an endophytic Pyrenochaetopsis sp. FVE-001 was selected for an in-depth chemical analysis.
 The crude fungal extract inhibited several cancer cell lines in vitro, and the highest anticancer activity
 was tracked to its CHCl3 –soluble portion. A bioactivity-based molecular networking approach was
 applied to C18 -SPE fractions of the CHCl3 subextract to predict the bioactivity scores of metabolites
 in the fractions and to aid targeted purification of anticancer metabolites. This approach led to a
 rapid isolation of three new decalinoylspirotetramic acid derivatives, pyrenosetins A–C (1–3) and
 the known decalin tetramic acid phomasetin (4). The structures of the compounds were elucidated
 by extensive NMR, HR-ESIMS, FT-IR spectroscopy, [α]D and Mosher’s ester method. Compounds
 1 and 2 showed high anticancer activity against malignant melanoma cell line A-375 (IC50 values
 2.8 and 6.3 µM, respectively), in line with the bioactivity predictions. This is the first study focusing
 on secondary metabolites of a marine-derived Pyrenochaetopsis sp. and the second investigation
 performed on the member of the genus Pyrenochaetopsis.

 Keywords: marine fungus; pyrenosetin; phomasetin; Pyrenochaetopsis sp.; Fucus vesiculosus;
 bioactivity-based molecular networking; decalin tetramic acid

1. Introduction
     Macroalgae (seaweeds) are regarded as holobionts due to their complex epiphytic and endophytic
microbiota [1]. Seaweed-derived fungi are emerging as a promising source of novel bioactive secondary
metabolites for marine bioprospecting. For example, plinabulin, the synthetic tert-butyl analog
of diketopiperazine halimide, which derives from the seaweed-derived fungus Aspergillus sp. [2]
is currently undergoing phase III clinical trials for treatment of non-small cell lung cancer [2,3].
Over the past decades, fungi associated with brown algal genus Fucus have gained attention as
an untapped source of fungal biodiversity [4,5]. A previous study by Flewelling et al. showed
Fucus-associated fungi to produce antimicrobial compounds [6]. Further studies have shown that
Fucus-derived fungi produced secondary metabolites belonging to diverse structural classes and
exhibited further bioactivities. For example, the culture broth of Fucus spiralis-derived fungus Phoma

Mar. Drugs 2020, 18, 47; doi:10.3390/md18010047                            www.mdpi.com/journal/marinedrugs
Mar. Drugs 2020, 18, 47                                                                            2 of 16

sp. yielded the polyketide 5-hydroxyramulosin and 7-methoxycoumarin, which showed anticancer,
antifungal and anti-HIV activities [7,8]. Another study by Lateff et al. (2003) reported a new,
antioxidant isobenzofuranone derivative from Epicoccum sp. associated with Fucus vesiculosus [9].
However, a systematic research exploring bioactive metabolites from fungi associated with Fucus sp. is
still missing.
      Mass spectrometry-based molecular networking (MN) in conjunction with the publicly available
web-platform Global Natural Products Social Molecular Network (GNPS) serves as an automated
tool for mining large volumes of mass spectra. MN uses an untargeted metabolomics approach that
powerfully processes the tandem mass spectrometry (MS/MS) fragmentation data. It is a vector-based
workflow that calculates cosine scores (between 0 and 1) to determine the degree of similarity between
the MS2 fragments. These fragment ions (nodes) will then be organized into relational networks
depending on their similarity [10]. MN has been employed for rapid and successful dereplication
of known compounds from complex natural extracts [11,12]. Another advantage of MN is the
possibility for incorporation of additional information, such as the bioactivity data, over the network.
The bioactivity mapping or bioactivity-based MN have been effectively applied in natural product
research on both crude extracts and fractions obtained therefrom [13,14]. In the latter, a further
bioinformatic program is employed to predict the bioactivity score of molecules according to their
relative abundance in the fractions. Bioactivity-based MN (B-B MN) approach, hence assists rapid
prioritization and targeted isolation of bioactive compounds, thereby accelerating natural product
biodiscovery efforts.
      Fucus vesiculosus is a habitat forming brown alga commonly found in the shallow coastal regions of
Europe. In a recent study, we profiled the surface microbiome and metabolome of the Baltic F. vesiculosus
and identified primary and secondary metabolites, including many fungal metabolites from its surface
and inner tissues by massive MN coupled with DESI-imaging mass spectrometry [15]. We also reported
the isolation and identification of epiphytic and endophytic fungal communities associated with
F. vesiculosus, and applied an OSMAC approach to assess the impact of culture conditions on chemical
space and anticancer potential of these filamentous fungi [12]. A fungal strain belonging to the order
Pleosporales showed anticancer activity with lower toxicity to non-cancerous cells when cultivated in
liquid potato dextrose medium (PDM) [12]. In the continuation of this project, we have now identified
this fungus as a Pyrenochaetopsis sp. (strain FVE-001) by building a phylogenetic tree and comparing
relationship with closely related fungal species. We further focused on isolation and characterization
of its anticancer constituents. For this aim, we applied a B-B MN workflow [14] on the C18-SPE
fractions obtained from the CHCl3 subextract of the fungus for prioritization of the active fractions
and targeted isolation of new bioactive compounds. This approach enabled rapid identification of
three new and one known decalinoyl tetramic acid derivatives, 1–4. Herein we outline the isolation,
structure elucidation and anticancer activities of the compounds 1–4.

2. Results

2.1. Strain Isolation and Identification
     The endophytic fungus FVE-001 was isolated from the thallus of Fucus vesiculosus collected at Kiel
Fjord (Baltic Sea, Germany) [12]. The initial Sanger sequencing of the PCR-amplified ITS1-5.8S rRNA
gene-ITS2 region yielded a total length of 297 bp fragment, which only enabled its identification at
order level, i.e., Pleosporales [12]. In order to further confirm the taxonomic identity of the fungus,
the same genomic DNA extract was re-amplified and sequenced for ITS1-5.8S-ITS2 genes to yield a 394
bp length PCR fragment. The sequence result was subjected to NCBI Blast analysis that showed 100%
sequence similarity to Phoma sp. and 99% sequence similarity to closely related strain, Pyrenochaetopsis
microspore. In order to further validate the taxonomy of the fungus FVE-001, a phylogenetic tree was
constructed with 14 related strains from the NCBI database. As shown in Figure 1, the phylogenetic
tree suggested the fungus FVE-001 to be closely related to Phoma sp. However, in the phylogenetic
Mar. Drugs 2020, 18, 47 3 of 16
tree, FVE-001 did not cluster with the typical Phoma sp., i.e., Phoma neerlandica and Phoma herbarum.
Mar. Drugs 2020, 18, x FOR PEER REVIEW 3 of 16
Further investigation revealed that the closely related Phoma strains MUT 5460, MUT 5462 and
MUT MUT5465 (Figure
5460, MUT 1) 5462
have and
nowMUT
been 5465 (Figureas1)Pyrenochaetopsis
reclassified have now beenleptospora in the
reclassified UNITE database
as Pyrenochaetopsis
(https://unite.ut.ee/sh/SH1525086.08FU#fndtn-panel1) [16]. This confirmed that the fungus [16].
leptospora in the UNITE database (https://unite.ut.ee/sh/SH1525086.08FU#fndtn-panel1) FVE-001
Thisto
be aconfirmed that thesp.
Pyrenochaetopsis fungus FVE-001 to be a Pyrenochaetopsis sp.
Figure Molecular
1. 1.
Figure Molecularphylogenetic
phylogeneticanalysis
analysisby
by maximum likelihoodmethod.
maximum likelihood method.
2.2. Cultivation, Extraction, Bioactivity Test and Molecular Networking
2.2. Cultivation, Extraction, Bioactivity Test and Molecular Networking
Based
Basedon on
thethe results
resultsof of
ourourOne-Strain-Many-Compounds
One-Strain-Many-Compounds (OSMAC) (OSMAC) study study[12],[12],thethefungus
fungus
Pyrenochaetopsis sp. sp.FVE-001 was cultivated at at ◦
22 22C °Cfor for
14 days under shaking (120(120rpm)rpm)
in 2 Linflasks,
Pyrenochaetopsis FVE-001 was cultivated 14 days under shaking 2L
eachflasks, each containing 800 mL PDM liquid medium. The EtOAc extract of the culture brothL(12
containing 800 mL PDM liquid medium. The EtOAc extract of the culture broth (12 in Ltotal)
in
wastotal)
evaporated, and subjected
was evaporated, to a modified
and subjected Kupchan
to a modified partition
Kupchan to yield
partition n-hexane
to yield n-hexane(KH), CHCl
(KH), 3 (KC)
CHCl 3
and(KC)
aqueous MeOH (KM)
and aqueous MeOH subextracts. All threeAll
(KM) subextracts. subextracts were tested
three subextracts wereagainst
testedfive human
against fivecancer
human cell
lines (malignant
cancer melanoma
cell lines A-375;
(malignant lung carcinoma
melanoma A-375; lungA-549; colorectalA-549;
carcinoma adenocarcinoma HT-29; colorectal
colorectal adenocarcinoma
carcinoma HCT-116carcinoma
HT-29; colorectal and breastHCT-116
cancer MB-231),
and breast plus against
cancer non-cancerous
MB-231), plus againsthuman keratinocyte
non-cancerous human cell
keratinocyte
HaCaT cell HaCaT
for assessing for assessing
their cytotoxicity. Thetheir cytotoxicity.
KC subextract The KC
showed subextract
the highest showed
activity the all
against highest
cancer
cellactivity against
lines (>75% cellall cancerinhibition
growth cell lines (>75% cell growth
at 100 µg/mL) inhibition
(Table S1), andatwas 100selected
μg/mL) for (Table S1), and
in-depth was
chemical
selected for in-depth chemical investigations. It was subjected to solid
investigations. It was subjected to solid phase extraction (SPE) on a C18 Sep-Pak cartridge (10% phase extraction (SPE) on a
C18 Sep-Pak cartridge (10% gradient elution from 0% to 100% methanol)
gradient elution from 0% to 100% methanol) to yield 11 fractions. Fractions 5–7 exhibited a promising to yield 11 fractions.
Fractions
activity with 5–7
highexhibited a promising
rates of growth activity
inhibition (upwith
to 99%highatrates of growth
100 µg/mL, inhibition
Table S1). The(up to 99%
fraction at 100
8 showed
μg/mL, Table S1). The fraction 8 showed a moderate inhibition
a moderate inhibition rate (43%) against malignant melanoma cell line A-375 while the rest of therate (43%) against malignant
melanoma
fractions had no cellactivity
line A-375
(Tablewhile
S1). Intheorder
rest to
of investigate
the fractions had
their no activity
chemical (Table
profiles, all S1). In orderwere
11 fractions to
investigate their chemical profiles, all 11 fractions were analyzed by tandem UPLC-QToF-MS/MS
analyzed by tandem UPLC-QToF-MS/MS (positive ion mode) metabolomics using MN. To facilitate the
(positive ion mode) metabolomics using MN. To facilitate the bioassay-guided isolation of 2
bioassay-guided isolation of anticancer metabolites, we integrated the bioactivity and the MS/MS (MS )
anticancer metabolites, we integrated the bioactivity and the MS/MS (MS2) data of the fractions
data of the fractions using the B-B MN workflow [14]. Briefly,2 the acquired MS2 data was processed
using the B-B MN workflow [14]. Briefly, the acquired MS data was processed using MZmine2
using MZmine2 toolbox to detect and assess relative quantification of LC-MS/MS spectral features (ions)
toolbox to detect and assess relative quantification of LC-MS/MS spectral features (ions) across the
across the chromatographic fractions. The processed data was used to calculate a bioactivity score using
chromatographic fractions. The processed data was used to calculate a bioactivity score using the
the Pearson
Pearsoncorrelation
correlationcoefficient
coefficient(r) (r)between
betweenfeature
featureintensity,
intensity,i.e.,
i.e.,the
themolecule’s
molecule’srelative
relativeabundance
abundance
calculated from
calculated the the
from LC-MS
LC-MSpeakpeak(area(area
under the curve)
under acrossacross
the curve) the fraction, and the
the fraction, andanticancer activity
the anticancer
activity of each fraction. The nodes with higher r (>0.75) and lower p (Mar. Drugs 2020, 18, 47 4 of 16
of each fraction. The nodes with higher r (>0.75) and lower p ( 0.75) and a significance (p < 0.05). Since the r value has linear
Figure 2 indicates the statistical significance of bioactivity score, i.e., the largest nodes represent
correlation
moleculesbetween
with strongthe molecule’s relative(rabundance
Pearson correlation > 0.75) and a and the level
significance (p 90%,
diagram (colors
pinkcorresponding
for samples with to theinhibition
bioactivityrate
level90–75%,
of each fraction,
light pink i.e.,for
redsamples
for samples
with with inhibition
inhibition rate75–20%
rate >90%, and
greypink for samples
for inactive with inhibition
samples). In total, rate 90–75%,
10.3% (18 light pink175
of total for nodes)
samplesofwith inhibitionshowed
molecules rate 75–20% and
a statistically
grey for inactive samples). In total, 10.3% (18 of total 175 nodes) of molecules
significant bioactivity score (r > 0.75 and p < 0.05). This approach enabled us to narrow down the showed a statistically
significant bioactivity score (r > 0.75 and p < 0.05). This approach enabled us to narrow down the
potentially active metabolites to 18 nodes (out of 56 nodes) that were detected in the highly active
potentially active metabolites to 18 nodes (out of 56 nodes) that were detected in the highly active
fractions 5–7.
fractions 5–7.
Figure 2. Bioactivity-based
Figure molecular
2. Bioactivity-based networking
molecular of SPE
networking of fractions obtained
SPE fractions from from
obtained chloroform subextract
chloroform
of Pyrenochaetopsis sp. FVE-001. (A) Subcluster of diketopiperazine chemical family detected
subextract of Pyrenochaetopsis sp. FVE-001. (A) Subcluster of diketopiperazine chemical family in MN.
(B) Subcluster
detected inofMN.
decalin family detected
(B) Subcluster in MN.
of decalin Decalinoyltetramic
1–4:detected
family acid derivatives, 5:
in MN. 1–4: Decalinoyltetramic known
acid
derivatives, 5: cyclo-(leu-pro).
diketopiperazine known diketopiperazine cyclo-(leu-pro).Mar. Drugs
Mar. Drugs 2020,
2020,18,
18,47
x FOR PEER REVIEW 55 of
of 16
16
A detailed analysis of the MN permitted the annotation of several fungal metabolites to
A detailed
different analysis
molecular of the (Figure
families MN permitted2). Thethe annotation
biggest clusterof with
several 144fungal
nodes metabolites
consisted toofdifferent
several
molecular families (Figure 2). The biggest cluster with 144 nodes consisted
subclusters (e.g., A and B). The node with the precursor ion m/z 211.1442 ([M + H] , C11H19N2O2) in of several
+ subclusters
(e.g., A and B). The nodeawith theMS/MS
precursor ion m/zmatching
211.1442 ([M + H] + , C H N O ) in subcluster A
subcluster A showed close spectral with GNPS 11spectral
19 2 2library and was
showed a close MS/MS spectral matching with GNPS spectral
annotated as the known diketopiperazine cyclo-(leu-pro) (5) [17]. Three related library and was annotated
nodes as in the known
subcluster
diketopiperazine cyclo-(leu-pro) (5) [17]. Three related nodes in subcluster
A at m/z 209.0637, 241.1498 and 237.1113 that clustered with 5 were also identified as structurally A at m/z 209.0637, 241.1498
and 237.1113
related that clusteredThe
diketopiperazines. withsubcluster
5 were also identified
B, which as structurally
contains the most related diketopiperazines.
of the potential bioactive
The
metabolites revealed a node (m/z 414.2645 [M + H] , C25H36NO4) suggestive of the known afungal
subcluster B, which contains the most of the potential
+ bioactive metabolites revealed node
(m/z 414.2645phomasetin +
[M + H] , C(4)
metabolite 25 H[18]
36 NO(Figure
4 ) suggestive of the
3). This was known
furtherfungal metabolite
confirmed by phomasetin
diagnostic MS/MS (4) [18]
(Figure
fragments 3). This was furthertoconfirmed
corresponding the loss ofbythe diagnostic MS/MS
olefinic side chainfragments corresponding
of the decalin moiety (m/z to the loss ofand
346.2017 the
olefinic side chain of the decalin moiety (m/z 346.2017 and 328.1915) and the
328.1915) and the cleavage of the tetramic acid moiety (m/z 271.2062 and 243.2113). No additional cleavage of the tetramic acid
moiety
spectral(m/z 271.2062could
annotation and 243.2113).
be retrieved Nofrom
additional
GNPSspectral
library for annotation couldnodes
other related be retrieved from GNPS
in the subcluster B.
library for other related nodes in the subcluster B. However, detailed
However, detailed analysis of MS/MS fragmentation patterns suggested that molecules in analysis of MS/MS fragmentation
patterns
subcluster suggested that molecules
B are closely related toinphomasetin
subcluster B are
(4). Theclosely relatedBtoconsisted
subcluster phomasetin (4).highest
of the The subcluster
number
Bofconsisted
potentially of active
the highest
nodesnumber
(15 of totalof potentially active on
18 nodes). Based nodes (15 of totalbioactivity
the significant 18 nodes).score Based ofon the
nodes
significant bioactivity score of nodes at m/z 412.2484 (1) ([M − H O + H] + ) and 412.2488 (2) ([M − H O
at m/z 412.2484 (1) ([M − H2O + H] ) and 412.2488 (2) ([M − 22 +
+ + ) (r values of 0.79, 0.93 and2 p
H]+ ) (rofvalues
+values 2.2 × 10of -30.79,
and0.931.30and× 10p-5values of 2.2 × 10
, respectively)
-3
and and their1.30
close× 10 -5 , respectively) and their close
similarity to phomasetin (4), we
similarity
carried out to phomasetin
a targeted (4), we carried
isolation of theseout a putatively
targeted isolation of these
bioactive putatively
molecules. In bioactive
addition, molecules.
a related
In addition, a related molecule with m/z 428.2434 [M + H] + (3) with low bioactivity score (r value 0.45)
molecule with m/z 428.2434 [M + H] (3) with low bioactivity score (r value 0.45) was also targeted
+
was
due also
to thetargeted due to theto
high probability high probability
be an analoguetoofbe theanmost
analogue
activeofmetabolites.
the most active metabolites.
Figure 3. Chemical
Figure 3. Chemical structures
structures of
of compounds
compounds 1–4.
1–4.
2.3. Purification and Structure Elucidation
2.3. Purification and Structure Elucidation
The comprehensive analysis of the B-B MN revealed fractions 5 and 6 to have the highest relative
The comprehensive analysis of the B-B MN revealed fractions 5 and 6 to have the highest
abundance of targeted molecules. Based on this, fractions 5 and 6 were combined (106 mg altogether)
relative abundance of targeted molecules. Based on this, fractions 5 and 6 were combined (106 mg
and subjected to RP-HPLC separation to afford three new compounds, 1–3 (Figure 3). The known
altogether) and subjected to RP-HPLC separation to afford three new compounds, 1–3 (Figure 3).
The known metabolite phomasetin (4) (Figure 3), which was previously identified by MS/MS basedMar. Drugs 2020, 18, 47 6 of 16
metabolite phomasetin (4) (Figure 3), which was previously identified by MS/MS based dereplication
(see above), was isolated from fraction 7. The chemical structure of phomasetin (4) was confirmed by
comparing its HRMS, NMR (Tables 1 and 2) and [α]D data with those reported in the literature [19].
Compound 1 was isolated as a colorless oil. HR-ESIMS spectrum of 1 contained a molecular ion
peak at m/z 430.2592 [M + H]+ consistent with the molecular formula C25 H35 NO5 requiring 9 degrees
of unsaturation (Figure S7). The FT-IR spectrum implied the presence of hydroxyl and carbonyl groups
(3249–3554, 1683 and 1721 cm−1 , respectively) (Figure S8). The 13 C-NMR data (Table 2, Figure S2)
comprised 25 carbon signals, including four olefinic carbons at δc 127.3, 128.1, 131.8 and 138.8 along
with three carbonyl groups at δC 168.6, 207.2 and 213.3. The 1 H NMR and DEPT-HSQC spectra of 1
(Table 1, Figures S1 and S3) contained signals corresponding to five methyl groups, of which two are
secondary (δH 1.19, d, J = 6.4 Hz, H3 -17; δH 0.90, d, J = 6.5 Hz, H3 -19), one tertiary (δH 0.98, s, H3 -12),
one olefinic (δH 1.73, br s, H3 -18) and one being an N-methyl (δH 3.10, s, H3 -70 ). The DEPT-HSQC
spectrum also confirmed the presence of four diastereotopic methylene protons corresponding to
H2 -7 (δH 0.86 and 1.78), H2 -9 (δH 1.01 and 1.72), H2 -10 (δH 1.04 and 1.42) and the oxymethylene H2 -60
(δH 4.09, dd, J = 12.2, 2.6 Hz and δH 3.92, dd, J = 12.3, 4.8 Hz). Further detected were ten complex
methine protons, six of which appearing at δH 2.57 (H-3, d, J = 11.4 Hz), δH 1.43 (H-8, m), δH 1.82
(H-6, m), δH 1.63 (H-11, m), δH 3.44 (H-13, dd, J = 11.4, 8.6 Hz) and δH 3.57 (H-50 , dd, J = 4.8, 2.6 Hz).
The seventh (oxy) methine proton appeared at δH 4.24 (H-16, m). The remaining three methine protons
were olefinic; two appeared as part of an AB system at δH 5.75 (H-14, dd, J = 15.4, 8.6 Hz) and δH 5.71
(H-15, dd J = 15.4, 4.8 Hz), while the final olefinic methine (H-5) emerged as a broad singlet at δH 5.24
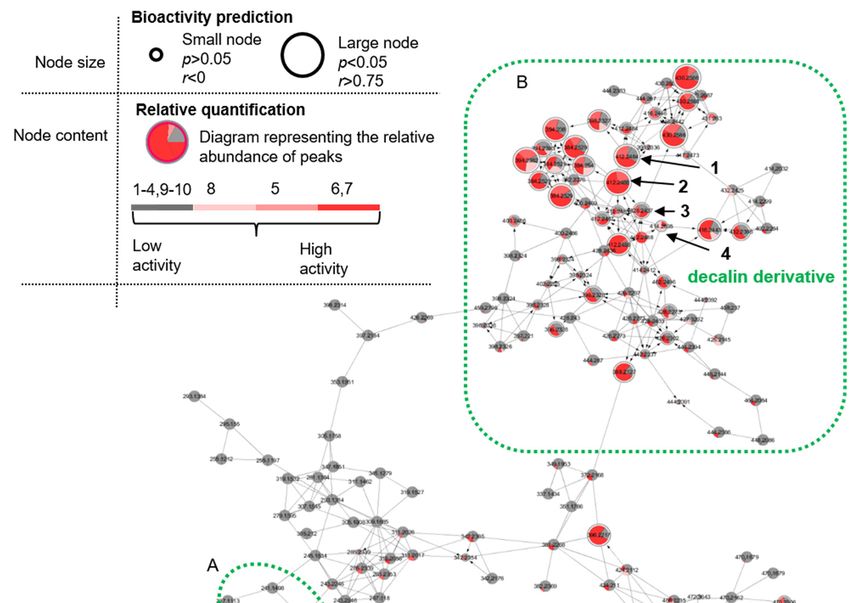
(Figure S1). The 1 H-1 H COSY spectrum of 1 (Figure S4) led to the establishment of three spin systems.
As shown in Figure 4A, the shortest spin system belonged to a hydroxyethyl group including H-50 and
H-60 , while the second spin system was represented by a 16-hydroxypentenyl group (H-13 to H3 -17).
The largest and third COSY spin network corresponded to a substituted methylcyclohexane moiety,
starting with the secondary methyl H3 -19 and ending with the olefinic H-5 (Figure 4A and Figure S4).
Diagnostic HMBC correlations (Figure 4A and Figure S5) observed from H-3 to C-2, C-4, C-11; from
H-5 to C-3, C-7 and C-11; from H-7 to C-5, C-8 and C-9 and from H-11 to C-2, C-6, C-7, C-9 and C-10
permitted the establishment of the bicyclic partial structure, i.e., the unsaturated decalin moiety (rings
A-B, Figure 4A). The olefinic methyl H3 -18 was assigned to C-4 based on the substantial HMBC cross
peaks seen from H3 -18 to C-4, C-5 and C-3. The secondary methyl H3 -19 was already placed at C-8 by
COSY data and HMBC cross-peaks from H3 -19 to C-7, C-8 and C-9 further confirmed its assignment.
The tertiary methyl H3 -12 had to be attached at C-2 on the basis of multiple HMBC correlations of
H3 -12 with C-1, C-2, C-3 and C-11. Additional correlations, i.e., COSY (between H-3 and H-13, H-13
and H-14) and HMBC (between H-3 with C-13, C-14 and C-15), confirmed the attachment of the
16-hydroxypentenyl side chain at C-3 of the decalin ring (Figure 4A, Figures S4 and S5). Further HMBC
correlations from H-50 to C-20 , C-40 and from H3 -70 to C-20 and C-50 established the terminal N-methyl
tetramic acid structure (ring D) (Figure 4A and Figure S5). The long-range (HMBC) couplings detected
between H-13/C-30 and H-13/C-20 confirmed the connectivity of tetramic acid ring to decalin moiety
through a spiro carbon, C-30 (Figure 4A and Figure S5). A key long range coupling between H3 -12/C-1
and H3 -12/C-2 and H-3/C-12 clearly assigned the carbonyl group (δc 213.3) at C-1. This completed the
final ring system, C (Figure 4A).Mar. Drugs 2020, 18, 47 7 of 16
Table 1. 1 H NMR data of compounds 1–4 at 600 MHz.
1a 2a 3a 4b
No.
δH , Mult (J in Hz) δH , Mult (J in Hz) δH , Mult (J in Hz) δH , Mult (J in Hz)
1 - - - -
2 - - - -
3 2.57, d (11.4) 2.73, d (11.4) 2.66, d (11.3) 3.17, br d (9.4)
4 - - - -
5 5.24, br s 5.22, br s 5.28, br.s 5.22, br s
6 1.82, m 1.82, m 1.83, m 1.84, m
7 1.78, m 1.80, m 1.82, m 1.82, m
0.86, m 0.84, m 0.88, m 0.86, m
8 1.43, m 1.44, m 1.44, m 1.51, m
9 1.72, m 1.73, m 1.73, m 1.76, m
1.01, m 0.93, m 0.99, m 1.04, m
10 1.42, m 1.40, m 1.41, m 1.97, m
1.04, m 1.07, qd (12.8,3.4) 1.04, m 1.06, m
11 1.63, m 1.42, m 1.64, td (11.0, 2.7) 1.64 m
12 0.98, s 1.00, s 1.01, s 1.38, br s
13 3.44, dd (11.4, 8.6) 3.26, dd (11.4, 9.4) 3.57, dd (11.4, 9.8) 5.27, dd (13.6, 10.5)
14 5.75, dd (15.4, 8.6) 5.97, dd (15.3, 9.4) 6.85, dd (15.9, 9.8) 5.78, dd (14.6, 10.5)
15 5.71, dd (15.4 4.8) 5.50, dd (15.3, 8.0) 6.18, d (15.9) 5.91, t (12.8)
16 4.24, m 4.18, m - 5.56, dq (14.2, 6.8)
17 1.19, d (6.4) 1.19, d (6.2) 2.22, s 1.67, d (6.8)
18 1.73, br s 1.69, br s 1.68, br s 1.55, t (1.9)
19 0.90, d (6.5) 0.91, d (6.5) 0.90, d (6.2) 0.91, d (6.5)
20 - - - -
30 - - - -
40 - - - -
50 3.57, dd (4.8, 2.6) 3.94, dd (2.7, 1.9) 3.61, dd (4.9, 2.7) 3.61, t (2.7)
60 4.09, dd (12.2, 2.6) 4.08, m 4.10, m 3.87, m
3.92, dd (12.3, 4.8) 3.86, dd (12.4, 2.7) 3.94, m 3.81, m
70 3.10, s 3.07, s 3.11, s 2.97, brs
60 -OH 2.74, m
a Recorded in CDCl3 , b Recorded in CD3 CN.
The relative configuration of the stereogenic centers within 1 was established mainly by NOESY
data (Figure 4B and Figure S6). The NOESY correlations observed between H-6/H-8, H-6/H3 -12,
H3 -12/H-3 and H-11/H-13 revealed the trans junction of the decalin ring, the α-orientation of H-3,
H-6, H-8, H3 -12 and the β-orientation of H-11, H-13 and H3 -19 methyl group (Figure 4B). The large
coupling constant (J14,15 = 15.4 Hz) and the NOESY correlation detected between H-13 and H-15
indicated the E-geometry of the double bond at ∆14(15) . The NOE correlations and the distances (Å)
between relevant protons on the Chem3D optimized model of 1 assisted the assignment of the relative
stereochemistry at C-50 in the tetramic acid portion (Figure 4B, Table S3). The NOE cross-peaks detected
between H-50 /H-15 (distance 2.96 Å) and H-50 /H-17 (distance 3.28 Å) indicated H-50 to be β-oriented.
The absolute configuration of C-16 was determined by Mosher’s ester method [20]. The compound
1 was converted to 16-(S)-MTPA methyl ester (6) and 16-(R)-MTPA methyl ester (7) using (S)- and
(R)-MTPA chloride (Figures S25 and S26). The differences of 1 H NMR chemical shifts around C-16 of 6
and 7 were measured (Table S2, Figure S29). The results of ∆δ (δS– δR ) for H-14 (0.08), H-15 (0.07) and
H3 -17 (−0.08) suggested the absolute configuration at C-16 to be S. Thus, we propose the trivial name
pyrenosetin A for compound 1.Mar. Drugs 2020, 18, x FOR PEER REVIEW 8 of 16
Mar. Drugs 2020, 18, 47 8 of 16
Table 2. 13C NMR data of compounds 1–4 at 150 MHz.
13
1 a 2. C NMR data of
Table 2 acompounds 1–4 at 150
3 a MHz. 4b
Position
δC δC δC δC
1a 2a 3a 4b
1 Position 213.3 (C) 209.8 (C) 212.1 (C) 197.6 (C)
2 54.8 (C)δC δC(C)
54.1 δC54.7 (C) δC 49.9 (C)
3 1 53.6 (CH)
213.3 (C) 52.8
209.8(CH)
(C) 212.153.6
(C) (CH) 197.6 (C) 50.2 (CH)
4 2 131.8 54.8
(C) (C) 54.1 (C)
132.3 (C) 54.7 130.9
(C) (C) 49.9 (C) 132.4 (C)
5 3 128.1 53.6
(CH)(CH) 52.8 (CH)
127.6 (CH) 53.6 128.8
(CH) (CH) 50.2 (CH)127.1 (CH)
6 4 131.8 (C)
37.6 (CH) 132.3(CH)
37.6 (C) 130.937.6
(C) (CH) 132.4 (C) 40.1 (CH)
7 5 128.1
41.9 (CH2) (CH) 127.6 (CH)
42.0 (CH2) 128.8 41.8 (CH2) 127.1 (CH)43.1 (CH2)
(CH)
6 37.6 (CH) 37.6 (CH) 37.6 (CH) 40.1 (CH)
8 33.0 (CH) 32.9 (CH) 32.9 (CH) 34.3 (CH)
7 41.9 (CH2 ) 42.0 (CH2 ) 41.8 (CH2 ) 43.1 (CH2 )
9 35.3 (CH2) 35.3 (CH2) 35.2 (CH2) 36.6 (CH2)
8 33.0 (CH) 32.9 (CH) 32.9 (CH) 34.3 (CH)
10 25.3 (CH2) 25.3 (CH2) 25.2 (CH2) 29.0 (CH2)
9 35.3 (CH2 ) 35.3 (CH2 ) 35.2 (CH2 ) 36.6 (CH2 )
11 10 37.4 (CH)
25.3 (CH2 ) 38.0 (CH)
25.3 (CH2 ) 37.4
25.2 (CH2 ) (CH) 29.0 (CH2 )40.6 (CH)
12 11 15.0 (CH 3 )
37.4 (CH) 15.2 (CH
38.0 (CH) 3 ) 15.2
37.4 (CH) (CH 3 ) 40.6 (CH)14.2 (CH3)
13 12 51.5 (CH)
15.0 (CH3 ) 51.0 (CH)
15.2 (CH3 ) 50.6
15.2 (CH3 ) (CH) 14.2 (CH3131.6
) (CH)
14 13 127.3 (CH)
51.5 (CH) 130.5 (CH)
51.0 (CH) 144.4
50.6 (CH) (CH) 131.6 (CH)133.4 (CH)
15 14 127.3
138.8 (CH) (CH) 130.5
137.8 (CH) 144.4 (CH)
133.9 (CH) 133.4 (CH)
132.1 (CH)
16 15 67.9 138.8
(CH) (CH) 137.8 (CH)
69.0 (CH) 133.9 (CH)
197.6 (C) 132.1 (CH)129.2 (CH)
17 16 67.93)(CH)
23.5 (CH 69.0 (CH
22.9 (CH)3) 197.627.6
(C)(CH3) 129.2 (CH)18.1 (CH3)
18 17 23.5
24.2 (CH3) (CH 3 ) 22.9 (CH
23.9 (CH3) 3 ) 27.6 (CH ) 3) 18.1 (CH3 )22.5 (CH3)
23.73(CH
19 18 24.2
22.4 (CH3) (CH 3 ) 23.9 (CH
22.4 (CH3) 3 ) 23.7 (CH 3 ) 3) 22.5 (CH3 )22.7 (CH3)
22.4 (CH
19 22.4 (CH3 ) 22.4 (CH3 ) 22.4 (CH3 ) 22.7 (CH3 )
2′ 168.6 (C) 168.6 (C) 167.8 (C) 178.1 (C)
20 168.6 (C) 168.6 (C) 167.8 (C) 178.1 (C)
3′ 30 73.1 (C)
73.1 (C) 73.8 (C)
73.8 (C) 72.7
72.7 (C) (C) 101.6 (C) 101.6 (C)
4′ 40 207.2207.2
(C) (C) 205.0 (C) 206.4206.4
(C) (C) 191.5 (C) 191.5 (C)
5′ 50 69.8 (CH)
69.8 (CH) 69.4 (CH) 69.8 (CH)
69.8 (CH) 68.8 (CH) 68.8 (CH)
6′ 60 60.32(CH
60.3 (CH ) 2) 58.3
58.3 (CH
(CH22)) 60.3 (CH ) 2) 59.6 (CH2 )59.6 (CH2)
60.32(CH
70 28.3 (CH3 ) 27.7 (CH3 ) 28.5 (CH3 ) 27.4 (CH3 )
7′ 28.3 (CH3) 27.7 (CH3) 28.5 (CH3) 27.4 (CH3)
a Recorded in CDCl , b Recorded in CD CN.
a Recorded in CDCl33, b Recorded in CD
3
3CN.
Figure 4.
Figure (A) Key
4. (A) Key COSY
COSY (bold),
(bold), HMBC
HMBC (blue)
(blue) correlations
correlations within
within 1. (B) NOESY
1. (B) NOESY (red)
(red) correlations
correlations and
and
distances between H-50 , H-15 and H -17 shown on the Chem3D optimized model of 1.
distances between H-5′, H-15 and H3-17 shown on the Chem3D optimized model of 1.
3
Compound 22 was
Compound was isolated
isolated asas an
an optically
optically active
activecolorless
colorlessoil.
oil.Its
Itsmolecular
molecularformula
formulaCC2525H H3535NO
NO55
deduced by HR-ESIMS (m/z 452.2401 [M + Na] + ) was found to be the same as 1 (Figure S15). A close
deduced by HR-ESIMS (m/z 452.2401 [M + Na]+) was found to be the same as 1 (Figure S15). A close
inspection of
inspection of its
its FT-IR,
FT-IR, 1D 1D and
and 2D2D NMR
NMR spectra
spectra (Figures
(Figures S9–S14
S9–S14 and
and S16)
S16) revealed
revealed that
that 22 had
had thethe
same 2D
same 2D structure
structure asas 1. As depicted
1. As depicted inin Tables
Tables 11 and
and 2, 2, 1D
1D NMR
NMR spectra
spectra of of 22 however
however contained
contained slight
slight
changes in chemical shifts of H-14 (1 δ
changes in chemical shifts of H-14 (1 δHH 5.75 and 2 δH5.75 and 2 δ 5.97) and C-14 (1 δ c 127.3 and
H 5.97) and C-14 (1 δc 127.3 and 2 δC
2 δ 130.5); H-15
C 130.5); H-15
(1 δδH
(1 5.71 and 2 δH 5.50)
H 5.71 and 2 δH
5.50) andand C-15 (1 δδcc 138.8
C-15 (1 and 22 δδC
138.8 and 137.8); and H-16 (1 δ H 4.24
C 137.8); and H-16 (1 δH
and 22 δδH
4.24 and 4.18) and
H 4.18) and
C-16 (1 δc 67.9 and 2 δ C 69.0). These differences were indicative of an opposite
C-16 (1 δc 67.9 and 2 δC 69.0). These differences were indicative of an opposite (R) stereochemistry at (R) stereochemistry at
C-16. The absolute configuration of C-16 was investigated by Mosher’s
C-16. The absolute configuration of C-16 was investigated by Mosher’s method. The chemical shift method. The chemical shift
differences [∆δ(δ
differences [Δδ(δS- δR)])]in
S-δR
the 11H-NMR
in the H-NMRof ofthe
the MTPA
MTPA esters
esters (8
(8 and
and 9)
9) for
for H-14
H-14 (−0.01), H-15 (−0.13)
(−0.01), H-15 and
(−0.13) andMar. Drugs 2020, 18, 47 9 of 16
H3 -17 (+0.04) suggested a 16-R absolute configuration, which was opposite to 1 (Table S2, Figures S27,
S28 and S30). The absence of any NOESY correlation between H-50 and H-15 or between H-50 and H-17
suggested the α-orientation of H-50 . The distances calculated on the 3D structure of compound 2 (with
both α- and β-epimers of H-50 ) (Table S3) supported this assignment. Based on the NOESY spectrum
(Figure S14), the relative configuration of all other chiral centers within 2 was identified to be the same
as in compound 1. We suggest the trivial name pyrenosetin B for compound 2.
HR-ESIMS analysis of compound 3 revealed a molecular ion (m/z 428.2434 [M + H]+ ) that
corresponded to a molecular formula C25 H33 NO5 (Figure S23). This requires 10 degrees of unsaturation.
The FT-IR, 1D and 2D NMR data of 3 closely resembled compounds 1 and 2 (Figures S17–S22 and S24).
The two most striking differences were the absence of H-16 oxymethine resonance in the 1 H-NMR
spectrum of 2, and the appearance of an additional carbonyl singlet at δC 197.6 (C-16) in its 13 C-NMR
spectrum (Tables 1 and 2, Figures S17 and S18). This clearly suggested 3 to be an oxidized analog of 1
and 2. The conversion of the secondary methyl group H3 -17 into a highly deshielded singlet at δH 2.22
(Table 1) indicated that the hydroxyl group at C-16 was replaced by a ketone function. The remarkable
shift of H-14 and H-15 protons to downfield up to +0.8 and 1.0 ppm, respectively, further supported
this assumption (Table 1). Clear HMBC correlations from H-14, H-15 and H3 -17 to C-16 provided the
final proof for the presence of a carbonyl function at C-16. The planar structure of 3 was confirmed
by detailed analysis of 1 H, 13 C, DEPT-HSQC, COSY and HMBC data (Figures S17–S22). The relative
configuration of the chiral centers at C-3, C-6, C-8, C-11, C-2, C-13, C-30 and C-50 within 3 was deduced
to be the same as in 2 by analyzing its NOESY spectrum (Figure S22) and distances between proton
pairs H-50 /H-15 and H-50 /H-17 (Table S3). We suggest the trivial name pyrenosetin C for compound 3.
2.4. Biological Activity of Compounds 1–4
Compounds 1–4 were tested against the human malignant melanoma cancer cells (A-375).
As shown in Table 3, compounds 1 and 2 showed the highest anticancer activity with IC50 values of 2.8
and 6.3 µM, respectively. Compound 3 and the known metabolite 4 were less potent (IC50 140.3 and
37.3 µM). The general toxicity of the isolated metabolites was assessed against the human keratinocyte
cell line HaCaT. Interestingly the IC50 values of 1, 3 and 4 against HaCaT cells were very similar to their
IC50 values against melanoma cells, indicating them to be non-selectively toxic. However, compound 2
exerted lower toxicity towards HaCaT cells (IC50 35.0 µM) with a relatively better selectivity index
around 5.6 (calculated by dividing IC50 value against HaCaT cells / IC50 value against A-375 cells)
compared to other three fungal metabolites.
Table 3. In vitro activity of compounds 1–4 against human malignant melanoma cell line (A-375) and
non-cancerous keratinocyte cell line (HaCaT). The IC50 values are in µM. Positive control: Doxorubicin.
Compound A-375 Cells HaCaT Cells
1 2.8 (±0.0) 4.2 (±0.0)
2 6.3 (±0.0) 35.0 (±0.0)
3 140.3 (±0.9) 142.9 (±1.4)
4 37.3 (±0.1) 45.0 (±0.2)
Positive control 0.6 (±0.0) 22.1 (±2.9)
3. Discussion
Phylogenetic tree analysis confirmed the fungus FVE-001 to be a Pyrenochaetopsis sp. The genus
Pyrenochaetopsis has previously been reported as a close relative of Pyrenochaeta, which is a member of
the family Cucurbitariaceae. The genus Pyrenochaetopsis shows genetic similarity to the genus Phoma,
but their conidiogenesis is considered to be significantly different [21,22]. The chemical machinery of
the genus Pyrenochaetopsis has not received much attention so far. To our knowledge, only one chemical
study has been performed on terrestrial soil fungus Pyrenochaetopsis sp., reporting the isolation of
phomasetin (4) and two new decalinoyl tetramic acids, wakodecalines A and B [18]. A very recent studyMar. Drugs 2020, 18, 47 10 of 16
by Kato et al. (2018) has identified the biosynthetic gene cluster of phomasetin in a Pyrenochaetopsis
sp. RK10-F058 [23]. The wakodecalines A and B showed moderate antimalarial activity against the
Plasmodium falciparum 3D7, but were inactive against cancer cell lines [18]. Phomasetin (4) has been
reported from few fungal genera, e.g., Phoma and Pyrenochaetopsis. It exerts anti-HIV and antitumor
activities against cancer cell lines such as HeLa and HL-60 [18,19]. In this study phomasetin showed
weak antitumor activity, which was associated with general toxicity.
The major drawbacks of the traditional bioassay-guided isolation process include its time
consuming nature and the re-isolation of known compounds. Molecular network-based metabolomics
is emerging as an efficient method in identification of chemical inventory of biological organisms
and dereplication of natural products from crude extracts [11,24]. In our previous work, we used
OSMAC approach to investigate chemical diversity and anticancer activity of fungi associated with
Fucus vesiculosus [12] where we mapped the anticancer activity data of large number of fungal extracts
over the MN and searched for a link between spectral molecular networks and their anticancer
activity [12]. One fungus from this study that was identified herein as Pyrenochaetopsis sp. FVE-001
(order Pleosporales) was selected for work-up, based on its anticancer activity. The combination of both
bioassay-guided fractionation and MN approaches in the form of B-B MN allowed the rapid isolation
of three new compounds 1–3. As expected, pyrenosetins A (1) and B (2) had the highest anticancer
activity, supporting the bioactivity scores obtained by B-B MN at fractionation stage. Pyrenosetin B
(2) that differs from 1 by the stereochemistry of the C-16 hydroxyl group displayed less pronounced
anticancer activity but also lower toxicity. The replacement of the OH group at C-16 with a keto
function in pyrenosetin C (3) was not favorable for bioactivity, leading to a low IC50 value against
A-375 cells. This indicates that the presence of an OH group at C-16 impacts the anticancer and toxic
potential of pyrenosetins A-C.
Compounds 1–3 possess unique decalinoylspirotetramic acid structures characterized by a
trans-decalin ring, a fused spiro system with a carbonyl unit (cyclopentanone) and a terminal tetramic
acid moiety. Bioactive natural products containing trans-decalin ring are common in fungi (e.g.,
genera Fusarium, Penicillium and Alternaria) [25], however, molecules containing a decalin ring with
a terminal tetramic acid structure linked through a spiro ring are rare in Nature. Some known
examples include fusarisetins A and B from a soil-derived Fusarium sp., fusarisetins C-D from a
marine-derived Fusarium sp. [26,27], altercrasins A-E from a sea urchin-derived Alternaria sp. [28].
Wakodecalines A and B obtained from the terrestrial soil fungus Pyrenochaetopsis sp. RK10-F058 possess
a N-methylated serine moiety instead of the terminal tetramic acid ring [18]. Interestingly some
Fusarium sp. [29] contain equisetin, the enantiomeric homolog of phomasetin, which possesses totally
opposite stereochemistry in all chiral centers. Such compounds have been proposed to be mixed
biosynthesis products of PKS and NRPS pathways [23]. Despite the structural similarities, biosynthesis
of decalin derivatives is highly controlled by stereospecific enzymes [19,30]. A recent study by Kato et
al. (2018) reported that the stereospecific enzyme fas2 determines the formation of the trans-decalin ring
in equisetin (and fusarisetin), while phm7 enzyme controls the biosynthesis of the trans-decalin ring in
the enantiomeric homolog phomasetin (4) [23]. In this study, we isolated phomasetin (4) and three
new related metabolites 1–3 from Pyrenochaetopsis sp. FVE-001. This is the first chemical study carried
out on a marine-derived Pyrenochaetopsis sp. and the second investigation performed on a member of
the genus Pyrenochaetopsis. Although the anticancer activity the compounds 1 and 2 is associated with
cytotoxicity, a medicinal chemistry approach in future may improve their potency and selectivity.
4. Material and Methods
4.1. General Procedures
NMR spectra were recorded on a Bruker AV 600 spectrometer (600 and 150 MHz for 1 H- and
13 C-NMR, respectively, Bruker® , Billerica, MA, USA) or a Bruker Avance III spectrometer (500
and 125 MHz for 1 H- and 13 C-NMR, respectively). The residual solvent signals were used asMar. Drugs 2020, 18, 47 11 of 16
internal references: δH 7.26/δC 77.2 ppm (CDCl3 ), δH 1.94/δC 118.3 and δC 1.3 (CD3 CN). 4-Dimethyl-
4-silapentane-1-sulfonic acid (DSS) was used as internal standard. High-resolution MS2 data were
recorded on a Xevo G2-XS QTof Mass Spectrometer (Waters® , Milford, MA, USA) coupled to a Waters
Acquity I-Class UPLC system). HR-ESIMS was recorded on a Bruker microTOF II-High-performance
TOF-MS system equipped with an electrospray ionization source. Solid phase extraction (SPE) was
performed on the Chromabond C18 SPE cartridges (6 mL/2000 mg, Macherey-Nagel, Duren, Germany).
HPLC separations were performed on a VWR Hitachi Chromaster system (VWR International, Allison
Park, PA, USA) consisting of a 5430 diode array detector (VWR International, Allison Park, PA, USA),
a 5310 column oven, a 5260 autosampler and a 5110 pump combined in parallel with a VWR Evaporative
Light Scattering Detector (ELSD 90). Routine HPLC separations were performed on semipreparative
(Onyx, 100 × 10 mm, Phenomenex, Torrance, CA, USA) C18 monolithic column, analytic (SeQuant® ,
250 × 4.6 mm, Merck, Darmstadt, Germany) ZIC-HILIC column and analytic (SynergiTM , 4 µm,
250 × 4.6 mm, Phenomenex) polar-RP 80 Å LC column. The water used was MilliQ-water produced
by in-house Arium® Water Purification Systems (Sartorius, Germany). EtOAc, n-hexane, methanol
and acetonitrile were purchased from VWR International GmbH (Hannover, Germany). Potato extract
and dextrose that were used for culture medium were purchased from Sigma-Aldrich (Schnelldorf,
Germany) and from Merck, respectively. Agar was purchased from Applichem (Darmstadt, Germany).
(S)- and (R)-MTPA chloride were purchased from Merck. The 3D structures of compounds 1–3 were
obtained by using ChemBio3D Ultra 12.0 software (PerkinElmer, Waltham, MA, USA).
4.2. Strain Identification and Cultivation
The fungal strain was isolated from Fucus vesiculosus specimens collected in Falckenstein Beach
(54◦ 230 22.600
N, 10◦ 110 26.400 E), Kiel Fjord, Baltic Sea, Germany in December 2015 [12]. The fungus
was identified using ITS-5.8s rRNA sequencing to species level through building phylogenetic tree
(Figure 1). The evolutionary history was inferred by using the Maximum Likelihood method based
on the General Time Reversible model [31]. The percentage of trees in which the associated taxa
clustered together is shown next to the branches. Initial tree(s) for the heuristic search were obtained
automatically by applying Neighbor-Join and BioNJ algorithms to a matrix of pairwise distances
estimated using the Maximum Composite Likelihood (MCL) approach, and then selecting the topology
with superior log likelihood value. A discrete Gamma distribution was used to model evolutionary
rate differences among sites (5 categories (+G, parameter = 0.8198)). The rate variation model allowed
for some sites to be evolutionarily invariable ([+I], 37.97% sites). The tree is drawn to scale, with
branch lengths measured in the number of substitutions per site. The analysis involved 14 nucleotide
sequences. Evolutionary analyses were conducted in MEGA7 [32]. The fungal sample was deposited
at the GEOMAR-Biotech laboratory (Kiel, Germany). The strain was cultured on potato dextrose
agar (PDA: potato extract 4 g, dextrose 20 g, agar 15g for 1 L, pH 5.6). After 3 days of pre-culturing,
the conidia was inoculated in 500 mL cylindrical flasks containing 100 mL of seed medium (PDM:
potato extract 4 g, dextrose 20 g for 1 L; pH 5.6) incubated at 22 ◦ C for 7 days on a rotary shaker at
120 rpm.
4.3. Extraction and Isolation
The 12 L of culture broth was partitioned with the same volume of EtOAc twice. The resulting
organic extract was evaporated in vacuo to afford light yellow oily extract (2.66 g). The crude extract
was subjected to a modified Kupchan partition to yield three subextracts, namely n-hexane (KH,
1.99 g), CHCl3 (KC, 345.4 mg) and aqueous MeOH (KM, 68.7 mg). Briefly, the crude extract was
dissolved in 500 mL aqueous methanol (90% MeOH) and partitioned against n-hexane (KH, 2 × 500 mL).
The MeOH content of the aq. MeOH phase was increased to 30% before partitioning against CHCl3
(KC, 2 × 500 mL). The KC subextract showed relatively high anticancer bioactivity against all five
cancer cell lines (>75% inhibition rate at 100 µg/mL) and was fractionated on a Chromabond C18
SPE cartridge. A 10% stepwise gradient elution with MeOH: H2 O mixtures (0% to 100%) afforded 11Mar. Drugs 2020, 18, 47 12 of 16
fractions (fraction 0–10). Anticancer activity was tracked to fractions 5–7. The fraction 5 (92.7 mg) and
fraction 6 (13.3 mg) were combined and subjected to semi-preparative RP–HPLC, eluting with MeCN:
H2 O (40% isocratic MeCN over 28 min, and gradual increase to 60% by 40 min, flow 3.0 mL/min)
to yield 7 subfractions (fraction 5.1 to 5.7). Subfraction 5.4 contained the pure compound 1 (2.4 mg,
tR 16.5 min). Fraction 5.7 (3.6 mg) was rechromatographed by RP-HPLC (isocratic mixture H2 O: MeCN
(45:55, flow 1.0 mL/min) to yield 2 (1.2 mg, tR 8.0 min) and 3 (0.8 mg, tR 9.5 min). The fraction 7 (25.4 mg)
was subjected to a semi-prep. RP–HPLC (65% isocratic MeCN over 30 min, and gradual decrease
to 60% MeCN to 60%MeCN by 35 min, flow 3.0 mL/min) to yield 5 subfractions (fraction 7.1–7.5).
Fraction 7.4 (12.9 mg) was separated on HPLC equipped with an analytical HPLC column (SynergiTM ,
250 × 4.6 mm, Phenomenex) using MeCN:H2 O (50% isocratic MeCN over 6 min and gradual increase
to 78% MeCN by 12 min (flow 1.0 mL/min)) to yield 4 (1.4 mg, tR 6.5 min) in a pure state.
Pyrenosetin A (1): Colorless oil; [α]22
D
+30 (c 0.10, MeOH); IR (oil) vmax 3554, 3249, 2952, 2875, 1721, 1683,
1456, 1378, 1271 cm−1 ; 1 H-NMR (CDCl3 , 600 MHz) and 13 C-NMR (CDCl3 , 150 MHz), Tables 1 and 2;
HR-ESIMS found m/z [M + H]+ 430.2592, C25 H36 NO5 , calculated for 430.2588.
Pyrenosetin B (2): Colorless oil; [α]22
D
+13 (c 0.10, MeOH); IR (oil) vmax 3550, 3185, 2944, 2862, 1726, 1675,
−1
1456, 1378, 1249 cm ; H-NMR (CDCl3 , 600 MHz) and 13 C-NMR (CDCl3 , 150 MHz), Tables 1 and 2;
1
HR-ESIMS found m/z [M + Na]+ 452.2401 C25 H35 NO5 Na, calculated for 452.2407.
Pyrenosetin C (3): Colorless oil; [α]22
D
+12 (c 0.10, MeOH); IR (oil) vmax 3559, 3259, 2952, 2858, 1726, 1683,
1451, 1369, 1253 cm−1 ; 1 H-NMR (CDCl3 , 600 MHz) and 13 C-NMR (CDCl3 , 150 MHz), Tables 1 and 2;
HR-ESIMS found m/z [M + H]+ 428.2434, C25 H34 NO5 , calculated for 428.2431.
Phomasetin (4): Colorless oil; [α]22
D
+116 (c 0.15, CDCl3 ); 1 H-NMR (CD3 CN, 600 MHz) and 13 C- NMR
(CD3 CN, 150 MHz), Tables 1 and 2; HR-ESIMS found m/z [M + H]+ 414.2645, C25 H36 NO4 , calculated
for 414.2639.
4.4. UHPLC-QToF-MS/MS Analysis and Molecular Networking
The SPE fractions derived from the KC subextract were analyzed on an ACQUITY UPLC I-Class
System coupled to the Waters® Xevo G2-XS QToF Mass Spectrometer equipped with an electrospray
ionization (ESI) source operating with a mass range of m/z 50–1600 Da. The 0.1 mg/mL MeOH solution
of each fraction was filtered through a 0.2 µm PTFE syringe filter (Carl Roth, Karlsruhe, Germany) and
then injected (injection volume: 0.2 µL) into the system that equipped with Acquity UPLC HSS T3
column (High Strength Silica C18, 1.8 µm, 100 × 2.1 mm I.D., Waters® ) operating at 40 ◦ C. Separation
was achieved with a binary LC solvent system controlled by MassLynx® (version 4.1) using mobile
phase A (99%) water/ 0.1 % formic acid (ULC/MS grade) and B 99.9% ACN/ 0.1% formic acid (ULC/MS
grade), pumped at a rate of 0.6 mL/ min with the following gradient: initial, 1% B; 0.0–6.0 min to 30%
B; 6.0–11.5 min to 100% B; 11.5–13.5 min 100% B, and a column reconditioning phase until 15 min.
ESI conditions were set with the capillary voltage at 0.8 kV, sample cone voltage at 40.0 V, source
temperature at 150 ◦ C, desolvation temperature at 550 ◦ C, cone gas flow in 50 L/h and desolvation gas
flow in 1200 L/h. MS/MS setting was a ramp collision energy (CE): low CE from 6 eV to 60 eV and high
CE from 9 eV to 80 eV. As a control, solvent (methanol) was injected. MassLynx® (Waters® , V4.1) was
used to analyze the achieved MS and MS2 data.
The raw data were converted to mzXML file format using MSConvert (version 3.0.10051, Vanderbilt
University, Nashville, TN, USA). The resulting mzXML data were processed in MZmine2 (version
2.32). Mass lists were created using the mass detection module with a noise level of 1500 counts for
MS1 and 10 counts for MS2 . The chromatogram builder module was used to create peak lists with a
scan retention time from 0.01 min to 13.0 min, a minimum retention time of 0.01 min, a minimum peak
height of 10,000 counts and an m/z tolerance of 0.01 Da or 10 ppm. The peak lists were deconvoluted
using the local minimum search algorithm with the following parameters: chromatographic threshold
0.01%, search minimum in RT range 0.20, minimum relative height 0.01%, minimum absolute heightMar. Drugs 2020, 18, 47 13 of 16
1000 counts, minimum ratio of peak top/edge 2, peak duration range 0.01–3 min. For MS2 scan pairing,
the m/z range was set to 0.05 Da and retention time range to 0.2 min. Furthermore, the deconvoluted
peak lists were deisotoped with the following parameters: m/z tolerance 0.02 or 10 ppm, retention time
tolerance 0.01 min and maximum charge 2. The deisotoped peak lists were aligned through using
the Join aligner module with an m/z tolerance of 0.01 Da or 10 ppm and a retention time tolerance of
0.2 min. Weight for m/z and retention time were both set to 50. The aligned peak list was filtered to
exclude peaks derived from solvent and peaks with m/z lower than 125 Da. The peak ID’s were lastly
reset and the peak list was exported as mgf file for GNPS analysis. The reset peak list was exported as
CSV table file for bioactivity score analysis.
The adjusted mgf files were uploaded to GNPS for molecular networking analysis. A molecular
network was created with the feature based molecular networking work flow (https://ccms-ucsd.github.
io/GNPSDocumentation/featurebasedmolecularnetworking/) on the GNPS website (http://gnps.ucsd.
edu) [33]. The data was filtered by removing all MS/MS fragment ions within ±17 Da of the precursor
m/z. MS/MS spectra were window filtered by choosing only the top 6 fragment ions in the ±50 Da
window throughout the spectrum. The precursor ion mass tolerance was set to 0.02 Da and a MS/MS
fragment ion tolerance of 0.02 Da. A network was then created where edges were filtered to have
a cosine score above 0.65 and more than 6 matched peaks. Further, edges between two nodes were
kept in the network if and only if each of the nodes appeared in each other’s respective top 10 most
similar nodes. Finally, the maximum size of a molecular family was set to 250, and the lowest scoring
edges were removed from molecular families until the molecular family size was below this threshold.
The spectra in the network were then searched against GNPS spectral libraries. The library spectra
were filtered in the same manner as the input data. All matches kept between network spectra and
library spectra were required to have a score above 0.65 and at least 6 matched peaks. The CSV table
generated from MZmine2 (ver. 2.32) was input to R studio (version 1.1.463) to calculate the bioactivity
score based on the workflow reported by Nothias et al. [14]. The obtained bioactivity score list and
GNPS data were downloaded and imported into Cytoscape® (version 3.5.1, Institute for Systems
Biology, Seattle, WA, USA) to generate the bioactivity-based molecular networking.
4.5. Mosher’s Esterification
4.5.1. Preparation of 16-(S) MTPA Ester 6 and 16-(R)-MTPA Ester 7
To a solution of 1 (1.1 mg, 2.1 µmol) in abs. pyridine (0.3 mL), (S)-MTPA chloride (3.2 mg,
12.6 µmol) was added, and the reaction mixture was stirred at room temperature for 12 h. Subsequently
1.0 mL water was added to the reaction mixture and extracted using CH2 Cl2 . The organic layer was
evaporated under reduced pressure, and the residue was purified by RP-HPLC eluted with MeCN:H2 O
(gradient from 50:50 to 100:0 in 10 min, 100:0 in 10 to 15 min, and from 100:0 to 50:50 in 15 to 21 min,
flow 1.0 mL/min) to afford 16-(S)-MTPA ester 6 (0.7 mg, tR 12.0 min) as a colorless oil. The 16-(R)-MTPA
ester 7 was prepared from 1 using (R)-MTPA chloride in pyridine employing the same procedure.
The 16-(R)-MTPA ester 7 (0.5 mg, tR 11.9 min) was a colorless oil. Both 6 and 7 were dissolved in CDCl3
and analysed by 1 H-NMR spectroscopy.
4.5.2. Preparation of 16-(S) MTPA Ester 8 and 16-(R)-MTPA Ester 9
Compound 8 and 9, respectively, were individually prepared from 2 using either with (S)-MTPA
chloride) or (R)-MTPA chloride. The same procedure used for preparation of 6 was employed.
Both 16-(S)-MTPA ester 8 (0.3 mg, tR 11.3 min) and 16-(R)-MTPA ester 9 (0.3 mg, tR 11.2 min) were
colorless oils. They were dissolved in CDCl3 and analysed by 1 H-NMR spectroscopy.
4.6. Bioactivity Assays
The crude extracts were initially tested in vitro against 5 human cancer cell lines: colorectal
adenocarcinoma cell line HT-29 (DSMZ, Braunschweig, Germany), malignant melanoma cell lineMar. Drugs 2020, 18, 47 14 of 16
A-375 (CLS, Eppelheim, Germany), colon cancer cell line HCT-116 (DSMZ), lung carcinoma cell line
A-549 (CLS, Eppelheim, Germany), human breast cancer line MB-231 (CLS), and the non-cancerous
human keratinocyte line HaCaT (CLS) at a concentration of 100 µg/mL. The antitumoral activity of the
crude extracts was evaluated by monitoring the metabolic activity using the CellTiterBlue Cell Viability
Assay (Promega, Mannheim, Germany). HT-29 and HaCaT cells were cultivated in RPMI medium,
A-549 and MB-231 cells in DMEM: Ham’s F12 medium (1:1) supplemented with 15 mM HEPES and
A-375 and HCT-116 cells in DMEM medium supplemented with 4.5 g/L D-Glucose and 110 mg/L
sodium pyruvate. All media were supplemented with L-Glutamine, 10% fetal bovine serum, 100 U/mL
penicillin, and 100 mg/mL streptomycin. The cultures were maintained at 37 ◦ C under a humidified
atmosphere and 5% CO2 . The cell lines were transferred every 3 or 4 days. For experimental procedure,
the cells were seeded in 96 well plates at a concentration of 10,000 cells per well. A stock solution of
40 mg/mL in DMSO was prepared of each extract. After 24 h incubation, the medium was removed
from the cells and 100 µL fresh medium containing the test samples was added. Each sample was
prepared in duplicate once. Doxorubicin as a standard therapeutic drug was used as positive control,
0.5% DMSO and growth media were used as controls. Following compound addition, plates were
cultured at 37 ◦ C for 24 h. Afterwards, the assay was performed according to the manufacturer’s
instructions and measured using the microplate reader Tecan Infinite M200 at excitation 560 nm and
emission of 590 nm. For determination of IC50 values, a dilution series of the extracts was prepared
and tested, as described before for the crude extract. The IC50 values were calculated by Excel as
the concentration that shows 50% inhibition of the viability on the basis of a negative control (no
compound) and compared with the positive control (doxorubicin).
Supplementary Materials: The supplementary are available online at http://www.mdpi.com/1660-3397/18/1/47/s1,
Bioactivity results of different KC fractions against cancer and HaCaT cell lines; NMR, HR-ESIMS and FT-IR
spectra of compounds 1–3. 1 H NMR spectra of MTPA esters 6–9.
Author Contributions: Design of the work, D.T. and B.F.; extraction, purifications of compounds, B.F.; data
analysis, B.F., F.L., P.D. and D.T.; strain identification M.B. and B.F.; writing original manuscript, B.F., P.D., D.T.;
supervision, D.T. All authors have read and agreed to the published version of the manuscript.
Funding: This research received no external funding.
Acknowledgments: BF thanks the China Scholarship Council for a Ph.D. scholarship. We are grateful to Arlette
Wenzel-Storjohann and Jana Heumann for performing anticancer assays. We acknowledge financial support by
Land Schleswig-Holstein within the funding program Open Access Publikationsfonds.
Conflicts of Interest: The authors declare no conflict of interest.
References
1. Egan, S.; Harder, T.; Burke, C.; Steinberg, P.; Kjelleberg, S.; Thomas, T. The seaweed holobiont: Understanding
seaweed–bacteria interactions. FEMS Microbiol. Rev. 2013, 37, 462–476. [CrossRef] [PubMed]
2. Fenical, W.; Jensen, P.R.; Cheng, X.C. Halimide, a Cytotoxic Marine Natural Product, and Derivatives Thereof.
U.S. Patent US6358957B1, 30 May 2000.
3. Cimino, P.J.; Huang, L.; Du, L.; Wu, Y.; Bishop, J.; Dalsing-Hernandez, J.; Kotlarczyk, K.; Gonzales, P.;
Carew, J.; Nawrocki, S. Plinabulin, an inhibitor of tubulin polymerization, targets KRAS signaling through
disruption of endosomal recycling. Biomed. Rep. 2019, 10, 218–224. [CrossRef] [PubMed]
4. Zuccaro, A.; Schulz, B.; Mitchell, J.I. Molecular detection of ascomycetes associated with Fucus serratus.
Mycol. Res. 2004, 107, 1451–1466. [CrossRef] [PubMed]
5. Zuccaro, A.; Schoch, C.L.; Spatafora, J.W.; Kohlmeyer, J.; Draeger, S.; Mitchell, J.I. Detection and identification
of fungi intimately associated with the brown seaweed Fucus serratus. Appl. Environ. Microbiol. 2008, 74,
931–941. [CrossRef] [PubMed]
6. Flewelling, A.J.; Johnson, J.A.; Gray, C.A. Isolation and bioassay screening of fungal endophytes from North
Atlantic marine macroalgae. Bot. Mar. 2013, 56, 287–297. [CrossRef]
7. Osterhage, C.; König, G.M.; Jones, P.G.; Wright, A.D. 5-Hydroxyramulosin, a new natural product produced
by Phoma tropica, a marine-derived fungus isolated from the alga Fucus spiralis. Planta Med. 2002, 68,
1052–1054. [CrossRef]You can also read