The State and Fate of Linguistic Diversity and Inclusion in the NLP World - arXiv.org
←
→
Page content transcription
If your browser does not render page correctly, please read the page content below
The State and Fate of Linguistic Diversity and Inclusion in the NLP World

 Pratik Joshi∗ Sebastin Santy∗ Amar Budhiraja∗
 Kalika Bali Monojit Choudhury
 Microsoft Research, India
 {t-prjos, t-sesan, amar.budhiraja, kalikab, monojitc}@microsoft.com

 Abstract
 Language technologies contribute to promot-
 ing multilingualism and linguistic diversity
arXiv:2004.09095v3 [cs.CL] 27 Jan 2021

 around the world. However, only a very small
 number of the over 7000 languages of the
 world are represented in the rapidly evolving
 language technologies and applications. In
 this paper we look at the relation between the (a) ACL + NAACL + EACL + EMNLP (b) LREC + WS
 types of languages, resources, and their rep- Figure 1: Number of papers with mentions of X and Y
 resentation in NLP conferences to understand language for two sets of conferences.
 the trajectory that different languages have
 followed over time. Our quantitative inves-
 tigation underlines the disparity between lan-
 mention X and Y in the paper, across the years.
 guages, especially in terms of their resources,
 and calls into question the “language agnostic” As you can see, while X has a steady and growing
 status of current models and systems. Through trend of research, our community has been mostly
 this paper, we attempt to convince the ACL oblivious to Y, until recently when some of the
 community to prioritise the resolution of the zero-shot learning papers have started mentioning
 predicaments highlighted here, so that no lan- it. Can you guess what X and Y are?
 guage is left behind.
 Regardless of whether you can guess the exact
 answer, most NLP researchers surely know of (and
 1 The Questions
 might even speak) several languages which are in
 Languages X and Y are the official languages of the same boat as X; languages which have a large
 two different countries; they have around 29M and amount of resources and therefore access to the
 18M native speakers, and 2M and 5.5K Wikipedia benefits of the current NLP breakthroughs, and
 articles, respectively. X is syntactically quite sim- languages like Y; those which lack resources and
 ilar to English, though uses dimunitives and has consequently the attention of the NLP community,
 grammatical gender. Y, on the other hand, has a despite having similar speaker base sizes and typo-
 different word order from English, and has a rare logically diverse features.
 typological feature - generally it is a head-final lan- You probably have come across the issue of ex-
 guage, but noun phrases are head-initial. It also tremely skewed distribution of resources across the
 features full and partial reduplication. 69 items on world’s languages before. You might also be aware
 LDC and ELRA contain data in X, whereas for Y of the fact that most of our NLP systems, which are
 there are only 2 items. X boasts of some of the typically declared language agnostic, are not truly
 best online machine translation systems, whereas so (Bender, 2011). The handful of languages on
 Y is supported by very few online MT systems and which NLP systems are trained and tested are often
 that too with far inferior translation quality. Fig- related and from the same geography, drawn from a
 ure 1 shows the number of papers in conferences few dominant language families, leading to a typo-
 (ACL, NAACL, EACL, EMNLP, LREC, WS) that logical echo-chamber. As a result, a vast majority
 ∗
 Authors contributed equally to the work. of typologically diverse linguistic phenomena are
 https://microsoft.github.io/linguisticdiversity never seen by our NLP systems (Ponti et al., 2019).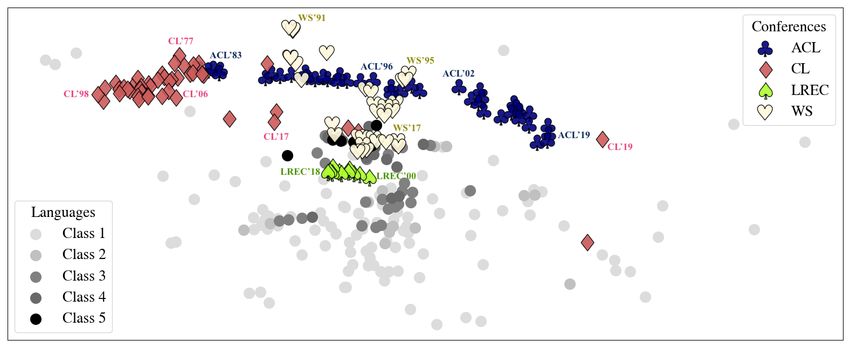
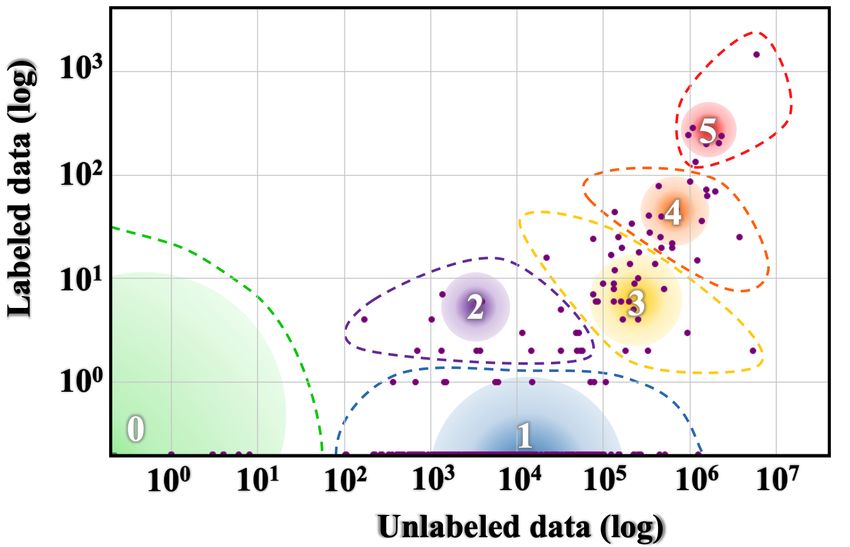
Nevertheless, it would be prudent to re-examine distinct and different trajectory in the history of
these issues in the light of recent advances in deep ACL, and some of the hitherto neglected classes
learning. Neural systems, on one hand, require a lot of languages have more hope of coming to the
more data for training than rule-based or traditional forefront of NLP technology with the promised
ML systems, creating a bigger technological divide potential of zero-shot learning.
between the Xs and Ys; yet, some of the most re-
cent techniques on zero-shot learning of massively 2 The Six Kinds of Languages
multilingual systems (Devlin et al., 2019; Conneau
and Lample, 2019; Aharoni et al., 2019; Artetxe In order to summarize the digital status and ‘rich-
and Schwenk, 2019) bridge this gap by obliterating ness’ of languages in the context of data availability,
the need for large labeled datasets in all languages. we propose a taxonomy based on the number of
Instead, they need only large unlabeled corpora language resources which exist for different lan-
across languages and labeled data in only some lan- guages. We frame the rest of our analyses based on
guages. Assuming that this approach can be taken this taxonomy and use it to emphasize the existence
to its promising end, how does the fate of different of such resource disparities.
languages change?
 2.1 Features
 We break down this complex prescient question
into the following more tractable and quantifiable We design this taxonomy using two feature axes:
questions on Linguistic Diversity and Inclusion: number of unlabeled resources vs. number of la-
 beled resources. Previous methods have mostly
1. How many resources, labeled and unlabeled, are
 relied on supervised learning techniques which re-
available across the World’s languages? How does
 quire labeled corpora. However, the advent of trans-
this distribution correlate to their number of native
 fer learning methods have boosted the importance
speakers? What can we expect to achieve today
 of unlabeled data: massively multilingual models
and in the near future for these languages?
 such as mBERT use Wikipedia for pre-training, and
2. Which typological features have current NLP then fine-tune on downstream NLP tasks. These
systems been exposed to, and which typological features are suitable because the current NLP re-
features mostly remain unexplored by systems be- search is predominantly data-driven, and language
cause we have hardly created any resources and inclusion depends on how much labeled or unla-
conducted data-driven research in those languages? beled data is available. We believe these features
3. As a community, how inclusive has ACL been in are sufficient for the taxonomical design as the
conducting and publishing research on various lan- required metadata is consistently available across
guages? In 1980s and early 90s, when large scale all languages, whereas features such as number of
datasets were not the prime drivers of research, was hours required to collect data aren’t available.
the linguistic diversity of ACL higher than what it We treat each data resource as a fundamental
has been in 2000s and 2010s? Or has ACL become unit, based on the assumption that the collection
more inclusive and diverse over the years? of one unit is proportional to a certain extent of
4. Does the amount of resource available in a effort being invested towards the resource improve-
language influence the research questions and the ment of that language. Moreover, this feature dis-
venue of publication? If so, how? cretization is unambiguous and concrete. Other
 units such as the total number of datapoints across
5. What role does an individual researcher, or a datasets can be misleading because different NLP
research community have to play in bridging the tasks have different data requirements. For exam-
linguistic-resource divide? ple, while Machine Translation (MT) models re-
 In this paper, we take a multi-pronged quantita- quire datapoints to the order of millions (Koehn and
tive approach to study and answer the aforemen- Knowles, 2017) to perform competitively, compe-
tioned questions, presented in order, in the follow- tent models in Question Answering require around
ing five sections. One of the key findings of our 100 thousand datapoints (Rajpurkar et al., 2016).
study, to spill the beans a bit, is that the languages Moreover, the unit of datapoints vary across dif-
of the World can be broadly classified into 6 classes ferent technologies (e.g. Speech data measured in
based on how much and what kind of resources they hours, MT data measured in number of parallel
have; the languages in each class have followed a sentences).
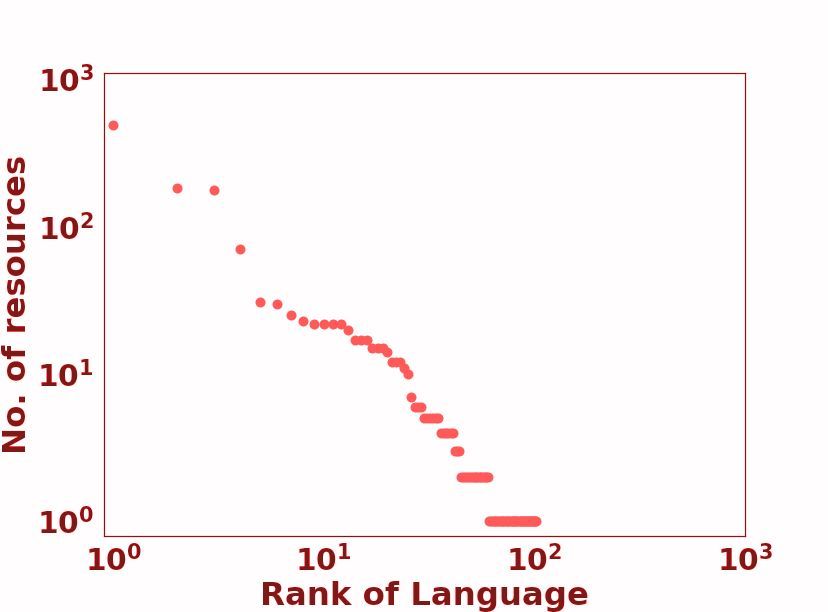
to categorize languages into 6 unique positions in
 the language resource ‘race’:
 0 - The Left-Behinds These languages have been
 and are still ignored in the aspect of language tech-
 nologies. With exceptionally limited resources, it
 will be a monumentous, probably impossible effort
 to lift them up in the digital space. Unsupervised
 pre-training methods only make the ‘poor poorer’,
 since there is virtually no unlabeled data to use.
 1 - The Scraping-Bys With some amount of un-
Figure 2: Language Resource Distribution: The size of labeled data, there is a possibility that they could
the gradient circle represents the number of languages be in a better position in the ‘race’ in a matter of
in the class. The color spectrum VIBGYOR, repre- years. However, this task will take a solid, orga-
sents the total speaker population size from low to high.
 nized movement that increases awareness about
Bounding curves used to demonstrate covered points
by that language class. these languages, and also sparks a strong effort to
 collect labelled datasets for them, seeing as they
 have almost none.
2.2 Repositories
 2 - The Hopefuls With light at the end of the tun-
We focus our attention on the LDC catalog1 and nel, these languages still fight on with their gasping
the ELRA Map2 for labeled datasets. Although breath. A small set of labeled datasets has been
there are other repositories of data available on- collected for these languages, meaning that there
line, we found it practical to treat these organized are researchers and language support communities
collections as a representation of labeled dataset which strive to keep them alive in the digital world.
availability. This way, we look at standardized Promising NLP tools can be created for these lan-
datasets that have established data quality and con- guages a few years down the line.
sistency, and which have been used in prior work.
There are strong efforts such as PanLex (Kamholz 3 - The Rising Stars Unsupervised pre-training
et al., 2014), which is a large lexical database of has been an energy boost for these languages. With
a wide range of languages being used for a lexi- a strong web presence, there is a thriving cultural
cal translator, and OLAC (Simons and Bird, 2003), community online for them. However, they have
which contains a range of information for different been let down by insufficient efforts in labeled data
languages (e.g. text collections, audio recordings, collection. With the right steps, these languages
and dictionaries). However, keeping within the can be very well off if they continue to ride the
purview of NLP datasets used in *CL conferences, ‘pre-training’ wave.
we decided to focus on popular repositories such 4 - The Underdogs Powerful and capable, these
as the above-mentioned. languages pack serious amounts of resource ‘fire-
 We look at Wikipedia pages as a measure for power’. They have a large amount of unlabeled
unlabeled data resources. With regards to language data, comparable to those possessed by the win-
technologies, Wikipedia pages represent a strong ners, and are only challenged by lesser amount of
source of unsupervised training data which are labeled data. With dedicated NLP communities
freely and easily accessible. In the perspective of conducting research on these languages, they have
digital resource availability, they are a comprehen- the potential to become winners and enjoy the fruits
sive source of factual information and are accessed of ‘digital superiority’.
by a large, diverse set of online users.
 5 - The Winners Running strong and fast, these
2.3 Language Classes languages have been in the lead for quite a while
 now, some longer than others. With a dominant
Figure 2 is a visualization of the taxonomy. We online presence, there have been massive indus-
find a set of distinct partitions which can be used trial and government investments in the develop-
 1
 https://catalog.ldc.upenn.edu/ ment of resources and technologies for these lan-
 2
 http://catalog.elra.info/en-us/ guages. They are the quintessential rich-resource
Class 5 Example Languages #Langs #Speakers % of Total Langs
 0 Dahalo, Warlpiri, Popoloca, Wallisian, Bora 2191 1.0B 88.17%
 1 Cherokee, Fijian, Greenlandic, Bhojpuri, Navajo 222 1.0B 8.93%
 2 Zulu, Konkani, Lao, Maltese, Irish 19 300M 0.76%
 3 Indonesian, Ukranian, Cebuano, Afrikaans, Hebrew 28 1.1B 1.13%
 4 Russian, Hungarian, Vietnamese, Dutch, Korean 18 1.6B 0.72%
 5 English, Spanish, German, Japanese, French 7 2.5B 0.28%

 Table 1: Number of languages, number of speakers, and percentage of total languages for each language class.

 103 103 En 102
 En
 En 108

 Percentage of Web Pages
 En
 = 1.461 = 1.512 Es = 0.015 = 1.194
 No. of Resources
No. of Resources

 Es 1
 106 It Ko 10

 No. of Articles
 102 Es 102 It Es
 In Bn
 Ko It
 104 Bh
 Bn Bn La 100 Ko
 101 101 Gr
 It La Ko
 In In
 102 Zu
 Zu
 In, Bh, La,Bh, Dh,
 Zu Gr, Dh, Wl Gr,Dh,Wl 10-1 Bn La,Gr,Zu
 100 100 Wl Bh,Dh,Wl
 100
 100 101 102 103 100 10 1
 10 2
 103 0 100 200 300 100 101 102 103
 Rank of Language Rank of Language Rank of Language Rank of Language

 (a) LDC (b) LRE (c) Wikipedia (d) Web

Figure 3: Plots of different available resources for different languages. Languages to the far right do not have a
representation in the resource category. Languages annotated are: Class 0-Dahalo (Dh), Wallisian(Wl); Class
1-Bhojpuri (Bh), Greenlandic (Gr); Class 2-Lao (La), Zulu (Zu); Class 3- Bengali (Bn), Indonesian (In);
Class 4- Korean (Ko), Italian (It); Class 5- English (En), Spanish (Es).

languages, reaping benefit from each state-of-the- features (Dryer and Haspelmath, 2013). Such doc-
art NLP breakthrough. umentation becomes important as there are barely
 Some more information about the taxonomy is any other classifications of similar scale. In the
shown in Table 1. We also take 10 languages, and context of NLP research, there has been work in-
annotate their positions in Figure 3. dicating the effectiveness of injecting typological
 information to guide the design of models (Ponti
2.4 Findings et al., 2019). Also, transfer learning of resource-
On your marks As can be seen in Figure 3, the rich to resource-poor languages have been shown
Winners take pole position in all rankings, and to work better if the respective languages contain
Class 0 languages remain ‘out of the race’ with similar typological features (Pires et al., 2019). We
no representation in any resource. The Wikipedia look at how skewed language resource availability
distribution seems to be more fair for classes 1, 2, leads to an under-representation of certain typolog-
and 3 when compared to classes 4 and 5, whereas ical features, which may in turn cause zero-shot
the Web distribution has a clear disparity. inference models to fail on NLP tasks for certain
 languages.
Talk ain’t cheap Looking at Table 1, we see that We look at the WALS data (Dryer and Haspel-
Class 0 contains the largest section of languages math, 2013), which contains typological features
and represents 15% of all speakers across classes. for 2679 languages. There are a total of 192 typo-
Although there is a large chunk of speakers which logical features, with an average of 5.93 categories
converse with Class 5 languages, the lack of tech- per feature. We take the languages in classes 0, 1,
nological inclusion for different languages could 2, all of which have limited or no data resources
draw native speakers away from Class 0 languages as compared to 3, 4, 5 and look at how many cat-
and towards Class 5, exacerbating the disparity. egories, across all features, exist in classes 0, 1,
 2 but not 3, 4, 5. This comes to a total of 549
3 Typology
 out of 1139 unique categories, with an average of
Linguistic typology is a field which involves the 2.86 categories per feature being ignored. Typo-
classification of languages based on their structural logical features with the most and least ‘ignored’
and semantic properties. Large-scale efforts have categories are shown in Table 2.
led to the creation of a database of typological To get an idea of what these typological ‘exclu-
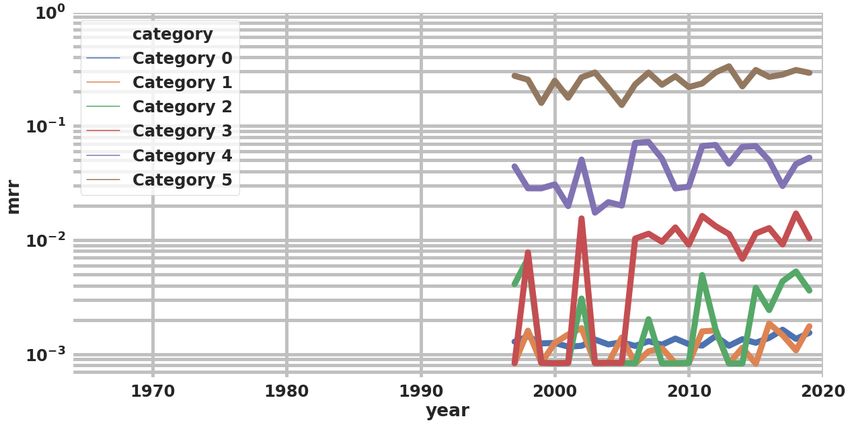
Feature #Cat #Lang Feature #Cat #Lang
 144E 23 38 83A 0 1321
 144M 23 45 82A 0 1302 4 Conference-Language Inclusion
 144F 22 48 97A 0 1146
 NLP conferences have a huge impact on how lan-
 144O 21 30 86A 0 1083
 guage resources and technologies are constructed.
Table 2: Most and least ‘ignored’ typological features, Exciting research in venues such as ACL, EMNLP,
the number of categories in each feature which have LREC have the ability to turn heads in both indus-
been ignored, and the number of languages which con- try and government and have the potential to attract
tain this feature. funds to a particular technology. Has the usage
 of a small set of resource-rich languages in such
 Language Class #Speakers ‘Ignored’ Error conferences led to a disparity, pushing the less rep-
 Amharic 2 22M 9 60.71 resented to the bottom of the ladder in terms of
 Breton 1 210k 7 83.50 research? We analyze the involvement of various
 Swahili 2 18M 8 45.64 languages in NLP research conferences over the
 Kabyle 1 5.6M 8 39.10 years.

Table 3: Relevant examples of typologically ‘excluded’ 4.1 Dataset
languages. The error rate is that of English → Lan-
 The ACL Anthology Corpus (ACL-ARC) (Bird
guage from Artetxe and Schwenk (2019).
 et al., 2008) is the most extensively used dataset
 for analyzing trends in NLP research. This dataset
 contains PDFs, and parsed XMLs of Anthology pa-
sions’ mean in the context of modern multilingual
 pers. However, the latest versioned copy of ACL-
methods, we look at the specific languages which
 ARC is till 2015 which makes it insufficient for
contain these ‘excluded’ categories in the respec-
 analyzing trends in the most recent years. More-
tive features, and compare their performances in
 over, paper data for non-ACL conferences such
similarity search, from the results of Artetxe and
 as LREC, COLING are absent from this dataset.
Schwenk (2019). Table 3 shows some examples of
 In order to create a consistent data model, we
how ‘ignored’ features have been difficult to deal
 augment this dataset by using Semantic Scholar’s
with even when jointly training of all languages.
 API and scraping ACL Anthology itself. Thus,
3.1 Findings we gather a consolidated dataset for 11 confer-
 ences which are relevant in judging global trends
Far-reaching repercussions The most ‘ignored’ in NLP research. These include ACL, NAACL,
feature in Table 2, 144E (Multiple Negative Con- EMNLP, EACL, COLING, LREC, CONLL, Work-
structions in SVO Languages), is a rare feature, ex- shops (WS) (all since 1990), SEMEVAL, TACL and
isting in only 38 languages over the world. These CL Journals. We have attached the statistics of the
languages, however, are from various regions (e.g. dataset in Appendix A.
Wolof, Icelandic, and Kilivila). Language
tools in all these areas can be adversely affected 4.2 Analysis
without sufficient typological representation. On 4.2.1 Language Occurrence Entropy
the other hand, common features such as 83A (Or-
 The primary step of measuring the language di-
der of Object and Verb) are well represented with
 versity and inclusion of a conference and their
definite feature values for 1321 languages, ranging
 progress is to measure the usage of language in
from English to Mundari.
 that conference over multiple iterations. One of
Does it run in the family? Amharic, in Table 3, the ways to do it is by using frequency-based tech-
which among the Semitic family of languages, is niques where we can measure the occurrence of
the second most spoken language after Arabic languages in that iteration. However, it is not a
(which has 300M speakers). However, it has 9 unified measure which represents the nature of lan-
‘ignored’ typological features, whereas Arabic guage distribution with a single number. To this
has none. This reflects in the error rate of English end, we use entropy as our metric to measure lan-
to Amharic (60.71), which is significantly worse guage inclusivity of each conference. It efficiently
compared to 7.8 for English to Arabic. captures the skew in the distribution of languages,

(a) c = ACL (b) c = NAACL (c) c = EMNLP (d) c = EACL (e) c = COLING

 (f) c = CL (g) c = WS (h) c = CONLL (i) c = SEMEVAL (j) c = LREC

 Figure 4: Language occurrence entropy over the years for different conferences ({S}c,y ).

thereby making the disparity in language usage aka number of languages in each class, then:
more clearer. The language occurrence entropy is
calculated as follows: |Q|
 1 X 1
 For a conference c held in year y having P MRR = (2)
 |Q| ranki
papers, there exists a binary matrix {MP ×L }c,y i=1
where Mij is 1 if ith paper (∈ P ) mentions the j th Table 4 shows inverse mean reciprocal ranks
language (∈ L). Then the entropy {S}c,y is: of each category for a conference. The smaller
 the inverse MRR value, the more inclusive that
 P
 c,y 1 X conference is to that language class.
 {Sj } = {Mij }c,y
 P
 i=1
 Conf / Class 0 1 2 3 4 5
 {Sj }c,y
 {Sj0 }c,y = PL (1) ACL 725 372 157 63 20 3
 c,y
 j=1 {Sj } CL 647 401 175 76 27 3
 L
 X COLING 670 462 185 74 21 2
 {S} c,y
 =− {Sj0 }c,y loge {Sj0 }c,y CONLL 836 576 224 64 16 3
 j=1 EACL 839 514 195 63 15 3
 EMNLP 698 367 172 67 19 3
where {Sj }c,y is a array of length L accounting for LREC 811 261 104 45 13 2
number of papers in a specific language, {Sj0 }c,y NAACL 754 365 136 63 18 3
is normalization done in order to get probability SEMEVAL 730 983 296 121 19 3
distribution for calculating entropy. In short, the TACL 974 400 180 50 15 3
higher the entropy, the more spread out is the dis- WS 667 293 133 59 15 3
tribution over the languages. The more peaked or
skewed the distribution is, the lower is the entropy. Table 4: Class-wise (1/MRR) for each conference.
 In Figure 4, we can observe the entropy S plotted
for each c as a function of y.
 4.3 Findings
4.2.2 Class-wise Mean Reciprocal Rank
 All-Inclusive Looking at the combined trends,
To quantify the extent of inclusion of language
 both the entropy plots and the MRR figures suggest
classes from our taxonomy in different confer-
 that LREC and WS have been the most inclusive
ences, we employ class-wise Mean Reciprocal
 across all categories and have been continuing to
Rank (MRR) as a metric. This helps in determining
 do so over the years.
the standing of each class in a conference. If the
rank of the language (ranki ) is ordered by the fre- A ray of hope With regards to the proceedings of
quency of being mentioned in papers of a particular ACL, EMNLP, NAACL, LREC, we note a marked
conference, and Q is the total number of queries spike in entropy in the 2010s, which is absent in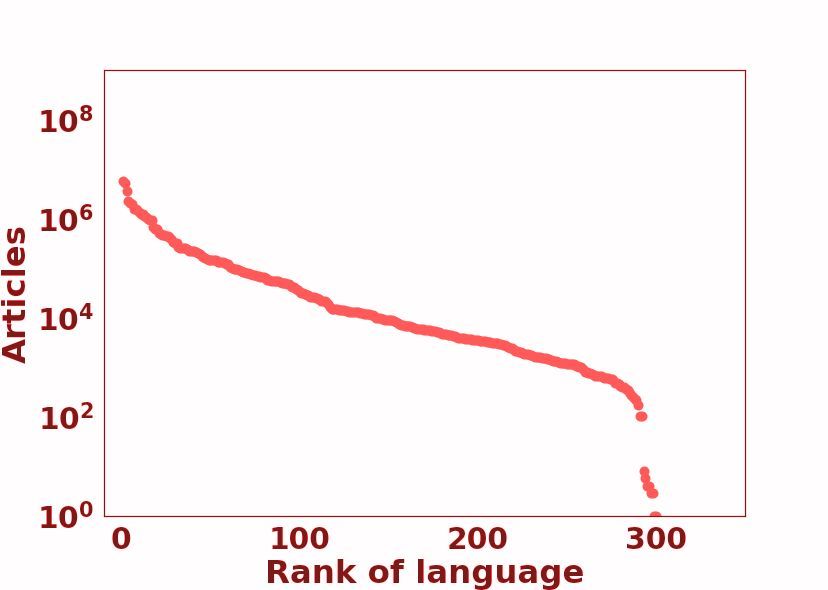
Word Output (V-dim)
other conferences. This might be due to the in-
 y1,j y2,j yC,j
creased buzz surrounding cross-lingual techniques.
The later the merrier An interesting point to note WN×V WN×V WN×V

is that conferences which started later have taken
 Hidden Layer N-dim
lessons from past in matters of language inclusion. hi
While the earlier established conferences have con- WE×N

tinued to maintain interest in a particular under-
 ek
lying theme of research which may or may not
 Entity Input (E-dim)
favour multilingual systems. This can be observed
in : COLING, ACL, EACL, EMNLP (order of their Figure 5: Model architecture to learn entity embed-
start dates). dings. WE×N is the weight matrix from input layer (en-
 tity layer) to the hidden layer, and WN ×V is the weight
Falling off the radar The taxonomical hierarchy matrix for the hidden layer to output layer computation.
is fairly evident when looking at the MRR table At the end of training, WE×N is the matrix containing
(Table 4) with class 5 coming within rank 2/3 and embeddings of entities and WN ×V is the matrix con-
class 0 being ‘left-behind’ with average ranks rang- taining the embeddings of words.
ing from 600 to 1000. While the dip in ranks is
more forgiving for conferences such as LREC, WS,
 they provide a concise signal with reduced noise.
it is more stark in CONLL, TACL, SEMEVAL.
 This model draws parallels to the Skipgram model
5 Entity Embedding Analysis of Word2Vec (Mikolov et al., 2013), where given
 an input word in Skipgram model, the task is to
The measures discussed in the previous section predict the context around the word. The input en-
signal at variance in acceptance of different lan- tity and K randomly sampled words in our case
guages at different NLP venues across time. How- correspond to the input word and context in the
ever, there are usually multiple subtle factors which Skipgram model. The goal of the model is to maxi-
vanilla statistics fail to capture. Embeddings, on mize probability of predicting the random K words,
the other hand, have been found extensively use- given the entity id as the input:
ful in NLP tasks as they are able to learn relevant
signals directly from the data and uncover these M K I
 1 1 X XX
rather complex nuances. To this end, we propose a p(wk |E ) (3)
 MK
 m=1 k=1 i=1
novel approach to jointly learn the representations
of conferences, authors and languages, which we where E is the entity Ei which is associ-
collectively term as entities. The proposed embed- ated with the Pj th paper and p is the probability
ding method allows us to project these entities in of predicting the word wi out of the K words sam-
the same space enabling us to effectively reveal pled from the paper and M is the total number of
patterns revolving around them. papers in the dataset. To optimize for the above
 distribution, we define the typical SGD based learn-
5.1 Model ing strategy similar to Word2Vec(Mikolov et al.,
We define the following model to jointly learn the 2013).
embeddings of entities such that entities which Figure 5 shows an outline of the model. The
have similar contextual distributions should co- entity input layer has dimension equal to the total
occur together. For example, for an author A, who number of entities in the dataset (E). Hidden layer
works more extensively on language Li than Lj size is set to the desired embedding dimension (N ).
and publishes more at conference Cm than at con- The output layer predicts words for the input entity
ference Cn , the embeddings of A would be closer and is of the same size as the vocabulary (V ). The
Li than Lj and Cm than Cn . entities we learn are: (1) authors of the paper, (2)
 Given an entity and a paper associated with the languages mentioned in the paper, (3) conference
entity, the learning task of the model is to predict where the paper was accepted (e.g. ACL), and (4)
K randomly sampled words from the title and the the conference iteration (e.g. ACL’19). We de-
abstract of the paper. We only select the title and scribe the model detail and hyperparameter tuning
abstract as compared to the entire paper text as in Appendix A.
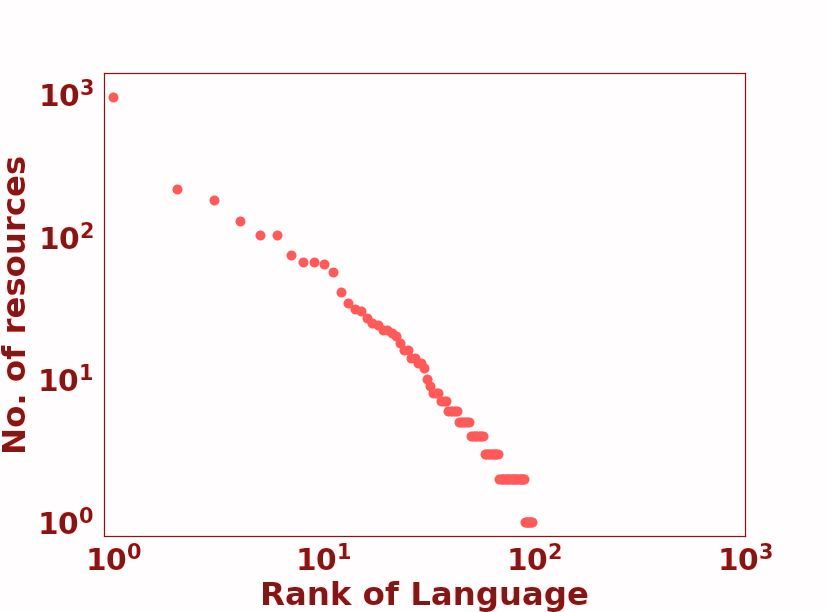
Figure 6: t-SNE visualization of the learnt conference and language embeddings.

 Class MRR(5) MRR(10) MRR(15) MRR(20) metric for a class of languages from the taxonomy,
 0 0.72281 0.69146 0.63852 0.57441 we take the mean of the MRR for all languages in
 1 0.57210 0.52585 0.45354 0.40904 that class. We fix M to be 20, so as to understand
 2 0.47039 0.45265 0.41521 0.38157 the impact of the community when the number of
 3 0.59838 0.52670 0.45131 0.42899 languages remains unchanged. Table 5 shows the
 4 0.56016 0.47795 0.51199 0.50681 MRR of various class of languages. A higher value
 5 0.56548 0.51471 0.54326 0.47619 of this measure indicates a more focused commu-
 nity working on that particular language, rather
Table 5: Language-Author-Language MRR on Taxon-
 than a diverse range of authors.
omy Classes. MRR(K) considers the closest K authors.

 5.3 Findings
5.2 Analysis Time waits for no conference We can see a left
In order to better understand how languages are to right trend in Figure 6 with ACL in 1983 in
represented at different venues, we visualize the the left, and subsequent iterations laid out as we
distribution of entity embeddings by projecting the go right. We observe the same trend for EACL,
generated embeddings into 2 dimensions using t- NAACL, EMNLP, CONLL, TACL, and COLING.
SNE (Maaten and Hinton, 2008) (as shown in Fig- We can say that the axis represents the progression
ure 6). For clarity, we only plot ACL, LREC, WS of time to a certain extent. Alternatively, it may
and CL among the conferences, and all languages even represent a shift in the focus of NLP research,
from the taxonomy, except those in Class 0. We moving from theoretical research focused on gram-
omit plotting Class 0 languages as their projections mar and formalisms on the left to a data-driven,
are noisy and scattered due to their infrequent oc- more ML-oriented approach on the right. This can
currence in papers. be observed as most of the CL embeddings are po-
 sitioned on the left given their theoretical research
 To understand the research contributions of in-
 focus.
dividual authors or communities towards research
in respective language classes, we leverage the dis- Long distance relationships? From Figure 6, we
tribution between author and language entities by can note that the less-resourced language classes
computing a variation of the Mean Reciprocal Rank are farther away from the trend-line of ACL than
(MRR). We consider a language L, and take the the more resourced ones, with class 5 being clos-
K closest authors to L using cosine distance, and est, and class 1 being farthest. The visualization
then take the closest M languages to each author. illustrates that languages are spreading out radially
If L is present in the closest languages of an author, downwards from the ACL trendline with popular
then we take the rank of L in that list, inverse it, classes of taxonomy like class 5 and class 4 being
and average it for the K authors. To compute this closer while others spreading out farther. Again, as
previous analyses have shown us, LREC and WS potentially reduce the performance of language
embeddings are closer to the language embeddings tools relying on transfer learning.
as compared to the other conferences as shown in — Newer conferences have been more language-
Figure 6. In fact, LREC cluster is right in the mid- inclusive, whereas older ones have maintained in-
dle of language clusters and so is the major part of terests in certain themes of research which don’t
the WS cluster, especially in recent iterations. necessarily favour multilingual systems.
Not all heroes wear capes Table 5 shows the — There is a possible indication of a time progres-
MRR for each class of languages in the taxon- sion or even a technological shift in NLP, which
omy. From Table 5, it can be seen that class 0 can be visualized in the embeddings projection.
has the highest MRR across different K values. — There is hope for low-resource languages, with
This shows that perhaps low resource languages MRR figures indicating that there are focused com-
have some research groups solely focused on the munities working on these languages and publish-
challenges related to them. There is a decreasing ing works on them, but there are still plenty of
trend of MRR from class 0 to class 5, except for languages, such as Javanese and Igbo, which do
class 2, thereby indicating that more popular lan- not have any such support.
guages are addressed by more authors. We also
observe that even though Japanese, Mandarin, We believe these findings will play a strong role
Turkish and Hindi (MRR(10) > 0.75) are part in making the community aware of the gap that
of class 5 and class 4, their MRR is higher even needs to be filled before we can truly claim state-of-
compared to low resource languages in another the-art technologies to be language agnostic. Perti-
classes, indicating that these languages have fo- nent questions should be posed to authors of future
cused research communities working on them. On publications about whether their proposed language
the other end of the spectrum, we observe a lot of technologies extend to other languages.
low resource languages like Burmese (MRR(10) There are ways to improve the inclusivity of ACL
= 0.02), Javanese (MRR(10) = 0.23) and Igbo conferences. Special tracks could be initiated for
(MRR(10) = 0.13) which have millions of speak- low-resource, language-specific tasks, although we
ers but significantly low MRR values, potentially believe that in doing so, we risk further marginaliza-
indicating that not a lot of attention is being given tion of those languages. Instead, a way to promote
to them in the research community. change could be the addition of D&I (Diversity and
 Inclusion) clauses involving language-related ques-
6 Conclusion tions in the submission and reviewer forms: Do
 your methods and experiments apply (or scale) to
We set out to answer some critical questions about a range of languages? Are your findings and con-
the state of language resource availability and re- tributions contributing to the inclusivity of various
search. We do so by conducting a series of quan- languages?
titative analyses through the lens of a defined tax- Finally, in case you’re still itching to know, Lan-
onomy. As a result, we uncover a set of interesting guage X is Dutch, and Y is Somali.
insights and also yield consistent findings about
language disparity: 7 Acknowledgements
 — The taxonomical hierarchy is repeatedly evi- We would like to thank Anshul Bawa, Adithya
dent from individual resource availabilities (LDC, Pratapa, Ashish Sharma for their valuable feedback
LRE, Wikipedia, Web), entropy calculations for during the final phase of work. We would also like
conferences, and the embeddings analysis. to thank the anonymous reviewers for their many
 — LREC and Workshops(WS) have been more insightful comments and suggestions.
inclusive across different classes of languages, seen
through the inverse MRR statistics, entropy plots
and the embeddings projection. References
 — There are typological features (such as 144E), Roee Aharoni, Melvin Johnson, and Orhan Firat. 2019.
 Massively multilingual neural machine translation.
existing in languages over spread out regions, rep- In Proceedings of the 2019 Conference of the North
resented in many resource-poor languages but not American Chapter of the Association for Compu-
sufficiently in resource-rich languages. This could tational Linguistics: Human Language Technolo-
gies, Volume 1 (Long and Short Papers), pages Telmo Pires, Eva Schlinger, and Dan Garrette. 2019.
 3874–3884, Minneapolis, Minnesota. Association How multilingual is multilingual BERT? In Pro-
 for Computational Linguistics. ceedings of the 57th Annual Meeting of the Asso-
 ciation for Computational Linguistics, pages 4996–
Mikel Artetxe and Holger Schwenk. 2019. Mas- 5001, Florence, Italy. Association for Computa-
 sively multilingual sentence embeddings for zero- tional Linguistics.
 shot cross-lingual transfer and beyond. Transac-
 tions of the Association for Computational Linguis- Edoardo Maria Ponti, Helen O’Horan, Yevgeni Berzak,
 tics, 7:597–610. Ivan Vulić, Roi Reichart, Thierry Poibeau, Ekaterina
 Shutova, and Anna Korhonen. 2019. Modeling lan-
Emily M. Bender. 2011. On achieving and evaluating guage variation and universals: A survey on typo-
 language-independence in NLP. In Vol 6: Interac- logical linguistics for natural language processing.
 tion of Linguistics and Computational Linguistics. Computational Linguistics, 45(3):559–601.
 Pranav Rajpurkar, Jian Zhang, Konstantin Lopyrev, and
Steven Bird, Robert Dale, Bonnie J Dorr, Bryan Gib- Percy Liang. 2016. SQuAD: 100,000+ questions for
 son, Mark Thomas Joseph, Min-Yen Kan, Dongwon machine comprehension of text. In Proceedings of
 Lee, Brett Powley, Dragomir R Radev, and Yee Fan the 2016 Conference on Empirical Methods in Natu-
 Tan. 2008. The ACL anthology reference corpus: A ral Language Processing, pages 2383–2392, Austin,
 reference dataset for bibliographic research in com- Texas. Association for Computational Linguistics.
 putational linguistics. LREC’08.
 Gary Simons and Steven Bird. 2003. The open lan-
Alexis Conneau and Guillaume Lample. 2019. Cross- guage archives community: An infrastructure for
 lingual language model pretraining. In H. Wal- distributed archiving of language resources. Com-
 lach, H. Larochelle, A. Beygelzimer, F. d'Alché-Buc, puting Research Repository - CORR, 18:117–128.
 E. Fox, and R. Garnett, editors, Advances in Neu-
 ral Information Processing Systems 32, pages 7059–
 7069. Curran Associates, Inc.

Jacob Devlin, Ming-Wei Chang, Kenton Lee, and
 Kristina Toutanova. 2019. BERT: Pre-training of
 deep bidirectional transformers for language under-
 standing. In Proceedings of the 2019 Conference
 of the North American Chapter of the Association
 for Computational Linguistics: Human Language
 Technologies, Volume 1 (Long and Short Papers),
 pages 4171–4186, Minneapolis, Minnesota. Associ-
 ation for Computational Linguistics.

Matthew S. Dryer and Martin Haspelmath, editors.
 2013. WALS Online. Max Planck Institute for Evo-
 lutionary Anthropology, Leipzig.

David Kamholz, Jonathan Pool, and Susan Colow-
 ick. 2014. PanLex: Building a resource for pan-
 lingual lexical translation. In Proceedings of the
 Ninth International Conference on Language Re-
 sources and Evaluation (LREC’14), pages 3145–
 3150, Reykjavik, Iceland. European Language Re-
 sources Association (ELRA).

Philipp Koehn and Rebecca Knowles. 2017. Six chal-
 lenges for neural machine translation. In Proceed-
 ings of the First Workshop on Neural Machine Trans-
 lation, pages 28–39, Vancouver. Association for
 Computational Linguistics.

Laurens van der Maaten and Geoffrey Hinton. 2008.
 Visualizing data using t-SNE. Journal of machine
 learning research, 9(Nov):2579–2605.

Tomas Mikolov, Kai Chen, G. S. Corrado, and J. Dean.
 2013. Efficient estimation of word representations
 in vector space. In ICLR.
A Appendix in the range of 0 to 1.00 (or 0 to 100%) where
 1.00 is considered to be the best. MAE has no up-
A.1 Embedding Visualization
 per bound but the smaller it is the better, and 0 is
We have compiled a visualization of the em- its ideal value. We observed that our model does
bedding space of conferences and languages not show significant difference across any hyper-
which can be run on a browser. This is paraeters except for the size of embeddings. The
available as an interactive visualization on best dimension size for our embeddings is 75, and,
https://microsoft.github.io/linguisticdiversity, and we observed the corresponding R2 value of 0.6 and
can be used to play around with different combi- an MAE value of 4.04.
nations to see how NLP research has progressed
over the years in terms of language inclusion. The
 A.4 Cosine distance between conferences and
legends are self-explanatory and are clickable to
 languages
add or remove those points. The numbers in the
legend represent the respective classes. From Figure 6, we can see that languages are some-
 what below the conferences are closer to some con-
A.2 ACL Anthology Dataset Statistics ferences while distant from others. To quantify this
We have accounted for all the papers which have analysis, we compute the cosine distance between
appeared in the main track proceedings of the con- the conference vector and the mean of the vector
ference. This includes all the long and short pa- each category of the taxonomy. Table 7 shows the
pers and excludes System Demonstrations, Tutorial cosine distance between the conferences and the
Abstracts, Student Research Workshops, Special each category of languages and we see a very simi-
Issues, and other such tracks out of the scope of lar trend that while ACL is an at average distance of
measuring language usage trends in general NLP 0.291 from category 5 languages, its almost more
research. We are in the process of releasing the than double far away from category 2. There is also
dataset along with the documentation. a very steep rise in distance of the ACL vector from
 category 4 to category 3. In fact, similar trends are
 Conf / Class #Papers #Body #NoProc % Missing
 visible for other ACL related conferences including
 LREC 5835 15 6 0.1%
 EACL, NAACL, EMNLP and TACL. We can also
 WS 17844 337 332 1.86%
 see that in Table 7, WS and LREC are closest from
 CONLL 1035 0 0 0.0%
 category 2 to category 5 whereas almost all con-
 EACL 1165 4 1 0.09%
 ferences are somewhat at the same distance from
 ACL 5776 46 29 0.5%
 category, except the CL journal. The trend for cat-
 TACL 280 7 0 0.0%
 egory 0 languages seems somewhat different than
 CL 2025 88 0 0.0%
 the usual trend is this table, probably because of
 NAACL 2188 2 1 0.05%
 the large number of languages in this category as
 COLING 4233 5 2 0.05%
 well as the sparsity in papers.
 EMNLP 3865 16 16 0.41%

 Table 6: Dataset Statistics. Conf / Class 0 1 2 3 4 5
 LREC 0.51 0.51 0.52 0.42 0.36 0.32
 WS 0.50 0.55 0.53 0.40 0.28 0.21
A.3 Hyperparameter Tuning CONLL 0.54 0.60 0.63 0.49 0.40 0.46
Our model has same hyperparameters as that EACL 0.53 0.55 0.59 0.45 0.34 0.32
of Word2Vec. To determine the optimal hyper- ACL 0.48 0.51 0.60 0.42 0.34 0.29
parameters for the model, we take the entire dataset TACL 0.52 0.56 0.66 0.48 0.38 0.47
and split it into a 80-20 ratio, and given the embed- CL 0.67 0.78 0.80 0.75 0.65 0.59
ding of a paper, the task is to predict the year in NAACL 0.48 0.52 0.59 0.47 0.39 0.33
which the paper is published. Given this vector for COLING 0.48 0.53 0.55 0.46 0.37 0.30
a paper, we use a linear regression model such that EMNLP 0.57 0.59 0.66 0.51 0.46 0.45
given this vector, the model is supposed to predict
the year in which the paper was published. We Table 7: Cosine Distance between conference vectors
 and mean class vectors of languages.
measured both R2 measure of variance in regres-
sion and mean absolute error (MAE). R2 is usually
A.5 Taxonomy classification
We release our full language taxon-
omy classification on the website:
https://microsoft.github.io/linguisticdiversity.

A.6 Class-wise log(MRR) over the years per
 conference
We plot MRR on a log scale for each conference
to measure the progress of inclusion of the defined
taxonomy classes over the years. It is very inter-
esting to note how LREC has very smooth forward
progression.
 (a) c = LREC

 (a) c = ACL
 (b) c = WS

 (b) c = CL
 (c) c = EMNLP

 (c) c = COLING
 (d) c = NAACL

 (d) c = CONLL
 (e) c = SEMEVAL
You can also read