UPDATE OF CHARGES IOPS WORK ON FEES AND - International ...
←
→
Page content transcription
If your browser does not render page correctly, please read the page content below
IOPS Working Papers on Effective Pensions Supervision, No.20

UPDATE OF IOPS WORK ON FEES AND
CHARGES

                                       Liviu Ionescu and Edgar A. Robles
                                                              April 2014

© IOPS 2014                       1
IOPS WORKING PAPERS ON EFFECTIVE PENSIONS SUPERVISION

As the proportion of retirement income provided by private pensions becomes increasingly important, the
quality and effectiveness of their supervision becomes more and more crucial. The IOPS Working Paper
Series, launched in August 2007, highlights a range of challenges to be met in the development of national
pension supervisory systems. The papers review the nature and effectiveness of new and established
pensions supervisory systems, providing examples, experiences and lessons learnt for the benefit of IOPS
members and the broader pensions community.

IOPS Working Papers are not formal publications. They present preliminary results and analysis and are
circulated to encourage discussion and comment. Any usage or citation should take into account this
provisional character. The findings and conclusions of the papers reflect the views of the authors and may
not represent the opinions of the IOPS membership as a whole.

                                      IOPS WORKING PAPERS
                              ON EFFECTIVE PENSIONS SUPERVISION
                                   are published on www.iopsweb.org

      This document and any map included herein are without prejudice to the status of or sovereignty over any
territory, to the delimitation of international frontiers and boundaries and to the name of any territory, city or area.

© IOPS 2014                                                2
UPDATE OF IOPS WORK ON FEES AND CHARGES

                                             ABSTRACT

A primary objective of the paper was to update the charge ratios for the countries that originally
participated in the 2008 exercise, while looking at the historic trends of both fees charged by pension
funds to members and the operating expenses of pension funds.

The paper also attempts to bring a fresh view on the issue of international fees comparison. Previous
work tried to explain fees variation across different jurisdictions by taking into consideration factors
such as GDP, ratio of total pension assets to GDP, the mandatory or voluntary nature of the retirement
system, etc. However, the results of such research have not been conclusive, in part because of the data
challenges of cross-country comparisons.

This paper tries instead to explain the evolution of fees within countries, comparing the level in 2012-13
to that of six years ago by taking into consideration the reforms that jurisdictions have enacted since
2008, the year of the previous research.

Keywords: charge ratios, fees and costs, pension funds, regulation, government policy

JEL codes: G23, G28

                                                    3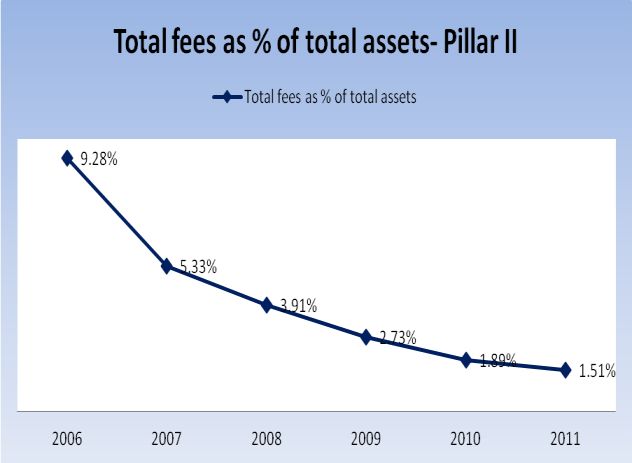
TABLE OF CONTENTS

UPDATE OF IOPS WORK ON FEES AND CHARGES ..............................................................................5
  I. Introduction ..............................................................................................................................................5
  II. Fees and ‘value for money’ .....................................................................................................................7
  III. Charges in different countries – overview and explanations .................................................................8
  IV. Methodology of the charge ratio..........................................................................................................13
  V. Summary of historic trends in fees........................................................................................................15
  VI. 2012/2013 Charge ratios in IOPS member jurisdictions .....................................................................17
  VII. Conclusions ........................................................................................................................................20
  ANNEX: Historical trends in fees .............................................................................................................22
     Chile .......................................................................................................................................................22
     Costa Rica ..............................................................................................................................................25
     Hong Kong, China..................................................................................................................................28
     Hungary ..................................................................................................................................................30
     Israel .......................................................................................................................................................32
     Macedonia ..............................................................................................................................................33
     Mexico....................................................................................................................................................34
     Poland .....................................................................................................................................................38
     Romania .................................................................................................................................................39
     Turkey ....................................................................................................................................................41
  REFERENCES ..........................................................................................................................................44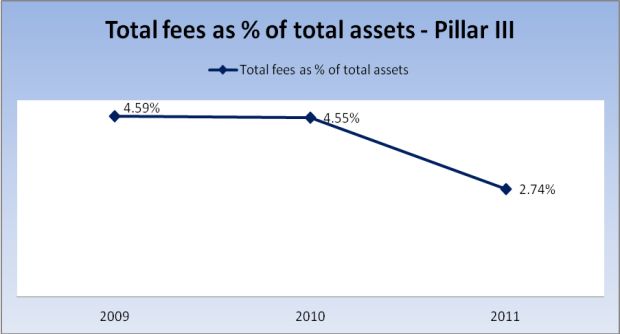
UPDATE OF IOPS WORK ON FEES AND CHARGES1
I. Introduction
The growing role of private pension systems and the ongoing shift from defined benefit (DB) to
defined contribution (DC) have turned fees and charges into a major concern for pension supervisory
authorities. This is because these fees and charges have a significant impact on the amount of retirement
income delivered to individuals.
In the past, when DB plans were widespread, management costs did not impact plan members
directly, as they had a promise on the level of pension they would receive. Members were not expected to
pay for the running costs of the plans. However, costs still held a high level of importance, particularly to
the plan sponsor, who would in most cases be responsible for meeting the costs. In DC (and some hybrid)
plans, where each individual saves for his or her own pension, members are typically charged a fee for
administration and asset management services, although in some occupational arrangements employers
bear management costs. These costs can have a substantial negative impact on future retirement income.
Comparing fees and charges across jurisdictions is a difficult task for a number of reasons:
one challenge in such comparisons is the different reporting methods for fees and costs across
jurisdictions, and the extent to which reported fees, costs and expenses include the same elements
(e.g. fees charged by investment funds in a pension fund portfolio).
the structure of fees differs across jurisdictions. Pension funds may charge fees on assets under
management, fees on flows, fees on contributions, fees on returns, fees on salaries etc. These
expenses may be chargeable by differing parties (the fund, the administrator, other service
providers) and paid by either the pension fund, the contributing member, an employer or out of
underlying investment capital.
since the designs of pension systems are different from one another, pension funds may be
required to perform quite different tasks. Hence, fees and charges may be used to finance different
services and/or products. This means that even where data may be comparable, raw figures might
not accurately reflect whether fees are high or low. A higher fee could be explained because it is
used not only to provide asset management services, but also collection, recovery and payment
services, unemployment or disability benefits, insurance, etc.
the maturity of the pension system in question – the structure of pension managing companies’
income in a newly established market may be substantially different to the fees structure in the
developed market. For example, upfront fees in the former and management fees in the latter may
have the biggest importance.
The diverse charges and the specific details involved in every single case make it difficult to directly
compare pension fund fees and charges internationally. Such comparisons are particularly challenging and
the caveats need to be carefully understood.
1
The paper benefited from valuable comments received from the IOPS Members and from the IOPS Referee (Mr
Ross Jones). Contributions from Ms Fiona Stewart (previously IOPS/OCED), Mr Juan Yermo (OECD),
and Mr Dariusz Stańko (IOPS/OECD) are also kindly acknowledged.
5A primary objective of the research undertaken here was to update the charge ratios 2 for the countries
that originally participated in the 2008 exercise (Hernandez and Stewart, 2008), while looking at the
historic trends of both fees charged by pension funds to members and the operating expenses of pension
funds. The research also attempts to bring a fresh view on the issue of international fees comparison.
Previous work, which we reference further on, tried to explain fees variation across different jurisdictions
by taking into consideration factors such as GDP, ratio of total pension assets to GDP, the mandatory or
voluntary nature of the retirement system, etc. But the results of such research have not been conclusive, in
part because of the data challenges of cross-country comparisons. This paper tries instead to explain the
evolution of fees within countries, comparing the level in 2012-13 to that of six years ago by taking into
consideration the reforms jurisdictions have enacted since 2008, the year of the previous research.
The paper contributes to the literature by providing updated information about the pension funds fees
level, their structure and recent developments. The key findings of this paper are as follows:
complicated fee structures impede the ability of pension fund members to compare the costs of
pension funds;
the proper design of the pension system assures a high level of transparency of fees and of the
quality of the pension services so that the members can properly compare pension fund providers;
imposing fee caps aimed at lowering the costs can have unintended effects;
some innovative approaches towards better transparency and lower fees may employ the fee
auction mechanism (pioneered by Chile) or mandated cost indicators;
charge ratios can help in cross-country cost analyses, however, a generalized comparison of
charge ratios across countries, without taking into consideration numerous differences (outlined
in section III), would lead to substantially misleading conclusions.
The paper is structured as follows: section two puts fees in the context of ‘value for money’ and
provides a history of previous work on comparing fees across different jurisdictions. Section three, based
on the data submitted by members, looks at the nominal charges and their underlying components reported
by members to be in place. Section four briefly explains the methodology of the charge ratio (detailed
methodology is referenced in the previous version of this paper). Section five provides a summary on the
historical trends that fees charged to members have followed over the years. The detailed information
about these trends as well as changes in pension funds’ operating expenses is presented in the Annex at the
end of this paper. Section six presents and analyses the 2012/13 calculations of charge ratios, done for
three time horizons of accumulation period (40, 30 and 20 years, respectively). The last part concludes.
2
Charge ratio measures the impact of administrative fees on the final balance of investment. It can be defined as
1 – Y/N where Y is the actual value of the retirement account (with all charges/fees borne by the saver) and
N is the final value of the same retirement account assuming there are no charges/fees at all. See more in
paragraph 26.
6II. Fees and ‘value for money’
1. How do charges influence the final retirement balance?
Depending on how they are set, fees can reduce the net contribution paid into the individual account
or the assets accumulated. As noted by Whitehouse (2001), an increase in the annual management charge
of 1% of funds under management can reduce accumulated assets by as much as 20% (over a 40 year
period). Therefore, the impact of fees can be substantial. Seeking to ensure that costs are not excessive and
are fully and transparently disclosed is therefore an important aspect of DC supervision.
Inevitably, in DC pension systems, an argument can be made that one should not look at fees in
isolation but rather compare costs, performance and quality of service indicators jointly. A provider could
charge fees above its peers but if it also achieves a better investment performance or delivers a higher
quality service, the extra costs could be warranted. For instance, as argued by Tapia and Yermo (2008) 3,
asset allocation affects the level of charges. Investment in interest-bearing assets, such as deposits and
bonds, are generally cheaper than investment in equities, while passive investment is cheaper than active
investment. The cost of domestic and foreign investment may also differ. Fee comparisons between
providers and across countries need to ultimately take into account the possible links between these three
indicators: fees, performance and quality, leading to a measure of ‘value for money’ of the DC provider.
IOPS WP No. 15 asks the question whether higher costs signify a ‘better’ pension – either in terms of
higher returns being delivered to members, or in terms of quality of service, but it concludes “studies have
4
not shown that to be the case” and argues for “publishing compliance on a net return basis ”.
Administrative and other charges are not always explained clearly to pension fund members. Even if
they were, the impact might not be fully understood as people tend to be relatively unsophisticated when it
comes to analysing costs and returns over the long term5.
On the other hand, competition should drive costs and hence charges down. That is, it should be
possible for market forces to allow fund contributors to choose the best option (which will probably
involve a combination of costs and returns). However, this does not happen in many jurisdictions given the
reasons outlined above.
2. Previous work on charges
A small number of publications have previously compared fees across different jurisdictions.
One such publication is Tapia and Yermo (2008), which focuses on the fees that are charged to
individuals in the accumulation stage of mandatory, defined contribution pension systems. In making a
cross-country comparison, the paper measures the ratio of annual fees to assets under management and
focuses on the experience of Latin America, Central and Eastern Europe (CEE), Australia, and Sweden.
The indicator used is a simple cost measure, ‘a purely accounting figure that does not involve any
projections’. The results of the analysis show that the structure of fees adopted in the countries under study
3
Tapia, W. and J. Yermo (2008), “Fees in Individual Account Pension Systems: A Cross-Country Comparison”,
OECD Working Papers on Insurance and Private Pensions, no. 27, OECD Publishing.
4
See IOPS WP No 15 (2011), “Comparative Information Provided by Pension Supervisory Authorities”.
5
They tend to use so-called “hyperbolic discounting”, i.e. show preference for results that arrive sooner rather than
later, irrespective of their true real value.
7is fairly complex. Fees are influenced by many factors, including the size and the maturity of the system,
market structure, competition, investment strategy and regulations.
A 2001 paper written by Edward Whitehouse compares charges for funded pensions and it uses the
concept of charge ratios, a concept that is used in this paper and in its 2008 previous version.
According to this author, the empirical evidence showed very different charge levels between
countries with relatively similar systems, namely those based on individual accounts with individual (or, in
some cases, employer) choice of provider. The average charge varied from less than 15% to more than
30% of the value of the final pension savings. The countries with the most liberal policies on charges (i.e.
with no restrictions on level of fees) did seem to have relatively high mean charge levels, but the evidence
was far from definite6.
In the exercise of comparing fees internationally, undertaken in the current paper, the IOPS analyzed
several sets of data consisting of:
nominal fees and expenses that are in place in different jurisdictions and their underlying
components;
historical trends of the fees that pension funds charge to members or are charged by providers to
the funds – collected by the IOPS in order to highlight the dynamics incurred by these fees in
different countries;
operating expenses – collected by the OECD/WPPP to update the Global Pensions Statistics;
charge ratios – collected by the IOPS with the aim of providing a relevant comparison among
countries and to update WP No. 6.
III. Charges in different countries – overview and explanations
Recognising the limitations in cross-country comparisons, Table 1 summarises maximum fees (where
prescribed by law) and average fees for member countries. A third category, described in Table 1 as
‘others’, provides information on country-specific exceptions.
6
For further details see Whitehouse (2001).
8Table 1. Fees charged by pension funds in various jurisdictions
Report MAXIMUM fees on (%) AVERAGE fees on (%)
Country Notes
Year Contributions Salary Assets Returns Other Contributions Salary Assets Returns Other
Albania 2013 3.00 2.40 Market average fee by assets.
Botswana 2010 0.60
Bulgaria (2nd pillar) 2012 5.00 1.00 BGN 20 4.97 1.00 Other: transfer fee.
Other: transfer fee, entry fee, early withdrawal
Bulgaria (3rd pillar) 2012 7.00 10.00 BGN 20 2.75 9.43
fee and additional information fee.
Other: Insurance as a percentage of salary for
Chile 2012 N/A 1.42 1.26 independent and voluntary worker. Average
weighted by number of contributors.
Colombia 2012 1.31 1.70 Other: Insurance as a percentage of salary.
Costa Rica 2013 1.1 (2017: 0,35)
Croatia (2nd pillar) (1) 2012 0.80 0.65 (2013: 0.45) 0.80 Other: exit fee (for mandatory funds charged
only if changing funds when having less than 3
Croatia (3rd pillar) (2) 2012 8.00 2.00 10.00 years of membership).
Czech Republic (3) 2013 0.60 15.00 0.60 15.00
Returns: over local bank average rates, Other:
Dominican Republic 2012 0.50 30.00 1.00
Insurance as percentage of salary.
El Salvador 2012 2.20 1.10 1.11 Other: Insurance as a percentage of salary.
Estonia (4) 2011 1.20 / 2.00 1.49
Ghana 2011 2.50
Greece (5) 2011 0.90
Hong Kong (6) 2013 1.70
The Central Bank of Hungary calculatees charge
Hungary 2013 0.90 0.20
ratios (fee components related to assets).
(In Rupee) Opening charges: 150; Record
India 2013 0.25 0.25 Rs 225
keeping: 225.
Israel 2012 6.00 0.50 3.80 0.33
Kazakhstan 2011 15.00
Kenya 2010 0.36
Latvia (7) 2012 2.00
Lithuania (8) 2013 2.00 (2016: 0) 0.65 / 1.00 0.05 1.86 0.65 / 0.99 Other: fee on transfers. Simple average fee.
Macedonia 2013 4.00 (2020: 2.00) 0.54 (2020: 0.36) EUR 15 4.00 0.54 EUR 15 Other: transfer fee for people switching earlier
Mexico 2012 1.50 1.38
Namibia 2011 0.85
Panama (SUMEVAL) 2012 2.50 2.50
Panama (SIACAP) 2012 0.30 0.30
Peru 2013 1.62 1.23 Other: Insurance as a percentage of salary.
Poland (9) 2011 3.50 0.60 3.50 0.46
Romania (2nd pillar) 2012 2.50 0.60 5.00 2.50 0.60 Other: transfer fee for people switching earlier
Romania (3rd pillar) 2012 5.00 2.40 4.58 1.79 0.21 Other: transaction fees, audit fees, depositary
Russia 2010 0.40Report MAXIMUM fees on (%) AVERAGE fees on (%)
Country Notes
Year Contributions Salary Assets Returns Other Contributions Salary Assets Returns Other
Serbia 2012 2.27 2.00
Slovak Republic (2nd pillar)
2013 1.25 0.30 10.00 1.25 0.30 10.00
(10)
Slovak Republic (3rd pillar)
2013 0.90 - 1.80 10.00 5.00 0.90 - 1.80 10.00 5.00 Other: fee on transfers.
(11)
South Africa 2010 0.39
South Korea 2011 0.70
Spain (occupational) 2012 2.00 0.50 0.21
Other: custodian fees.
Spain (personal) 2012 2.00 0.50 1.39
Other: exit fee (charged only for a maximum
period of 10 years) and entrance fee; the cap for
Turkey (12) 2013 2.00 1.09 - 2.28 10.0 N/A 2.00 N/A
these types of fees is 10% of the monthly gross
minimum wage.
United Kingdom (13) 2011 1.50 N/A
Uruguay 2012 1.77 1.40 Other: Insurance as a percentage of salary.
Notes:
1. In the mandatory system, exit fees are equivalent to 0.8% of the individual account for exiting in the first year of membership, 0.4% for exiting in the second year of membership and
0.2% for exiting in third year of membership.
2. In the voluntary system, the contribution based fee and exit fee depend on the number of years of membership or the amount of contributions. Open voluntary pension funds can
charge a sum of up to HRK 1500 for the first contribution and up to 8% of every contribution, thereafter with a maximum HRK 400 annually. The asset management fee amounts to a
maximum 2% of the total pension fund assets. Closed voluntary pension funds charge up to 2% of every contribution, but no more than HRK 400 annually. The asset management fee
amounts to a maximum 1.6% of the total pension fund assets.
3. The figures correspond to the maximum statutory fees for transformed funds from January 2013.
4. The value of 1.20% refers to conservative funds, while the value of 2.00% refers to all other funds.
5. These fees are fixed and contain only entry fees. The provided figure represents an average for the occupational pensions in Greece.
6. The figure refers to the average Fund Expense Ratio (“FER”) of MPF constituent funds as of December 2013.
7. The composition of fees and charges varies significantly between different pension schemes. Some of the schemes provide charges deducted from contributions, while others use
average assets as a basis for calculation. Also, sometimes 'assets under management' charges are deducted from return on assets. Therefore each scheme has its own structure and
these are not comparable. The average fee provided is calculated at the level of the whole pension system.
8. The value of 0.65% refers to conservative funds, while the value of 1.00% refers to all other funds.
9. 0.8 percentage points out of the fee on contributions is charged by the Social Insurance Agency.
10. 0.25 percentage points out of the fee on contributions is charged by the Social Insurance Agency.
11. The figures correspond to a maximum that pension funds can charge. Fee of 0.90% and 1.80% can be charged out of the average net annual value of pay-out and contributory
supplementary pension fund´s assets, respectively.
12. The values 1.09% and 2.28% refer to the maximum fees on assets of liquid funds and stock funds respectively. The maximum fees on assets of other funds are included in this
range.
13. This represents a statutory cap on annual management charges for one type of personal pension arrangement, the stakeholder pension plan. Other than for stakeholder pension
plans, there is no statutory limit or cap on charging in the UK. Average figures are not available as TPR does not collect information from schemes.
Source: Supervisory authorities’ data, IOPS, OECD, World Bank.
10The numbers show the variety of charges applied in different jurisdictions. While there is a tendency
of countries from a same region (i.e. Latin America, Central and Eastern Europe, etc.) to have comparable
ways of charging individuals because they have a comparable structure of the pension system, these
particularities can vary greatly across wider geographical regions.
The information contained in the table clearly shows that in many situations where a legal cap on fees
exists, the market average coincides with the legal maximum fees. This shows that these legal requirements
are not very efficient in incentivising market competition. One can observe this especially in the mandatory
systems, while in voluntary systems, there seems to be some degree of competition or at least some
variation from the legal maxima.
A further complication in both domestic and cross-country fee comparison is that some types of fees
and charges are levied directly against the contributing member (out of salary), some are deducted against
the contribution (contribution-based charges) and some are indirect, deducted out of the assets of the
pension fund itself, thus reducing the value of the fund to members. This means that ultimately these fees
are borne by members as well, but cannot be attributed for each and every single member, making the
international comparison even more difficult. The table below reflects what underlying components are
included in the data upon which charge ratios were calculated. This exercise clearly shows the challenges
involved in the international comparison of fees, and is also useful for identifying similarities and
differences across systems.
Table 2. Cost and fee elements incorporated in charge ratio (CR) calculation process and
ascending degree of underestimation of the final CR numbers
Investment
Plan/scheme management fees, for: Investment Under-
Custodian Guarantee
Country administration transaction Other estimation
primary underlying fees fees
fees costs of CR
funds only funds
Albania ● ● ● ● ● ●
Israel ● ● ● ● ●
Hong Kong ● ● ● ● ● ●
Bulgaria ● ● ● ● ●
Turkey ● ● ●
Panama ● ● ● ●
Peru ● ● ● ● ● ●
Chile ● ● ● ● ● ●
Romania ● ● ● ● ●
El Salvador ● ● ● ●
Czech Republic ● ● ● ● ●
Hungary ● ● ● ● ●
Macedonia ● ● ● ●
Mexico ● ● ● ●
Colombia ● ● ● ●
Spain ● ● ●
Croatia ● ● ● ●
Costa Rica ● ● ●
India ● ● ●
Poland ● ● ●
Notes: A cell marked with ‘●’ means that the fee component is included in the charge ratio calculations.
A blank cell means that the fee component is not included in the charge ratio calculations.A crossed cell means that the fee component is not applicable in the jurisdiction.
Other types of fees: audit fee, marketing fee, legal fee, etc.
For the following countries: Bulgaria, Croatia, Poland, and Romania, the table above refers to the second pillar only.
Source: Supervisory authorities’ responses.
The table has been tentatively sorted in the descending order of the extent to which the underlying
data incorporate the full range of fees, charges and expenses that ultimately affect member benefits.
Obviously, the ordering in this table must be somewhat discretionary as it is subject to subjective
assessment. Due to the diversity of cost positions in the countries, it seems impossible to design a more
‘scientific’ approach. In this way Albania has the most inclusive estimation of the charge ratio and we can
assume that the charge ratio is an accurate reflection of how much the assets accumulated by a member of
the Albanian pension system would be reduced by the totality of fees, charges and expenses compared to a
scenario where no fees would apply. On the other hand, the group of countries at the bottom of the table
have the least inclusive estimations of the charge ratio because fees related to outsourced management
(underlying funds), custodian fees and investment transaction costs were not taken into account when
calculating the charge ratio.
As a general rule, if a certain cost does not constitute an explicit fee and is paid from the net asset
value7 of pension savings, then we considered it as not included in the explicit fees used in calculating the
charge ratio. This is because in such a case, the member will bear the cost indirectly, by having this charge
deducted from the net asset values of his or her fund. This cost cannot be attributed individually for each
member or (in case of individual accounts) it can be attributed but such an operation would require some
detailed data and calculations. On the other hand, in some jurisdictions, it is the pension company
(administrator of the pension fund) that pays some of the fees listed in the table above such as custodian
fees, transaction costs, audit fees, etc. In such cases, we considered that these fees are included in the
explicit fees because, from the member’s point of view, he or she does not suffer a further diminishing of
assets by paying indirectly for these services.
Having entirely comparable data is not possible, as demonstrated by the summary table above. The
table helps, however, to understand the limitations associated with the data collected. For example, in the
overwhelming majority of cases, the data used to calculate the charge ratio include plan administration fees
and investment management fees for primary funds. On the other hand, the only jurisdictions where
investment management fees for underlying funds are included in the charge ratios are Albania, Israel,
Hong Kong, Bulgaria and Turkey. When it comes to custodian fees and transactions costs, in most of the
jurisdictions which declared these types of fees to be included, they are paid by the pension companies. All
these differences can influence the final calculations of the charge ratio, so that is why it is important not
to compare all charge ratios altogether, but rather to compare the numbers for these systems
(‘’clusters’’) that have the same or similar characteristics, or as a basis of identifying changes in overall
fee trends over time within individual jurisdictions.
7
Net asset value (NaV) is understood here as the value of a fund’s assets less the value of its liabilities.
12IV. Methodology of the charge ratio
The charge ratio is an indicator of the fees charged on individual retirement accounts and has proven
to be quite useful in making cross-country comparisons. It measures the impact that any type of charge can
have on the final balance of an individual retirement account compared to the hypothetical balance that
could be obtained if no fees were charged at all8.
The first step to calculate the charge ratio is to estimate the asset accumulation in the individual
retirement account for an average worker on an annual basis. This is done by taking an average wage as
given and calculating the contribution flow into the retirement account according to the current legislation
in each country, as well as applying a fixed rate of return (same for all countries), and all of the fees that a
worker who enters the workforce today is expected to pay during the period before he retires. The typical
period for such calculation is 40 years, but it can be adjusted to reflect the fact that for some workers the
contribution period may be shorter.
The equation below is the general formula used to estimate the asset accumulation in the individual
retirement account in each period. It determines the accumulated balance at the end of a working life for an
average worker in a given country taking into consideration the fees charged by a particular pension
manager which operates in that country. For doing this, the calculation is repeated i times, where i is the
number of years of contribution period, i.e. 40 times for a contribution period of 40 years.
{[ ( ) ( )] [( ( ) ) ( ) ( )]} ( )
where:
Sf = balance in the individual retirement account at the end of period i.
Si = balance in the individual retirement account at the beginning of period i.
Fi = Flow contribution to the individual retirement account in period i, including all contributions from
employers, employees and the government.
cs = Any fixed contribution which is not subject to charges on flows or a fixed charge on flows (in which
case it would be a negative number).
α = Proportional charge on flows (as a percentage of Fi).
β = Proportional charge on assets under management.
i' = Real rate of return net of charges on returns.
γ = Proportional exit fee.
The formula used to calculate the charge ratio is the following:
8
Although the process of calculation is briefly mentioned here, a more detailed description of the methodology can be
found in the previous paper. See Appendix 1, page 30 in: Gomez Hernandes and Stewart (2008).
13The calculations use annual data. This is a theoretical exercise since the future cumulative balance is
projected as if the current commissions are maintained during a 40-year period. The only exception for the
latter is when a country has set a timetable to reduce fees in the future by means of an approved legislation
(such as in Costa Rica, Macedonia and recently Poland). The real rate of return refers to a standard (yet not
necessarily unquestionable) assumption of what a DC pension scheme should yield on average in the long
run. As a convention, the rate is set, as an assumption, at 5%. This does not represent necessarily the
historical rate of return for any specific national system. The exercise assumes a 100% contribution density
and a zero account balance to start with. The result is independent of the wage level.
The caveats of the charge ratio should be spelt out clearly. Firstly, as mentioned in the previous
section, the charge ratio is not a perfectly accurate calculation of how much any one member’s savings
would diminish as a result of fees and charges in a given jurisdiction. This is because, aside from the fees
that he or she is charged directly, there are other costs that a member bears indirectly and which are
charged to the overall assets of the pension fund. In this way, the charge ratios calculated are actually
underestimated for some jurisdictions, as indicated in Table 2. Secondly, the fee structure varies greatly
from country to country, and that is why cross-country comparison should be handled carefully. It may not
reflect reality closely without the kind of proper analysis represented in Table 2. Thirdly, the effect of
(absolute fees) may vary depending on the rate of return assumed. Finally, it is worth remembering that the
level of fees is somehow related to the asset allocation profile. Thus a ‘cheap’ system (expressed either in
terms of low fees or charge ratios) does not necessarily imply that the absolute value of the retirement pot
at the end of accumulation savings will be higher than in an ‘expensive’ system that offers much higher
rates of return. While comparing the costs/charges, some caution must be exercised in making assumptions
about the outcomes.
14V. Summary of historic trends in fees
The detailed presentation of recent changes in pension funds’ fees and operating expenses are
provided in the Annex. Table 3 contains a summary of this discussion and shows the different mechanisms
countries have adopted in order to make fees decrease.
Table 3. Measures taken to decrease fees in various IOPS countries
Changing or
Imposing Improving
Country simplifying Others
fee caps transparency
fee structure
Chile Auction mechanism
Costa Rica System maturity, merger of
schemes/funds
Hong Kong Competition, enhanced disclosure,
consolidation of member accounts,
system maturity, merger of
schemes/funds, investment education
for members, automating and
streamlining administration
Hungary System maturity
Israel Competition
Macedonia
Mexico Merger of schemes/funds
Peru Auction mechanism
Poland
Romania Financial education for members,
merger of schemes/funds
Turkey System maturity
Source: Own compilation based upon IOPS members’ input.
The following conclusions can be drawn based upon the analysis of the historical trends:
transparency is in most cases a legislative requirement for pension funds and will always help,
but if different types of fees are allowed, comparison becomes a difficult task for individual
members. To assist, the regulator could require providers to publish a synthetic cost indicator and
communicate it to members in an accessible manner (for instance, in the annual pension
statement or in their pay statement)9;
9
In addition to Mexico and Hong Kong, the Italian regulator, COVIP, introduced new regulation in 2006 requiring
pension funds to calculate a synthetic cost indicator so as to increase transparency to members and
facilitate the comparison of costs applied by different kinds of pension funds. The indicator displays all
costs paid by a member (in the accumulation phase) as a percentage of the assets of his/her individual
account. This indicator is now widely used in the Italian specialized press, while in Hong Kong the Fund
Expense Ratio (FER) is always used as the basis for debate/discussion while comparing cost information
from different DC providers. For further information on the synthetic cost indicators used by Italy and
Hong Kong, see IOPS (2011).
15 introducing a single type of fee (either on contributions or on assets under management) makes
comparisons between providers much easier10 and in this way facilitates choice by members of
the lowest cost provider, leading to increased competition and lower fees charged to members;
introducing an auction mechanism which declares as default option the lowest-cost providers11 –
members are automatically assigned to these funds in case they do not make a choice;
setting price caps may result in some undesirable consequences. As previously mentioned in the
earlier research on this topic (Tapia and Yermo, 2008), one problem with setting maximum limits
on fees is the risk that authorities set the wrong ceiling. Setting the limit too high might not have
the desired effect – pension funds may converge towards the ceiling level and thereby actually
lowering the competition. Setting a ceiling that is too low may prevent fund managers from
covering operational costs and in the short term, might go as far as inhibiting competition by
discouraging new pension funds to enter the market. In CEE countries, the cap was set at the start
of the system and has not been reviewed regularly. On the other hand, in Mexico it was
introduced after a period of liberalized fees, when the gap between maximum and minimum fees
charged by commercial providers was quite significant. With the introduction of the fee caps by
CONSAR, the pensions regulator in Mexico in 2010, the maximum fees dropped significantly
and the spread of fees diminished accordingly;
while policy reforms can contribute to lowering fees, it is often difficult to disentangle their
impact from other factors, such as the natural tendency for costs indicators like ‘fees as
percentage of total assets’ to decline as the pension fund industry matures and the assets
accumulated grow (reaping efficiency gains from economies of scale).
Pension authorities are clearly looking for ways to improve the transparency of costs. Although this
should be accompanied by financial education and increased awareness, studies have shown that financial
education is not a “panacea” and “whatever the level of financial understanding, the pensions market
cannot be effective without transparency in a clear and understandable [language]” (Pitt-Watson and
Mann, 2012). Members should be aware of what they are buying, and how much it costs, in order for them
to become more interested in making choices and actively managing their benefits.
At the same time, providers in some countries are becoming more engaged towards the customer. In
the UK for example, the National Association of Pension Funds, in association with groups representing
consumers, employers and employees, has launched a Code of Conduct to help employers understand the
impact of charges when choosing a pension scheme for their employees. According to the Code, its scope
is to “provide information about charges to employers in a form they can understand, as part of good
transparent practice” and “allow a more ready comparison of charges and services so that employers and
trustees are able to act as well informed customers”.
10
Assuming, of course, that providers offer a similar type of investment portfolios.
11
One might also impose some additional minimum requirement on funds’ historical returns (for example that their
results are above some minimum threshold such as inflation).
16VI. 2012/2013 Charge ratios in IOPS member jurisdictions
The results for the 2012/2013 calculations are the following (Table 4):
Table 4. Charge ratio calculations for average fees reported in Table 1
30 Years 20 Years
40 Years Charge
% Assets Under Management Charge Charge
Ratio
Ratio Ratio
Jurisdiction 2008 2012/13 2012/13 2012/13
Albania n/a 45.12% 34.92% 23.83%
Botswana n/a 14.70% 10.44% 6.69%
Bulgaria (2nd pillar) 26.51% 26.51% 20.86% 15.31%
Bulgaria (3rd pillar) n/a 13.44% 10.47% 7.67%
Chile 17.40% 14.20% 14.20% 14.20%
Colombia 12.73% 12.70% 12.70% 12.70%
Costa Rica 21.07% 9.05% 6.66% 4.49%
Croatia (2nd pillar) 22.21% 11.74% 8.71% 5.85%
Croatia (3rd pillar) n/a 44.47% 35.88% 26.80%
Czech Republic 38.14% 28.51% 21.28% 13.99%
Dominican Republic 19,35% 23.76% 18.77% 13.90%
El Salvador 11,97% 11.00% 11.00% 11.00%
Estonia n/a 31.56% 23.69% 15.68%
Ghana n/a 46.40% 36.03% 24.66%
Greece n/a 20.67% 15.19% 9.84%
Hong Kong 36.42% 35.01% 26.48% 17.64%
Hungary 22.57% 5.93% 4.50% 3.17%
India n/a 6.35% 4.58% 2.93%
Israel 13.67% 11.71% 9.49% 7.41%
Kazakhstan n/a 16.84% 12.29% 7.91%
Kenya n/a 8.96% 6.45% 4.09%
Latvia n/a 39.59% 30.25% 20.36%
Lithuania n/a 22.72% 16.88% 11.20%
Macedonia 20.24% 11.65% 9.35% 7.34%
Mexico 31.56% 29.67% 22.19% 14.62%
Namibia n/a 19.75% 14.49% 9.37%
Panama (SUMEVAL) n/a 46.40% 36.03% 24.66%
Panama (SIACAP) n/a 7.50% 5.39% 3.41%
Peru 15.01% 15.80% 15.80% 15.80%
Poland 18.74% 14.35% 11.35% 8.50%
Romania (2nd pillar) n/a 16.10% 12.29% 8.67%
Romania (3rd pillar) n/a 38.47% 30.05% 21.34%
Russia n/a 9.86% 7.11% 4.52%
Serbia 37.51% 29.31% 22.56% 15.86%
Slovak Republic (2nd pillar) 19.03% 19.17% 14.36% 9.70%
Slovak Republic (3rd pillar) n/a 43.48% 33.52% 22.78%
South Africa n/a 9.56% 6.89% 4.37%
South Korea n/a 16.53% 12.06% 7.75%
Spain (occupational) n/a 5.32% 3.81% 2.40%
17Spain (personal) n/a 29.84% 22.32% 14.72%
Turkey 45.88% 39.59% 30.25% 20.36%
United Kingdom n/a 31.73% 23.83% 15.77%
Uruguay 12.39% 14.10% 14.10% 14.10%
Source: Own calculations based upon the average fees data from Table 1.
Calculations to make projections of retirement income are usually run on a 40-year time span (see for
example OECD, 2011). However, it may be the case that in some countries such a period may not be very
representative of actual contribution patterns. Therefore, the same calculations were run for a 30-year and
20-year working life. Obviously the accumulation period being shorter, the charge ratio is smaller (less is
paid as fees and charges over a shorter period of time).
There are a number of countries in Latin America (i.e. Chile, Colombia, El Salvador, Panama, Peru,
and Uruguay) where the charge ratio is substantially the same, regardless of the time horizon. This happens
because these pension systems only allow fees on inflows and not on assets under management, so the
charges paid by an individual do not depend on how much is accumulated over the working-life period.
Some explanations on a country basis are set forth below.12 It is important to reiterate that
a superficial and generalized comparison of charge ratios across countries would not be relevant, for
reasons outlined earlier in the paper. Readers wishing to make cross-country comparisons should do this
cautiously, at least taking into consideration the input data differences outlined in Table 2.
As described in the section on fees trends, the reforms in the Turkish private pension system also
touched on the fee structure. These reforms clearly had an impact on the charge ratio. We can see an
important decrease in the new charge ratio calculated in 2012 compared to 2008.
The charge ratio for Hong Kong shows a decrease compared to its 2008 value, with some more
reforms having commenced in the second part of 2012, which will likely continue the trend in the
following years. As previously observed, it is important to note that the FER used as a basis for calculating
the charge ratio incorporates elements that are not taken into account in the data for other systems13.
The different changes in legislation have led to a decrease in Mexico’s calculated charge ratio for
2012. In line with this indicator, the Mexican pension system is still quite expensive, but according to
CONSAR, the targeted effect has been partially reached due to the reduction in the average fee by almost
one-third between 2008 and 2012. Furthermore, a roadmap is in place to reduce the cap to 1% by 2015. On
the other hand, CONSAR fears that imposing a fee cap may force the exit of those pension providers that
have not yet reached economies of scale. It may also put limits on investment strategies and services
differentiation among companies that manage pension funds and it may hinder incentives for financial
innovation and risk management policies.
12
Some of the 2008 calculations in the previous paper have been revised to standardize the calculations to a 40-year
span (e.g. Mexico).
13
This includes incorporation of all fees of any underlying investment structure, the impact of fee rebates and
guarantee fees. Service providers often rebate an amount of fees back to individual members (for example,
as a way of reducing the effective level of fees to employees of larger employers). Such a rebate (which in
effect lowers the total fee impact) is not reflected in the calculated figure. It is not possible to quantify
precisely the overall impact, but the estimated effect may reduce the FER by around 10%. In addition,
about 2% of the Hong Kong FER figure represents guarantee fees, i.e. the amount paid to a guarantor to
provide the guarantee in such funds. In total, these impacts might materially impact the relativity of the
Hong Kong figures compared to other jurisdictions presented in Table 4.
18Chile’s charge ratio has seen an important reduction. This could be explained by the reforms put in
place starting 2008, which led to the elimination of the fixed fee and the possibility of charging only a fee
on salary, could have had a big impact by making the issue of comparing costs for members much easier.
In addition, the auction mechanism has also been an important reform for diminishing the fees charged by
pension funds. The new pension fund that entered the market after the auction (AFP Modelo) has gradually
increased its market share and has influenced the charge ratio and the weighted mean of fees. In 2010, AFP
Modelo started with a share of 0.57% of the market and by December 2012, after a second auction it won,
its market share increased to 7.67%. In December 2012, AFP Modelo had already surpassed a couple of
the other pension funds in terms of members and/or contributors. However, one can see that the spread
between the fees charged by AFP Modelo and its peers is still large, so it is possible that other pension
funds feel pressure from the competition and lower their fees. On the other hand, the market has seen little
mobility of members between entities that manage pension funds. Indeed, the latest auction mechanism
(carried out in January 2014) resulted in success for the AFP with, until now, the highest fee. During the
January 2014 auction, this AFP made an offer of0.47% of salary (vs. an average system’s fee of 1.42%).
This new lowest fee level will be applied from August 2014 and will benefit both new entrants to the
pension system and all previous members of the AFP that won the recent auction.
In 2012 there was a reform in the pension law in Peru aimed at increasing competition between
pension managing companies. The reform provided for more flexibility for transfers among administrators,
and introduced the auction mechanism for new entrants. It also initiated a transition from fees based on
salary towards fees based on asset under management (AUM)14. A mixed fee (salary and AUM) structure
was created for a period of ten years over which the fees based on salary will decline and ultimately
disappear in 2023. The impact of this transition (mixed fees) will be seen over the coming years. At the
moment, as a result of the above measures, the fees based on salary have reduced from an average of
1.91% in July 2012 to 1.62 % in December 2013.
Israel’s charge ratio has not changed much compared to 2008. Nevertheless, a new regulatory
framework for setting a lower ceiling for management fees in life insurance policies and provident funds,
which came into force in 2012, may contribute to the future decrease of the charge ratio.
Romania’s charge ratio (for the mandatory system) ranks around the middle of the chart. Although it
is a young system, with only six years of functioning, one might consider it as positioning itself as a
reasonably cost-effective pension system. Further developments to address transparency issues could
ensure a larger portion of members ‘shopping’ for good fees and thus increasing their market power.
There are several countries whose charge ratio has dropped significantly: Slovakia, Costa Rica,
Poland, Hungary and Czech Republic.
Slovakia’s 2012 charge ratio slightly increased from 19.03 (2008) to 19.17 in 201315. There was the
significant decrease in the fee cap imposed through legislation by the National Bank of Slovakia. In 2008,
all pension funds charged the same amount for assets under management (0.78%), but starting June 2009,
it was lowered to 0.3%. However, the average fee on returns has been equal to 10%, which as a result
counterweights the effect of lower management fees. Further changes were adopted starting from April
2012, when each pension provider was required to manage a new “index fund” which tracks a major equity
14
As this is a gradual process, this structural change has not yet been accounted for in Table 1 that shows the average
market fees.
15
As was specified in footnote 10 to Table 1, 0.25 percentage points of the 1.25% fee on contributions is charged by
the state Social Insurance Agency. If taking into account only the fee charged by managing companies,
equal to 1%, the charge ratios for 40-, 30- and 20- years’ horizons would be equal to 18.96%, 14.14% and
9.47%, respectively.
19index. As of 1 January 2013, the pension fund managing companies are no longer obliged by the relevant
legislation to manage the index funds; however they are allowed to do so if they should wish.
Costa Rica has experienced one of the most significant decreases of the charge ratio, from 21.07 to
9.05. According to the supervising authority (Superintendencia de Pensiones of Costa Rica), this may be
explained by the progressive lowering of fee caps on assets under management. These were programmed
to go from over 2% when this gradual decrease started, to 0.35% in 2020. The cap is now at 1.1% and will
reach 0.7% in 2014. Nonetheless, the Costa Rican market has seen a decrease in the number of private fund
administrators from nine participants at its inception in 2000 to six today.
Poland’s charge ratio also fell dramatically from 2008. This and the substantial decline in 2010 can be
explained in view of the new legal limit (3.5% maximum) on upfront fees, which fell by almost 40%. In
2011, the rate of contribution to open pension funds was reduced, and this caused a further decline. One
may expect further reductions in charges ratio after legislative changes, scheduled for 2014, have taken
place. The details of the 2014 pension reform are presented in the Annex.
Hungary’s charge ratio has decreased dramatically from 2011. In the 2008 exercise, the 40-year
charge ratio was 22.57%, whereas currently it is only 5.93%. The underlying force for this change was a
drastic reduction in the fees charged on both contributions and assets. Further details of these changes are
presented in the Annex.
The significant decrease in the Czech Republic may be explained by the important structural reforms
adopted in the pension system starting in 2013: introduction of the second pillar, some changes in
parameters of the third pillar, but the main influence is the important restrictions in total fees chargeable by
pension funds.
VII. Conclusions
The paper provides an important database of the fees, charges and expenses charged in different
jurisdictions, for both some IOPS members and non-members. The database contains the maximum fees
allowed by law (where such fee caps exist) as well as the average market fee per type. This gives the reader
a first idea of the different fee-charging structures and levels across pension systems internationally.
One key lesson that emerges from the country experience surveyed in this paper is that the more
complex the fee structure in a retirement system is, the harder for members to compare across pension
funds. They find it difficult to get a clear image of the way these fees can reduce their future retirement
benefit. In some countries in Latin America, allowing only one type of fee has had a positive impact on fee
levels, as it has become easier for members to make comparisons between different pension providers. This
is the case of Mexico where commercial pension fund managers (AFOREs) can charge only fees on assets
under management, while in Chile Administradoras de Fondos de Pensiones (AFPs) can charge only a
proportional fee as a percentage of salary for every contribution made to the system.
Although reducing fees remains a major policy concern, it is worth emphasizing that the quality of
service of pension funds is also important for supervisors. Thus, when designing or improving a particular
pension system, a key characteristic should be a high degree of transparency and comparability both for the
fees charged and the quality of service providers, which then allows members to increase their ’shopping
power’.
The paper also identified a series of policies which were put in place by the surveyed jurisdictions and
which had different impacts on the fee levels.
20Some jurisdictions have introduced fee caps in their systems, and the outcome has not been the same
for all. While sometimes it can be an effective policy for reducing fees, it can also prove to be less
productive in triggering a fee decrease. Fee caps may even cause a different set of problems (such as
reduced incentives on pension providers for enhancing operational efficiency).
Chile’s innovative policy approach towards fees was to introduce an auction mechanism for pension
funds’ managing companies. All new members are automatically assigned to the pension fund with the
lowest fee. This has made it possible for a new pension fund operator to enter the market and even win a
second auction by further reducing its fees.
These reforms had an impact on cost levels. Both in Chile and in Mexico a downward trend in fees
can be observed since the implementation of the latest reforms.
There are other jurisdictions, like Italy and Hong Kong, where the problem of transparency has been
addressed by imposing a legal requirement for pension funds to publish a synthetic cost indicator.
Although in Hong Kong the average FER of MPF constituent funds in the mandatory system has declined,
further reforms are being implemented to make the system more cost-competitive: launching low-fee
funds, facilitating trustees to merge smaller scale or less efficient schemes/funds, facilitating trustees to
further automate and streamline their administration process, and encouraging members to consolidate
their personal accounts.
The CEE countries, amongst other countries surveyed, have quite a complex fee structure which
makes it difficult for members to fully compare costs between pension funds. In these jurisdictions the sole
legal requirement for pension funds to publish all the fees that they can charge to members does not meet
the intended purpose. Consumers would benefit from a move towards greater clarity of pension charges, in
addition to the cap on fees that is quite common in these jurisdictions.
There are several countries in which the charge ratio dropped dramatically, such as Costa Rica,
Poland, the Czech Republic and the Slovak Republic. Costa Rica is gradually lowering the cap on fees on
assets under management. A similar reform – important restrictions on different fees charged by pension
funds – has been adopted in the other three countries.
The paper uses the concept of ‘charge ratio’ for the cross-country comparisons of fee structures. In
addition, it adds to the literature of international comparison of fees by collecting data from some
jurisdictions in which fee components have been included in the charge ratio calculations. In this way the
reader can get a better idea of what limitations are involved in international comparison of fee levels and
charge ratios, as well as the extent to which charge ratios are a more or less inclusive estimate. It is
important to reiterate that a generalized comparison of charge ratios across countries, without
taking into consideration the differences outlined in section III, would lead to substantially
misleading conclusions.
21You can also read