Monitoring and Epidemiological Trends of - OSF
←
→
Page content transcription
If your browser does not render page correctly, please read the page content below
Monitoring and Epidemiological Trends of
             Coronavirus Disease (COVID-19)
                    Around The World
                         Arnab Saha 1, Komal Gupta 2, Manti Patil 3
                 1
                 Indian Institute of Technology, Kharagpur, West Bengal, India
                      2
                        Banasthali University, Vanasthali, Rajasthan, India
          3
            Sardar Vallabhbhai National Institute of Technology, Surat, Gujarat, India

ABSTRACT

COVID-19 has struck fear into populaces all through the world and shocked the worldwide
restorative community, with the World Health Organization (WHO) pronouncing it a widespread
as it were approximately three months after the flare-up of the infection. A new different virus
(primarily called ‘Novel Coronavirus 2019-nCoV’) causing severe acute respiratory syndrome
(coronavirus disease COVID-19) emerged in Wuhan, Hubei Province, China in December 2019
and rapidly spread to other parts of China and other countries around the world. The outbreak of
the novel coronavirus disease (COVID-19) has caused more than 850,000 people infected and
approx. 40000 of deaths in more than 190 countries up to March 2020, extremely affecting
economic and social development. Presently, the number of infections and deaths is still
increasing rapidly. COVID-19 seriously threatens human health, production, life, social
functioning and international relations. In the fight against COVID-19, Geographic Information
Systems (GIS) and big data technologies have played an important role in many aspects. This
paper describes the usage of practical GIS and mapping dashboards and applications for
monitoring the coronavirus epidemic and related activities as they spread around the world. At
the facts level, in the generation of massive data, information no longer come on the whole from
the authorities but are gathered from greater diverse enterprises. As of now and for a long time in
the future, the improvement of GIS should be fortified to create a data-driven framework for fast
information securing, which implies that GIS ought to be utilized to fortify the social operation
parameterization of models and methods, particularly when giving back for social
administration.

Keywords: COVID-19, GIS, Disease, Monitoring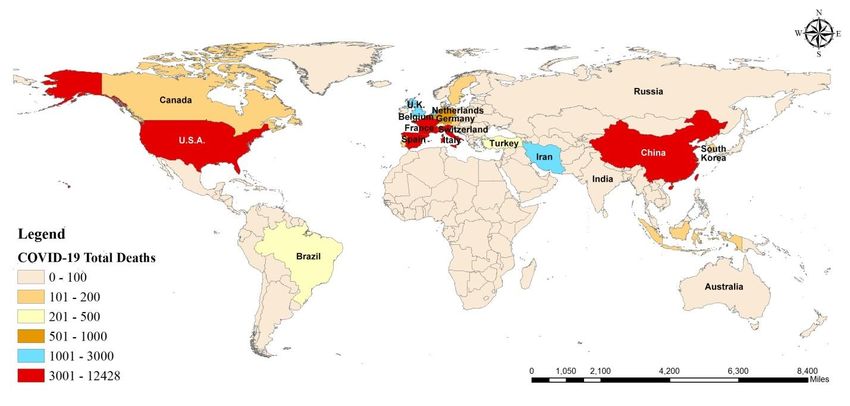
Introduction
Rising infectious diseases are remarkable threats to public health worldwide. The new
coronavirus pneumonia has been named as Coronavirus Disease (COVID-19) by the World
Health Organization (WHO) and declared a pandemic on March 11, 2020 (WHO, 2020). This
coronavirus was at to begin with called the 2019 novel coronavirus (2019-nCoV) by WHO on 12
January 2020. WHO authoritatively referred to as coronavirus disease 2019 (COVID-19) and
coronavirus study group of the Worldwide committee recommended that the current coronavirus
be named SARS CoV-2 on 11 February 2020 (WHO, 2020; Murugesan et al., 2020). In 1930s
Coronaviruses were first discovered (Estola et al., 1970) and Human coronaviruses were first
recognized in the 1960s and concern in these viruses advanced significantly in 2002 from the
emergence of Severe Acute Respiratory syndrome CoV (SARS-CoV) (Drosten et al., 2003;
Ksiazek et al., 2003; Peiris et al., 2003).

The outbreak of 2019 novel coronavirus disease (COVID-19) is a public health emergency of
global difficulty that had triggered greater than 860,000 infections and more than 40000 deaths
in more than 190 countries by March 31, 2020 (WHO, 2020; Worldometer, 2020), critically
affecting financial and social improvement. United Nations (UN) Secretary General referred to
as on governments to take action to do the entirety feasible to control the COVID-19 epidemic
on February 28 (New.cn, 2020; Zhou et al., 2020). China stated a cluster of pneumonia cases in
humans related to the Huanan Seafood Wholesale marketplace in Wuhan, Hubei Province on
December 31, 2020 (WHO, 2020). Moreover, there is no current evidence that the source of
COVID-19 originated in the Huanan seafood market. Various researches have proposed that the
bat might be a potential pool of COVID-19 (Giovanetti et al., 2020; Paraskevis et al., 2020).
Bats are considered to be the common store for numerous infections, of which a few are
conceivable human pathogens, which infect respiratory, gastrointestinal and neurologic diseases.
(Yadav et al., 2020). Somehow, bats are natural pollutants of a wide extend of CoVs, such as
SARS-CoV and MERS-CoV viruses in 2003 and 2012, respectively, have accepted the
transmission from animal to animal, and human to human (Hampton, 2005; Banerjee et al.,
2019; Li et al., 2005; Cauchemez et al., 2013; Al-qaness et al., 2020). However, the source of
the COVID-19 is not confirmed yet, and it requires more investigations and researches.

Chinese health authorities showed that this cluster was related to a unique coronavirus, 2019-
nCoV on January 7, 2020 (WHO, 2020; Holshue et al., 2020). A total of 9976 confirmed cases
have been stated in at least 21 nations on January 30, 2020 (John Hopkins University report,
2020), 7 such as the primary confirmed case of Coronavirus infection in the United States, stated
on January 20, 2020 (Holshue et al., 2020). Because of rapid pandemic ability and the absence of
vaccines and drugs, the infectious COVID-19 disease devastated the everyday lifestyles
throughout the globe. According to the observation of early study of disease transmission of
COVID-19, the incubation duration of COVID-19 extends from 1 to 14 days (Li et al, 2020; Lin
et al., 2020). Most of the COVID-19 infected people, respiratory indications ought to be mild to
direct and improve without the required for medical treatment.

At the starting of the epidemic, the restorative and investigate communities reacted rapidly. The
Chinese government took conclusive measures to lock down the city of Wuhan and to shut the
outside routes to all cities in Hubei Territory on January 23, 2020 (State council, 2020; Zhou et
al., 2020). From January 23, 2020 to April 8, 2020, Wuhan, the capital city of Hubei Province,
was in lockdown. China has embraced colossal individual and financial misfortunes and has won
important time for the Chinese and for worldwide avoidance and control of the epidemic (Zhou
et al., 2020). Amid this period, utilization of GIS and spatial enormous information innovation,
which have a high degree of logical and innovative display (Zhou et al., 2016; Zhou et al., 2020),
to supply imperative scientific and specialized back to permit the government to judge the
epidemic circumstance and define anticipation and control measures (Health Commission of
Hubei Province, 2020).

Access to real-time GIS data is essential to the public, scientists, and public health officials.
During the battle against epidemic, GIS and spatial enormous information innovation have
played a critical part in distinguishing the spatial transmission of the epidemic, in spatial
avoidance and control of the epidemic, in spatial allotment of assets, and in spatial discovery of
social assumption, among other things (Zhou et al., 2020). With the development of GIS
generation, a statistics system for a relevant situation can be built rapidly, specifically in terms of
database control, spatial evaluation tools, and mapping. Disease mapping and environmental
hazard evaluation utilizing advanced geospatial information assets are presently built up
expository analytical tools in both human and veterinary public health (Bergquist and Rinaldi,
2010; Richardson et al, 2013; Cicalò and Valentino, 2019).

The World Health Organization, detecting this potential, has begun to gather this spatial
information all over the world to encourage the moderation and control of the spread of certain
infections. Since the World Health Organization (WHO) is the specialist, inside the United
Countries framework of observation and coordination for public health, it must provide technical
assist to international locations, monitoring and to evaluate health developments globally (Cicalò
and Valentino, 2019). Since the outbreak of COVID-19, in expansion to the news distributed by
the governments, epidemic data has too been broadly disseminated through web platforms such
and other channels. ESRI’s expert Kenneth Field appealed that coronavirus mapping should be
responsible (Field, 2020).

For Multi-city modeling of COVID-19 epidemics using spatial networks, Pujari and Shekatkar,
(2020), propose a computationally efficient hybrid method that makes use of SIR model for
individual cities which are in turn coupled through experimental transportation systems that
encourage movement among them. This model disseminates the overall population into
compartments for Vulnerable, Tainted and Recuperated people, and a set of coupled differential
equations describes the movement of population from one compartment to another. The results
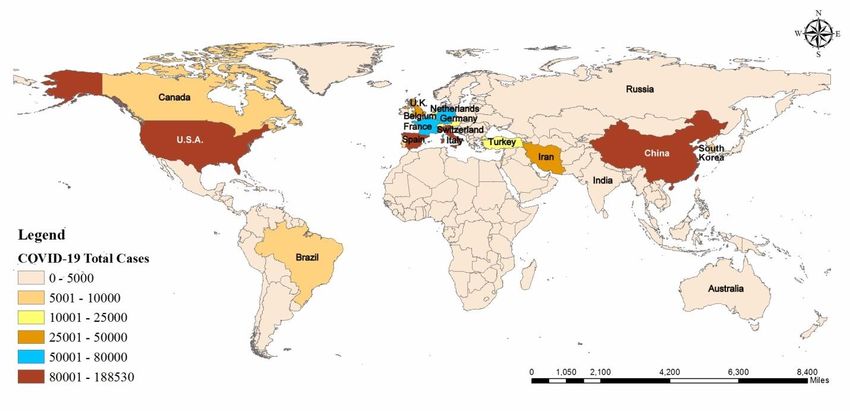
extend that through the domestic transportation, the significant population is balanced to be
uncovered inside 90 days of the onset of epidemic. Kumar et al., (2020) predicted some
trajectories of COVID-19 till April 30, 2020 using the most advanced Auto-Regressive
Integrated Moving Average Model (ARIMA) for the top 15 most infectious countries. Based on
forecasts, public health authorities ought to tailor aggressive mediations to get a handle on the
control exponential development, and quick infection control measures at hospital levels are
critically required to reduce the COVID-19 pandemic and the United States of America (USA)
will come as a surprise and going to become the epicenter for new cases during the mid-April
2020.

The spatiotemporal spread of irresistible infections in expansive populaces could be an
exceptionally expansive and complex framework that postures awesome challenges to numerical
modeling (Grassly and Fraser, 2008; Riley, 2007). When a major epidemic happens, the negative
affect of instability and freeze on social operations may surpass that of the viral infections.
Subsequently, this investigates connected enormous social media information to track and assess
the spatial spread of open estimation (Miller and Goodchild, 2015).

Methodology
This paper will discuss the role of data visualization in the relationships between health research
and geospatial information sciences. We considered maps for the multidimensional dynamic
appearance of the epidemic situation, such as the cumulative distribution map of confirmed cases
of 860,000 people and the distribution map of places. We strictly tracked the global official
websites to collect the epidemiological information about COVID-19 pandemic. The number of
total new confirmed cases and total deaths of COVID-19 was presented to exemplify the trend of
this epidemic. Spatial analysis will be executed and geostatistical maps on the predominance of
indications and positive test probability will be developed.

Results
An overview of epidemic trends of new cases and deaths of COVID-19 across 180 countries and
territories from January to March 31, 2020, is showed in Figure 1 and 2. Thirty-one days of the
March 2020, the world is not likely to soon forget. It was the month that a new coronavirus
disease that had infected tens of thousands in China becomes a global pandemic. On March 1,
nearly 89000 cases of COVID-19 disease caused by the virus had been reported worldwide
(WHO, 2020). Then, the vast majority of the cases were still in China, the original epicenter of
the disease. By end of this month, infections worldwide increased nearly 10 times, to nearly
860000 cases, and deaths soared from over 3000 to more than 40000 (WHO, 2020).
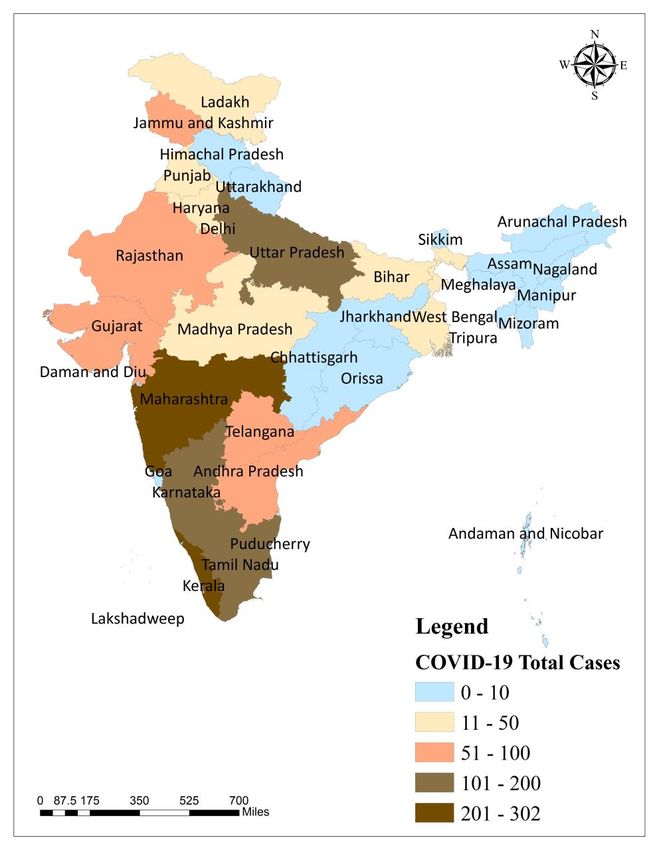
Iran and Italy suffer dramatic increases in infection numbers in early March. Iran’s health
minister was one of the first public officials to be visibly sickened by the disease (South China
Morning Post, 2020). Iran’s epidemic reached the top levels of its government and mass graves
were dug in the countryside. In Italy, the virus spread fast, despite early attempts to protect
citizens from the novel coronavirus. The nation already declared a state of emergency by the end
of January, after a Chinese couple holidaying in Rome tested positive for COVID-19. Italy
reported its first local case on February 20, but the virus had already been circulating in the
country for some time. During Italy’s peak flu season, people were being diagnosed with
influenza, when they may actually had COVID-19. Infections in Italy rose from four cases on
February 20 to nearly 106000 by the end of March (WHO, 2020; South china morning post,
2020). By the end of the month nearly 12500 deaths related to COVID-19 were also recorded
more than three times the number of fatalities in China. This despite the Italy’s government
ordering a lockdown for the entire country on March 9 (South china morning post, 2020). After
Italy, Spain has the most COVID-19 related deaths in the world, nearly 8500 people died in
March (WHO, 2020) and the infections there jumped more than 1000 times. The Spanish
government announced a near-total lockdown on March 15 to try to curb the spread of the virus
(South china morning post, 2020). But thousands of new cases are still being reported every day,
leaving hospitals overwhelmed and the health services at the breaking point.

While much of the rest of Europe restricted people’s movements, the United Kingdom took a
vastly different approach at first. Thy hoped to stagger the rate of infections in the British
population, so as not to overwhelm the public health care system. The number of new cases
accelerated. By then, nearly 4000 people in the UK had tested positive for COVID-19. Over the
course of March, infections in the UK went from 36 to over near 25000 (WHO, 2020). And from
zero fatalities on March 1st, the country saw nearly 1800 succumb to the disease by the end of the
month. At the beginning of the March, there were 158 cases of COVID-19 in the United States.
In two weeks, infections had risen to 9197 (WHO, 2020). After that the US government did
finally urge people to stay at home if they or a family member showed symptoms of the virus
and to limit gathering to no more than 10 people. But in the two weeks following the plea,
COVID-19 cases in the US increased to more than 188000 and the death cases shot up to more
than 12000 people (in Figure 1 and Figure 2) (WHO, 2020).

In India, the primary COVID-19 disease case was detailed on January 30, 2020, according to the
Ministry of Health and Family Welfare, Government of India. The various preliminary cases in
India came from contact with the individuals having a history of traveling from Iran, Italy, and
China. The first COVID-19 death in the country was reported on March 13, 2020 (MoH&FW,
India). For the increasing rate of COVID-19 infections, the country declared lockdown from
March 22, 2020 to till date. Being a nation of 1.3 billion people the adequacy of giving lockdown
may be a major hurdle to the Government. The total number of cases in India is presented in
Figure 6. The most affected state of coronavirus infection is Maharashtra, Delhi and Kerala till
March 31, 2020 showed in Figure 6. (MoH&FW, India)
As global COVID-19 cases surged in March, life began to slowly return to normal in Mainland
China. The number of new cases and deaths plummeted in the country, with the majority of new
cases being those imported from overseas. Officials credit the complete lockdown of Hubei
province, as well as tight restrictions and quarantine rules in other cities, as being key factors in
containing the virus. For many other countries still struggling to stop the spread of COVID-19
and the next several months are crucial. Figure 3 showing that the numbers of daily cases are
increasing in the world and other countries reached a peak of 73620 on March 31, 2020, and it
will be continue to increase. Figure 4 also shows that since January 23, 2020, the total numbers
of deaths are increasing from March 5, 2020. In Figure 5, we found that the numbers of daily
deaths are increasing significantly since March 9, 2020. May be the number of deaths is going to
rise exponentially to rising in the future.

Conclusions
COVID-19 is characterised by means of an extended incubation length, sturdy infectivity and
issue of detection, which has caused the sudden outbreak and the speedy development of a
deadly disease. This case requires GIS and massive data generation to allow rapid responses and
analyses, a short supply of facts about the epidemic dynamics and information of the epidemic
improvement rules to offer timely assist for the prevention and manage decisions and
movements. In summary, COVID-19 is quite unique from SARS. It is actually more infectious
and detrimental. There are still numerous instabilities around the epidemic. The number of
detailed cases in the world expanded during March, for the most part due to people with travel
records to the influenced locations. Right now, the number of COVID-19 cases is increasing in
many other nations. All the local governments should be taking various preventive and control
measures to restrict the transmission based totally on the infection stage of each city.

References
Al-qaness, M. A., Ewees, A. A., Fan, H., & Abd El Aziz, M., 2020. Optimization method for
forecasting confirmed cases of COVID-19 in China. Journal of Clinical Medicine, 9(3), 674. doi:
10.3390/jcm9030674

Banerjee, A., Kulcsar, K., Misra, V., Frieman, M. and Mossman, K., 2019. Bats and
Coronaviruses. Viruses, 11(1), 41. DOI: https://doi.org/10.3390/v11010041

Bergquist, R., & Rinaldi, L.. 2010. Health research based on geospatial tools: a timely approach
in a changing environment. Journal of helminthology, 84.01 (2010), 1-11.
Cauchemez, S.; Van Kerkhove, M.; Riley, S.; Donnelly, C.; Fraser, C.; Ferguson, N., 2013.
Transmission scenarios for Middle East Respiratory Syndrome Coronavirus (MERS-CoV) and
how to tell them apart. Euro Surveill. Bull. Eur. Sur Les Mal. Transm. Eur. Commun. Dis. Bull.,
18, 20503.

Cicalò, E., & Valentino, M., 2019. Mapping and visualisation on of health data. The contribution
on of the graphic sciences to medical research from New York yellow fever to China
Coronavirus. DISEGNARECON, 12(23), 12-1.

Drosten, C., Günther, S., Preiser, W., Van Der Werf, S., Brodt, H. R., Becker, S., ... & Berger,
A., 2003. Identification of a novel coronavirus in patients with severe acute respiratory
syndrome. New England journal of medicine, 348(20), 1967-1976.

Estola, T., 1970. "Coronaviruses, a New Group of Animal RNA Viruses". Avian Diseases. 14
(2): 330–336. doi: 10.2307/1588476

Field, K, 2020. responsibly. Mapping coronavirus https://www.esri.com/arcgis-blog/
products/product/mapping/mapping-coronavirus-responsibly/.

Giovanetti, M., Benvenuto, D., Angeletti, S. and Ciccozzi, M., 2020. The first two cases of 2019-
nCoV in Italy: Where they come from?, J. Med Virol, 92(5), 518-521. DOI:
https://doi.org/10.1002/jmv.25699

Grassly, N., Fraser, C., 2008. Mathematical models of infectious disease transmission. Nature
Reviews Microbiology 6 (6), 477–487.

Hampton, T., 2005. Bats may be SARS reservoir. JAMA. 294(18), 2291. DOI:
https://doi.org/10.1001/jama.294.18.2291

Health Commission of Hubei Province.
http://wjw.hubei.gov.cn/bmdt/ztzl/fkxxgzbdgrfyyq/xxfb/202002/t20200213_2025580.shtml/.
2020. (In Chinese)

Holshue, M. L., DeBolt, C., Lindquist, S., Lofy, K. H., Wiesman, J., Bruce, H., ... & Diaz, G.
(2020). First case of 2019 novel coronavirus in the United States. New England Journal of
Medicine.

Johns Hopkins University CSSE. Wuhan coronavirus (2019-nCoV) global cases, 2020.
(https://gisanddata.maps.arcgis.com/apps/opsdashboard/index.html#/bda7594740fd40299423467
b48e9ecf6).

Ksiazek, T. G., Erdman, D., Goldsmith, C. S., Zaki, S. R., Peret, T., Emery, S., ... & Rollin, P.
E., 2003. A novel coronavirus associated with severe acute respiratory syndrome. New England
journal of medicine, 348(20), 1953-1966.
Kumar, P., Kalita, H., Patairiya, S., Sharma, Y. D., Nanda, C., Rani, M., ... & Bhagavathula, A.
S., 2020. Forecasting the dynamics of COVID-19 Pandemic in Top 15 countries in April 2020:
ARIMA Model with Machine Learning Approach. medRxiv. doi: 10.1101/2020.03.30.20046227

Li, W., Shi, Z., Yu, M., Ren, W., Smith, C., Epstein, J. H., Wang, H., Crameri, G., Hu, Z.,
Zhang, H., Zhang, J., McEachern, J., Field, H., Daszak, P., Eaton, B., T., Zhang, S. and Wang,
L.-F., 2005. Bats are natural reservoirs of SARS-like coronaviruses. Science. 310(5748), 676-9.
DOI: https://doi.org/10.1126/science.1118391

Li Q, Guan X, Wu P, Wang X, Zhou L, Tong Y, et al., 2020, Early Transmission Dynamics in
Wuhan, China, of Novel Coronavirus-Infected Pneumonia. N Engl J Med: 10.1056/ NEJMoa
2001316. doi: 10.1056/NEJMoa2001316. PubMed PMID: 31995857.

Lin, B., Zhong, H., Ni, Y., Liu, L., Zhong, J., & Su, X., 2020. Epidemiological Trends of
Coronavirus Disease 2019 in China. medRxiv.

Miller, H., Goodchild, M., 2015. Data-driven geography. Geojournal 80 (4), 449–461.

MoH&FW: Ministry of Health and Family Welfare, Govt. of India, Coronavirus disease
situation status, 2020, https://www.mohfw.gov.in/, (accessed 1st April 2020)

Murugesan, B., Karuppannan, S., Mengistie, A.T., Ranganathan, M., Gopalakrishnan, G., 2020.
Distribution and Trend Analysis of COVID-19 in India: Geospatial Approach. J. Geographical
Studies, 4(1), 1-9. doi: 10.21523/gcj5.20040101

New.cn, 2020. COVID-19 is urged by the UN Secretary General to do everything possible to
contain the outbreak, http://www.xinhuanet.com/2020-02/29/c_1125642849.htm/.

Paraskevis, D., Kostaki, E. G., Magiorkinis, G., Panayiotakopoulos, G., Sourvinos, G. and
Tsiodras, S., 2020. Full-genome evolutionary analysis of the novel corona virus (2019-nCoV)
rejects the hypothesis of emergence as a result of a recent recombination event. Infect Genet
Evol. 79, 104212. DOI: https://doi.org/10.1016/j.meegid.2020.104212

Peiris, J. S. M., Lai, S. T., Poon, L. L. M., Guan, Y., Yam, L. Y. C., Lim, W., ... & Cheng, V. C.
C., 2003. Coronavirus as a possible cause of severe acute respiratory syndrome. The Lancet,
361(9366), 1319-1325.

Pujari, B. S., & Shekatkar, S. M., 2020. Multi-city modeling of epidemics using spatial
networks: Application to 2019-nCov (COVID-19) coronavirus in India. medRxiv.

Richardson, D.B., et al., 2013. Spatial turn in health research. Science (New York, NY),
339.6126 (2013), 1390.

Riley, S., 2007. Large-Scale Spatial-Transmission Models of Infectious Disease. Science 316
(5829), 1298–1301.
South China Morning Post, 2020. March 2020: the month Covid-19 changed the world.

State council, http://www.gov.cn/xinwen/2020-01/23/content_5471751.htm/ . 2020 (accessed 23
January 2020). (In Chinese)

WHO: World Health Organization, Coronavirus disease (COVID-2019) situation Reports.
https://www.who.int/emergencies/diseases/novel-coronavirus-2019/situation-reports/, 2020
(accessed 1st April 2020).

WHO: World Health Organization. Pneumonia of unknown cause — China. 2020
(https://www.who.int/csr/don/05-january-2020-pneumonia-of-unkown-cause-china/en/).

WHO Director-General's remarks at the media briefing on 2019-nCoV on 11 February 2020
Geneva, Switzerland: World Health Organization (2020). Available from:
https://www.who.int/dg/speeches/detail/who-director-general-s-remarks-atthe-media briefing-on-
2019-ncov-on-11-february-2020.

Worldometer websites, Coronavirus disease reports.
https://www.worldometers.info/coronavirus/, 2020 (accessed 1st April 2020)

Yadav, P. D., Shete-Aich, A., Nyayanit, D. A., Pardeshi, P., Majumdar, T., Balasubramanian, R.,
... & Patil, S., 2020. Detection of coronaviruses in Pteropus & Rousettus species of bats from
different States of India. Indian J Med Res, DOI: 10.4103/ijmr.IJMR_795_20

Zhou, C., Su, F., Pei, T., Zhang, A., Du, Y., Luo, B., ... & Song, C. (2020). COVID-19:
challenges to GIS with big data. Geography and Sustainability.

Zhou, C., Su, F., Harvey, F., Xu, J., 2016. Spatial Data Handling in Big Data Era. Springer,
Beijing.
Figure 1: COVID-19 epidemic spatial pattern of total number of confirmed cases
                       in each nations of the world.

Figure 2: COVID-19 epidemic spatial pattern of total number of confirmed deaths
                        in each nations of the world.
Figure 3: The number of daily confirmed cases of COVID-19 in the world
Figure 4: The total number of daily deaths of COVID-19 in the world
Figure 5: The number of daily deaths of COVID-19 in the worldFigure 6: Distribution of the total numbers of confirmed cases of
COVID-19 in India till March 31, 2020You can also read