Spatial Distribution and Time Series Analysis of COVID-19 Pandemic in Italy: A Geospatial Perspective
←
→
Page content transcription
If your browser does not render page correctly, please read the page content below
Spatial Distribution and Time Series Analysis of
COVID-19 Pandemic in Italy: A Geospatial
Perspective
Muhammad Farhan Ul Moazzam ( farhan.moazzam@gmail.com )
Jeju National University https://orcid.org/0000-0002-5201-9649
Tamkeen Urooj Paracha
Hamdard University
Ghani Rahman
University of Gujrat
Byung Gul Lee
Jeju National University
Nasir Farid
University of Peshawar
Adnan Arshad
China Agricultural University
Research
Keywords: COVID-19, Public health, Geospatial analysis, IDW, Italy
DOI: https://doi.org/10.21203/rs.3.rs-73628/v1
License: This work is licensed under a Creative Commons Attribution 4.0 International License.
Read Full License
Page 1/17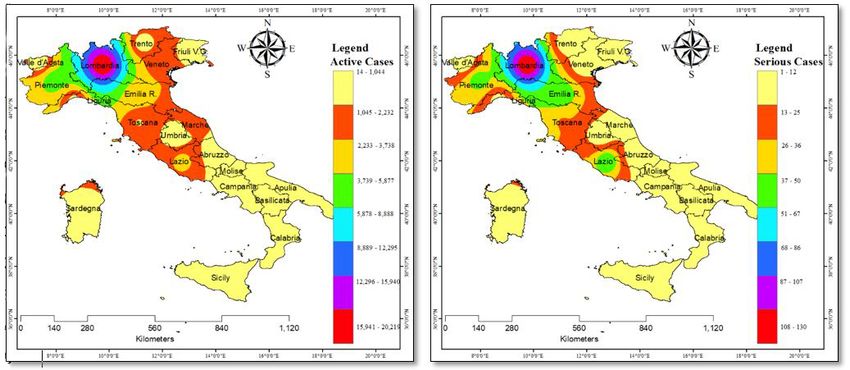
Abstract
The novel coronavirus pandemic disease (COVID-19) affected the whole globe, though there is lack of
clinical studies and its epidemiological features. But as per the observation, it has been seen that most of
COVID-19 infected patients show mild to moderate symptoms and they get better without any medical
assistance due to better immune system to generate antibodies against the novel coronavirus. In this
study the active cases, serious cases, recovered cases, deaths and total con rmed cases have been
analyzed using geospatial technique (IDW) with the time span of 2nd March to 3rd June 2020. As on 3rd
June the total number of COVID-19 cases in Italy were 231,238, total deaths 33,310, serious cases 350,
recovered cases 158,951 and active cases were 39,177 which has been reported by the Ministry of health,
Italy. March 2nd – June 3rd 2020 a sum of 231, 238 cases has been reported in Italy out of which 38.68%
cases reported in Lombardia region with death rate of 18% which is high from its national mortality rate
followed by Emilia-Romagna (14.89% deaths), Piemonte (12.68% deaths), and Vento (10% deaths). As
per the total cases in the region, the highest number of recoveries has been observed in Umbria (92.52%),
followed by Basilicata (87%), Valle d'Aosta (86.85%) and Trento (84.54%).

The COVID-19 evolution in Italy has been particularly found in the major urban area i.e. Rome, Milan,
Naples, Bologna and Florence. Geospatial technology played a vital role in this pandemic by tracking
infected patient, active cases, and the recovered cases. Thus, monitoring and planning using geospatial
technique is very important to control COVID-19 spread in the country.

Introduction
Pandemic wave of a deadly B-coronavirus (CoV) presenting with cases of extreme pneumonia originated
from Wuhan, China in December, 2019. It was initially referred as novel corona virus (2019-nCoV) by WHO
and also labelled as corona virus disease 2019 (COVID-19) [1–5]. International Committee on Taxonomy
of Viruses (ICTV) termed it the SARS-CoV-2 virus based on its similarity to sever acute respiratory
syndrome corona virus (SARS-CoV) [5]. In Italy, from 29th January till 16th June 2020, there have been
238,720 con rmed cases of COVID-19 with 34,345 deaths [6]. Not only Italy, corona virus has affected the
whole world grossly with con rmation of around 8,061,550 cases of COVID-19, including 440,290 deaths,
reported to WHO [7]. Even though Chinese researchers were able to provide SARS-CoV-2 genome
sequence [8] but continuous human to human transmission of this contagious virus has produced
devastating effects not only on human health sector but has dropped down world’s economy to a high
extent [9]. The potential of these corona viruses predisposing public health risk are quite higher and
detrimental [10, 11]. Albeit, fatality rate of COVID-19 infected persons in the Italian population, based on
data up to March 17, was estimated as 7.2% [12]. This rate is comparatively higher in other regions of the
world based on numerous factors such as testing strategies and population age [13] etc. Increased
mortality burden implies utilization of strategies and policies by the Governments worldwide limiting the
spread and transmission of this contagious virus via social distancing and other possible means such as
use of personal protective equipments, face masks and use of sanitizers etc. [14].

                                                  Page 2/17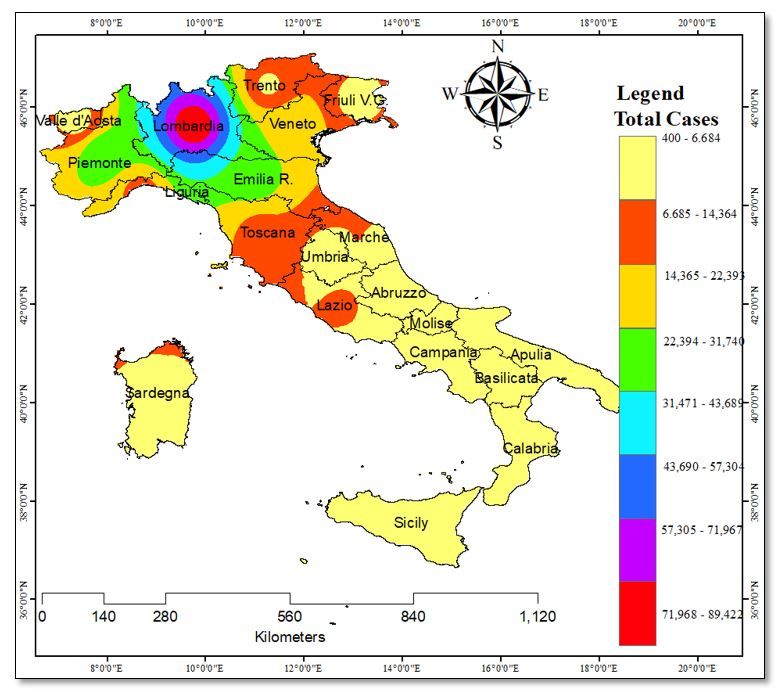
Various clinical manifestations have been shown by COVID-19 including mild to moderate symptoms
carriers along with asymptomatic infected carriers as majority to individuals with serious decline in lung
function and death [15, 16]. However, increase in mortality rate has been of relevance to individuals with
pre-disposed respiratory malfunctioning, prior asthma, any lung disorder or decreased immunity. Serious
illness caused by COVID-19 has been clinical dealt with use of mechanical support of ventilators and
maintenance of oxygen saturation level [17], [18]. With the advent of latest reports and data, there have
been researches enlisting features, disease transmission, its incubation and management protocols [10,
19]. A number of test trials are on-going based on their effectiveness to treat clinical manifestations of
COVID-19, since there is no de nite treatment or vaccine available to date. These clinical trials and
scienti c investigations regarding treatment include in-vitro chloroquine (old anti-malarial agent) [20],
hydroxy chloroquine (quinine analogue) [21], azithromycin [22], remdesivir (anti-viral drug) [17] and
dexamethasone for hyper in ammation in severe cases.

Many researchers have employed various techniques and strategies to address the spread of SARS
pandemics [23, 24]. Keeping various variable such as availability of appropriate health care systems,
measurements to keep up the pace with patients’ needs such as isolation practices and continuously
emerging spread has led to a number of research studies in this regard. In addition to all variables, spatial
distribution analysis and explicit geographic models are needed to predict and estimate the time series
analysis of COVID-19 pandemic. Hence, geographical information system (GIS), thematic and spatial
mapping are the emerging tools and are widely used throughout the world [25]. This study will provide a
platform for researchers to conduct studies on COVID-19 with scope of GIS and mapping approach.
Geospatial tools can be of essential use for knowledge, treatment, trend, and mitigation of the particular
disease. The use of geospatial approach can give the visual glimpse of disease spread geographically,
risk factors, and potential health facilities available for treatment. Therefore, these tools/methods can
relate to the designing, planning, and the distribution of international health aid for treatment and
prevention services [26]. The objective of this study is provide the spatial distribution of COVID-19, its
trend and time series analysis of the disease using geospatial approach in Italy.

Study area

Italy is located in South-Central Europe but also considered in a western Europe, its capital is Rome. The
total geographical area of Italy is 301,340 Km2. It shares the border with France, Switzerland, Austria, and
Slovenia. Italy consisting of a peninsula delimited by Alps mountains and surrounded by various islands.
Italy is third most populous country in the European Union member states. The major cities in Italy are
Rome, Milan, Naples, Bologna, Florence, Turin, and Genoa. According to 2019 the total population of Italy
is 60,317,116 with population density of 200.16 people/Sq.km (Figure 1). The most populous region in
Italy is Lombardia and the least populous is Valle d'Aosta (Table 1).

The overall representation of COVID-19 variables in Italy shown below in Fig. 2. Total 231,238 cases of
coronavirus have been reported from the last week of January to rst week of June 2020. It is worth to

                                                   Page 3/17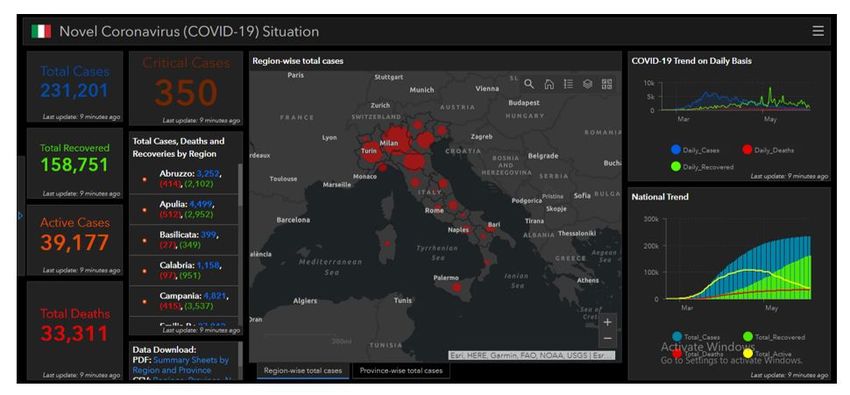
mention that out of total 231,238 cases, 72.14% cases completely recovered but unfortunately 14.45% of
people lost their lives while ghting against coronavirus and 13.40% cases are still active (Fig. 2).

                                                  Table 1
                            Region-wise Population of Italy (As of January, 2019)
                   Region                   Population        Area (Km2)   People/Sq.Km

                   Abruzzo                  1,311,580         10,763       121.86

                   Apulia                   4,029,053         19,385       207.84

                   Basilicata               562,869           9,995        56.31

                   Calabria                 1,947,131         15080        129.12

                   Campania                 5,801,692         13,590       426.90

                   Emilia-Romagna           4,459,477         22,446       198.67

                   Friuli-Venezia Giulia    1,215,220         7,858        154.64

                   Lazio                    5,879,082         17,236       341.09

                   Liguria                  1,550,640         5,442        284.93

                   Lombardia                10,060,574        23,884       421.22

                   Marche                   1,525,271         9,366        162.85

                   Molise                   305,617           4,438        68.86

                   Piemonte                 4,356,406         25,402       171.49

                   Sardegna                 1,639,591         24,090       68.06

                   Sicily                   4,999,891         25,711       194.46

                   Toscana                  3,729,641         22,993       162.20

                   Trentino-Alto Adige      1,072,276         13,607       78.80

                   Umbria                   882,015           8,456        104.30

                   Valle d'Aosta            125,666           3,263        38.51

                   Veneto                   4,905,854         18,399       266.63

                   Source: [27]

Material And Methods
The COVID-19 data for Italy was obtained from various sources [28-30]. The data of this study is the
number of COVID-19 con rmed cases, deaths, serious patients, active patients and recoveries from this

                                                  Page 4/17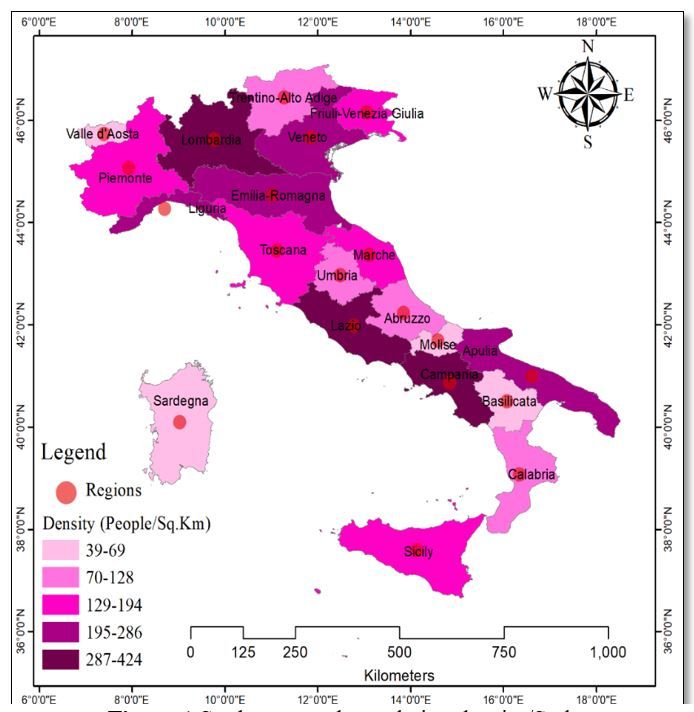
disease region-wise in Italy from early March 2020 to 3rd June, 2020. In the present study, to show the
pattern of disease transmission and forecasts the number of patients using GIS tool, the interpolation
technique used i.e. Inverse Distance Weighted (IDW).

Interpolation IDW

IDW is based on the concept of Tobler’s rst law (the rst law of geography) from 1970. It was de ned as
everything is related to everything else, but near things are more related than distant things. The IDW was
developed by the U.S. National Weather Service in 1972 and is classi ed as a deterministic method. This
is due to the lack of requirement in the calculation to meet speci c statistical assumptions, thus IDW is
different from stochastic methods (e.g., Kriging and TRA) [31].

Spatial interpolation (IDW) is the method based on the function of inverse distances in which weight
increases as the distance decreases and vice versa. It means that the points with known values used to
estimate values of unknown points. The necessities of known points discriminates spatial interpolation
from isopleth mapping, which uses allocated points such as polygon centroids for interpolation. A basic
theory in spatial interpolation is that the value to be assessed at a point is more in uenced by near known
points than those are farther away. The assumption of a random process is usually mandatory for a
stochastic method. Inverse Distance weighted (IDW) interpolation is an exact method that estimates the
value of a point that is in uenced by nearby known points than those farther away. The general equation
of IDW method is:

Where, Ki is the control value for Ith sample point, Wi represents a weight determining the relative
importance of individual control point Ki in the interpolation process, Kxy is the point to be estimated and
N is the number of sample points [32].

Results
The novel corona virus is well spread all over the country. There are total 231,238 cases reported from 2nd
March to 3rd June 2020 (Table 2). In this study, the region wise data was collected and linked it with point
data. The 20 region’s data of Italy has been analyzed to nd out the variability. The IDW technique was
used to show the current status and magnitude of the infection disease spread (COVID-19) in Italy using
ArcGIS 10.5.

Table 2 Region wise breakdown of COVID-19 Statistics in Italy

                                                  Page 5/17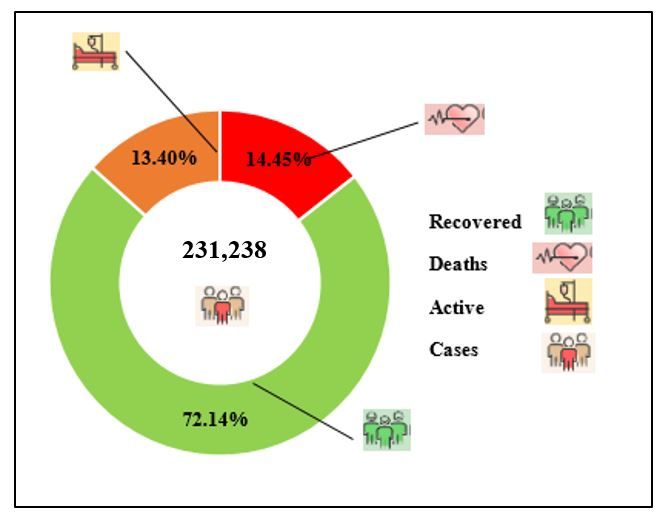
Region Con rmed Con rmed Serious Recovered Active
Cases Deaths Patients Patients Cases
Abruzzo 3252 414 3 2102 736
Apulia 4499 511 10 2952 1036
Basilicata 399 27 0 349 23
Calabria 1158 97 0 951 110
Campania 4821 415 4 3737 869
Emilia- 27842 4147 50 20856 2839
Romagna
Friuli-Venezia 3276 336 2 2707 233
Giulia
Lazio 7753 747 51 4188 2818
Liguria 9751 1473 6 7764 514
Lombardia 89442 16172 131 53046 20224
Marche 6735 987 8 4438 1310
Molise 436 22 2 287 127
Piemonte 30734 3898 44 22150 4686
Sardegna 1357 131 1 1080 146
Sicily 3447 275 7 2292 880
Toscana 10121 1055 25 8093 973
Trento 4433 463 2 3748 222
Umbria 1431 76 2 1324 31
Valle d'Aosta 1187 143 0 1031 13
Veneto 19164 1921 2 15856 1387
Total 231,238 33,310 350 158,951 39,177
*Ministry of Health, Italy (3rd June, 2020)
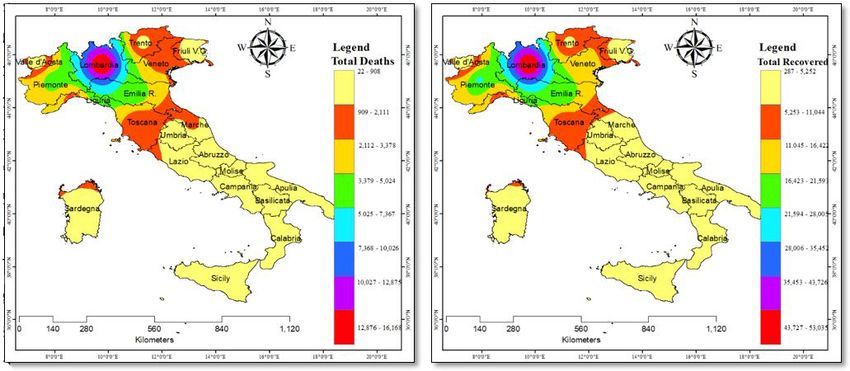
Interpolation using IDW has been applied with the of purpose of predicting the spread of the coronavirus
in Italy. As of June 3, 2020 in Italy a total of 39,177 active cases of coronavirus has been reported. The
map obtained from interpolation of active cases as per 3rd June, 2020 which was divided into eight
classes using natural break classi cation method. The pattern of classes is 14 to 1044, 1045 to 2332,
2333 to 3738, 3739 to 5877, 5878 to 8888, 8889 to 12295, 12296 to 15940, 15941 to 20219 as shown in
Page 6/17Figure 3. The various regions of Italy are at risk based on population density. More than 50% of active
cases were found in northern Italy particularly in the region of Lombardia due to the most populous
region of the Italy. It can be observed from Figure 3a that Piemonte region has the second highest active
cases with 4686 out of total 39,177 as of 3rd June, 2020. Emilia-Romagna and Lazio regions with 7.25%
and 7.19% of active cases respectively. In order to understand the in uence of population density, a
Pearson correlation co-e cient was performed using COVID-19 data. There was a positive correlation
seen in number of active cases of COVID-19 and population density [where r(18) = 0.323)] (Table 3). [(See
appendix Figure SI 3(a)].
In Figure 3b the spatial distribution of serious cases has been showed. It can be observed that most
dense region (Campania) has only 4 serious cases as per June 3rd, 2020 out of total 350 serious cases.
The highest number of serious cases has been taken place in Lombardia 131 (37.42%) followed by Lazio,
Emilia-Romagna and Piemonte. Data presented in Table 3 shows the positive association between
serious coronavirus cases and population density [where r(18) = 0.340)]. [(See appendix Figure SI 3(b)].
Total 33,310 deaths have been reported o cially as of 3rd June, 2020. According to ministry of health, the
Lombardia region alone reported 16,172 deaths due to coronavirus which have a population density of
421 person/Sq.Km. Nearly 4147 (12.45%), 3898 (11.70%) and 1921 deaths have been reported in the
region of Emilia-Romagna, Piemonte, and Vento respectively. Following Table 3 clearly depicts the
relationship between total deaths caused by COVID-19 and population density [where r(18) = 0.292)].
[(See appendix Figure SI 3(c)].
Total 158,951 patients recovered from coronavirus infection in Italy as of 3rd June, 2020 which is 69% of
total con rmed coronavirus cases. Lombardia region has observed a spike in the number of recovered
patients from coronavirus. the region has alone 89442 people infected out of which 53046 recovered. The
Lombardia region has 60% recovery rate which is highest in Italy but is below the national average of 69
percent and also contribute 33 percent of the total recoveries nationwide. Piemonte, Emilia-Romagna, and
Vento infected 30734, 27842 and 19164 people respectively out of which 22150, 20856, and 15856
people recovered completely. Table 3 indicated a positive correlation between population density and
total recovered cases from coronavirus [where r(18) = 0.313)]. [(See appendix Figure SI 3(d)].
After Wuhan, China, the Italy was the next hotspot of infectious disease of coronavirus. The rst corona
positive case was detected in Italy on 31st of January,2020 when two Chinese tourist visited Rome [33]
and a week later an Italian man returned from china reported positive [34]. Later a cluster of positive
cases detected in the region of Lombardia [35, 36] and then in the rst half of March the virus spread all
over the country [37]. The COVID-19 infections disease caused major health burden and emergency
situation across the Italy. Total COVID-19 cases in Italy were 231,238 as of 3rd June, 2020. It can be
observed from Figure 5 below that Lombardia has the highest number of con rmed cases (89442) which
has kept the government on its toes due to sharp surge in the number of coronavirus cases. Piemonte,
Emilia-Romagna and Toscana followed Lombardia with 13.29% 12.04% and 4.38% cases respectively.
The huge number of COVID-19 cases was a threat to the citizen of Italy and its economy. A correlation is
Page 7/17found between number of COVID-19 cases and the population of various regions of Italy [where r(18) =
0.318)] (Table 3). To understand the correlation, a scatterplot is shown for better representation [(See
appendix Figure SI 3(e)].
Below in Figure 6, a dashboard has been made in individual capacity only for this study. Dashboard is the
collection of several views, letting you to compare the variety of the data at the same-time. It is best to
display a set of information on dashboard rather than navigating for the information separately. In this
dashboard one can see the number of active cases, serious cases, recovered cases, deaths and total
cases, along with an interactive map in the middle of dashboard. The regional level information is also
shown on left side in the dashboard. On the right hand side of the map, the national trend on coronavirus
can also be observed.
Table 3 Association between population density and COVID-19 variables using Pearson correlation
Variables Test Statistics (t) Degree of freedom (df) P value Correlation Co-e cient
Active Cases 2.929 18 0.009 0.323
Serious Cases 3.043 18 0.007 0.340
Total Deaths 2.727 18 0.014 0.292
Recovered Cases 2.867 18 0.010 0.313
Con rmed Cases 2.898 18 0.010 0.318
Discussion
The COVID-19 infection disease have triggered major health burden all over the country. As of 3rd June,
2020 total of 231, 238 cases have been report in Italy. It has found that Lombardia region has the highest
number of cases followed by Piemonte, Emilia-Romagna, and Vento. Basilicata has the lowest number of
cases but Lombardia has the highest rate of death for coronavirus disease. The mortality rate of
Lombardia is very high comparatively to nationwide. In Molise only 22 people lost their life; moreover,
Basilicata is another coronavirus ghter with total 399 cases and 27 deaths reported. Doctors and
paramedic staff is playing a very crucial role in COVID-19 pandemic by treating the infected cases. There
is a high recovery rate and a low death rate in Italy which indicates the better medical facilities with a
suitable doctor and patient ratio.
The human health being affected from COVID-19 but on the other hand lockdown affected the Italy’s
economy as multiple factories are closed due to the nationwide emergency situation. The
accommodation and food services were the hardest hit due to emergency situation and ban on tourism.
The economist predicted 7% GDP decline for the year of 2020 [38]. Northern Italy was hardest hit by
coronavirus but the economically deprived parts of southern Italy suffered the most from lockdown\n
[39].
Page 8/17Conclusion
This research work was carried out using geospatial technology to show the spatial distribution of
coronavirus disease in Italy. The objective of this research work was to evaluate the temporal change in
the rate of COVID-19 across the country by performing analysis from March to June 2020 (See Appendix).
It is worth to mention that the strict steps taken to control the spread of coronavirus disease, within this
twelve-week sampling data, the daily cases and daily deaths has been reduced from mid of April and
there is a spike in number of daily recovered cases (See Appendix).
This study was conducted for Italy on disease that have spread globally, thus the pattern of its spatial
distribution was studied using geospatial approach. Time series analysis was also conducted on the
pattern of daily con rmed cases, and deaths. The study revealed that the most populous region of Italy
(Lombardia) highly suffered from corona virus with 38% of total cases and 18% of total deaths (Table 2).
Analysis of spatial distribution pattern may offer valued information to support government monitoring
and the envisaging extent of the virus through small and large areas. Thus, in this study a GIS-based
spatial interpolation (IDW) approach was used to identify the prospective disease risk areas in Italy. The
IDW analysis of the spatial interpolation layers and the apparent weight of the conditioning factors were
also prepared.
The ndings of this study would be appropriate for the relevant departments to carry out the detailed
study on spread of corona virus and environmental control in the study area. Moreover, the approach
does not merely proscribe the foretell mapping of various zones of the country, but also allow the
demonstration of the level of improbability in the forecast that could be appropriate for other countries.
Recommendation For Covid-19
In view of the ndings related to the circumstances of dominance and spread of COVID-19, the following
suggestions have been protracted, which if employed, may go a long way in controlling the spread of the
highly contagious disease:
Execution of the guidelines of WHO and COVID-19 control programs at national level.
Formation of the COVID-19 research center must be taken up on an urgency basis.
The government should upsurge the budget for the health facilities.
Hospitals should be distributed according to population and vulnerability of areas.
Private clinics should refer the patients showing symptoms of infection to hospitals for complete
diagnosis.
Awareness among patients about the disease and its precautionary and curative processes must be
promoted.
Symptoms and cautionary methods about the disease should be ensured through signboards, print
and electronic media.
Page 9/17Improvement of quality of life is a principal factor among all factors, which is essential to be
enhanced by making proper reforms in the economy of the country.
Declarations
Data Availability. All data used in this manuscript are publicly available. COVID-19 epidemiological data
for Italy are available at https://github.com/pcm-dpc/COVID-19. Administrative boundaries area available
at http://www.diva-gis.org/gdata. Population census data are available at http://dati.istat.it/Index.aspx?
QueryId=18460. National level COVID-19 daily updated data is available at
https://ourworldindata.org/coronavirus
Funding. This research was a part of the project titled 'Jeju Sea Grant' funded by the Ministry of Oceans
and Fisheries, South Korea.
Con ict of interest. The authors declare no con ict of interest.
References
1. Wang, D., et al., Clinical characteristics of 138 hospitalized patients with 2019 novel coronavirus–
infected pneumonia in Wuhan, China. Jama, 2020. 323(11): p. 1061-1069.
2. Lu, H., C.W. Stratton, and Y.W. Tang, Outbreak of Pneumonia of Unknown Etiology in Wuhan China:
the Mystery and the Miracle. Journal of Medical Virology.
3. Huang, C., et al., Clinical features of patients infected with 2019 novel coronavirus in Wuhan, China.
The lancet, 2020. 395(10223): p. 497-506.
4. World Health, O., World Health Organization best practices for the naming of new human infectious
diseases. 2015, World Health Organization: Geneva.
5. Coronaviridae Study Group of the International Committee on Taxonomy of, V., The species Severe
acute respiratory syndrome-related coronavirus: classifying 2019-nCoV and naming it SARS-CoV-2.
Nature microbiology, 2020. 5(4): p. 536-544.
6. WHO. World Health Emergency Dashboard. 2020; Available from:
https://covid19.who.int/region/euro/country/it.
7. WHO. WHO Coronavirus Disease (COVID-19) Dashboard. 2020; Available from:
https://covid19.who.int/.
8. Lu, R., et al., Genomic characterisation and epidemiology of 2019 novel coronavirus: implications for
virus origins and receptor binding. The Lancet, 2020. 395(10224): p. 565-574.
9. Chan, J.F.-W., et al., A familial cluster of pneumonia associated with the 2019 novel coronavirus
indicating person-to-person transmission: a study of a family cluster. The Lancet, 2020. 395(10223):
p. 514-523.
10. Cascella, M., et al., Features, evaluation and treatment coronavirus (COVID-19), in Statpearls
[internet]. 2020, StatPearls Publishing.
Page 10/1711. Gao, G.F., From “A” IV to “Z” IKV: attacks from emerging and re-emerging pathogens. Cell, 2018.
172(6): p. 1157-1159.
12. Livingston, E. and K. Bucher, Coronavirus disease 2019 (COVID-19) in Italy. Jama, 2020. 323(14): p.
1335-1335.
13. Onder, G., G. Rezza, and S. Brusaferro, Case-fatality rate and characteristics of patients dying in
relation to COVID-19 in Italy. Jama, 2020. 323(18): p. 1775-1776.
14. Dowd, J.B., et al., Demographic science aids in understanding the spread and fatality rates of COVID-
19. Proceedings of the National Academy of Sciences, 2020. 117(18): p. 9696-9698.
15. of the International, C.S.G., The species Severe acute respiratory syndrome-related coronavirus:
classifying 2019-nCoV and naming it SARS-CoV-2. Nature Microbiology, 2020. 5(4): p. 536.
16. Wu, Z. and J.M. McGoogan, Characteristics of and important lessons from the coronavirus disease
2019 (COVID-19) outbreak in China: summary of a report of 72 314 cases from the Chinese Center
for Disease Control and Prevention. Jama, 2020. 323(13): p. 1239-1242.
17. Berlin, D.A., R.M. Gulick, and F.J. Martinez, Severe Covid-19. New England Journal of Medicine, 2020.
18. Marini, J.J. and L. Gattinoni, Management of COVID-19 respiratory distress. Jama, 2020.
19. Brochard, L., A. Slutsky, and A. Pesenti, Mechanical ventilation to minimize progression of lung injury
in acute respiratory failure. American journal of respiratory and critical care medicine, 2017. 195(4):
p. 438-442.
20. Gao, J., Z. Tian, and X. Yang, Breakthrough: Chloroquine phosphate has shown apparent e cacy in
treatment of COVID-19 associated pneumonia in clinical studies. BioScience Trends, 2020. advpub.
21. Biot, C., et al., Design and synthesis of hydroxyferroquine derivatives with antimalarial and antiviral
activities. Journal of medicinal chemistry, 2006. 49(9): p. 2845-2849.
22. Gautret, P., et al., Hydroxychloroquine and azithromycin as a treatment of COVID-19: results of an
open-label non-randomized clinical trial. International journal of antimicrobial agents, 2020: p.
105949.
23. Gatto, M., et al., Spread and dynamics of the COVID-19 epidemic in Italy: Effects of emergency
containment measures. Proceedings of the National Academy of Sciences, 2020. 117(19): p. 10484-
10491.
24. Center, C., Coronavirus COVID-19 Global Cases by the Center for Systems Science and Engineering
(CSSE) at Johns Hopkins University. 2020.
25. Bergquist, R. and L. Rinaldi, Health research based on geospatial tools: a timely approach in a
changing environment. Journal of helminthology, 2010. 84(1): p. 1-11.
26. Murugesan, B., et al., Distribution and Trend Analysis of COVID-19 in India: Geospatial Approach. J.
Geographical Studies, 2020. 4(1): p. 1-9.
27. ISTAT, Population Italian regions. 2019.
28. MOH, PCM-DPC data by Ministry of Health. 2020, Ministero della Salute.
29. Outbreak, Hi This is Outbreak. 2020.
Page 11/1730. ISS, Epidemia COVID-19. 2020, Istituto Superiore di Sanità: Italy.
31. Chen, F.-W. and C.-W. Liu, Estimation of the spatial rainfall distribution using inverse distance
weighting (IDW) in the middle of Taiwan. Paddy and Water Environment, 2012. 10(3): p. 209-222.
32. Bartier, P.M. and C.P. Keller, Multivariate interpolation to incorporate thematic surface data using
inverse distance weighting (IDW). Computers & Geosciences, 1996. 22(7): p. 795-799.
33. Severgnin, C., Coronavirus: Primi due casi in Italia, in Corriere della sera 2020: Italy.
34. Anzolin, E. and A. Amante, First Italian dies of coronavirus as outbreak ares in north, in Reuters.
2020, Thomson Reuters.
35. Ravizza, S., Coronavirus: rst cases in Milan. What do we know about the new infections in
Lombardy, Veneto and Piedmont, in Corriere della Sera. 2020: Italy.
36. Elisa Anzolin, A.A., Coronavirus outbreak grows in northern Italy, 16 cases reported in one day, in
Reuters. 2020, Thomson Reuters: Italy.
37. Editorial, I., Coronavirus. Hit all regions. Civil Protection: here are the updated numbers, in Avvenire.
2020: Italy.
38. Ma a primed to feast on Italy's virus devastation in France 24. 2020: Rome, Italy.
39. Nadeau, B.L. and V.D. Donato, As northern Italy is ravaged by coronavirus, there's trouble brewing
down south, in CNN. 2020.
Figures
Page 12/17Figure 1
Study area and population density/Sq.km
Page 13/17Figure 2
Statistics of COVID-19 in Italy (3rd June, 2020)
Page 14/17Figure 3
Spatial distribution of Coronavirus in Italy (a) Active cases (b) Serious cases
Figure 4
Spatial distribution of coronavirus in Italy (a) Total deaths (b) Total recovered
Page 15/17Figure 5
Spatial distribution of total Coronavirus cases in Italy
Page 16/17Figure 6
Dashboard for Novel Coronavirus (COVID-19) Situation in Italy Accessible Link: Novel Coronavirus
(COVID-19) Situation in Italy
Supplementary Files
This is a list of supplementary les associated with this preprint. Click to download.
Cases.mp4
Active.mp4
Serious.mp4
Recover.mp4
Death.mp4
AppendixItalyCOVID19.docx
Page 17/17You can also read