South Africa telecoms market report 2020 - Analysys Mason
←
→
Page content transcription
If your browser does not render page correctly, please read the page content below

South Africa telecoms market report 2020

                                           South Africa telecoms
                                            market report 2020

                                                                         Terry van Staden

                                                                              March 2020
                                           Figures updated in April 2020 with data to 4Q 2019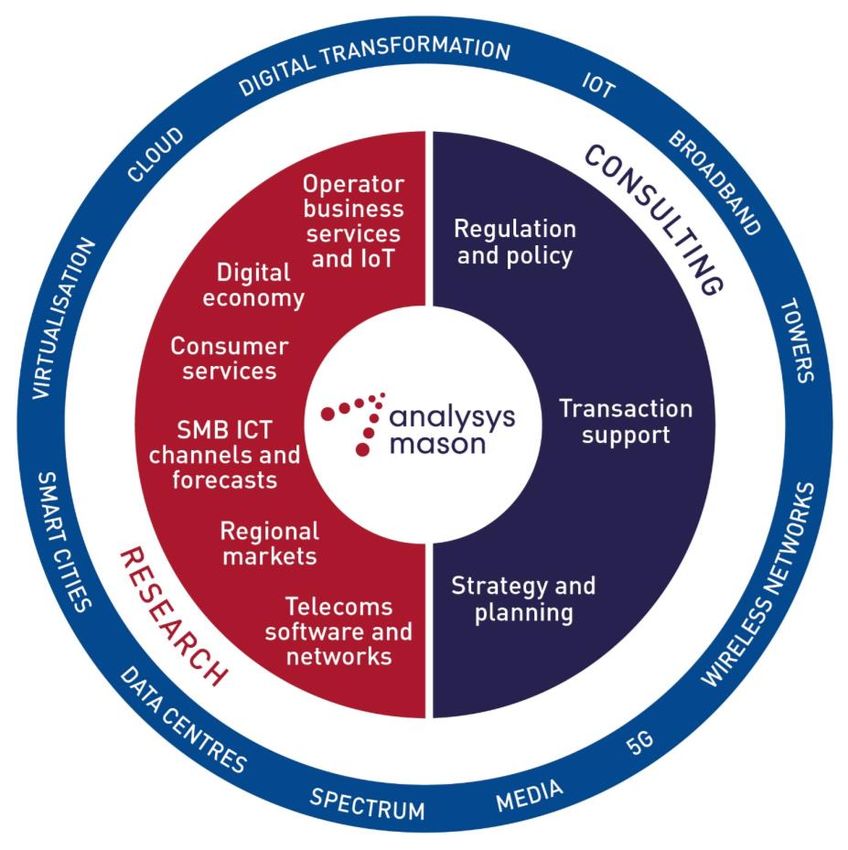
South Africa telecoms market report 2020                                                2

               Contents                    Market overview

                                           Operator profiles and market shares

                                           Infrastructure status and plans

                                           Regulatory information

                                           Recent and forthcoming market developments

                                           About the author and Analysys Mason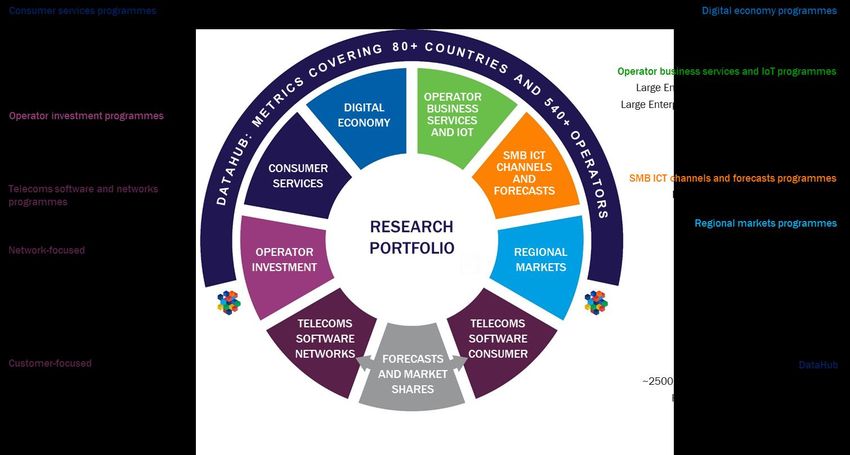
South Africa telecoms market report 2020                                                                                                                                         3

Market overview: introduction to market

South Africa is the largest market in Sub-Saharan Africa in                                       Figure 1: Telecoms KPIs, South Africa (USD)
terms of revenue, with high mobile penetration and
comparatively low usage of fixed services.
                                                                                                                             Mobile 4Q 2019
The total telecoms market generated ZAR149 billion
(USD8.5 billion) in service revenue in 2018, almost 80% of which
is from mobile. The market is dominated by incumbent operators
                                                                                                                                                                  $
Telkom (fixed) and Vodacom, followed closely by MTN (both                                              99.7M            25.9%              169%                7.12
mobile). South Africa has a rapidly expanding wholesale market                                           Mobile       4G % of mobile        Mobile
                                                                                                                                                             Mobile ARPU
                                                                                                      connections1     connections        penetration
for fibre services driven by small, local players.
Economic instability and fresh mobile regulations will continue                                                               Fixed 4Q 2019
to impact the market outlook.
South Africa’s economy has been consistently weakened by                                                                                                          $
political instability, driving inflation and creating pressure on
consumer spending. We expect the limited economic growth to
                                                                                                       2.52M            12.1%                 0                49.0
                                                                                                       Fixed voice    Fixed broadband                      Fixed broadband
hinder the growth in the telecoms sector to a certain extent,                                          connections       penetration
                                                                                                                                        IPTV subscribers
                                                                                                                                                                 ASPU
further exacerbated by new EUSSC1 regulation implemented in
1Q 2019 (see market development section for further details).
                                                                                                                      Revenue, year ended 4Q 2019
The rollout of high-speed fixed broadband services increased to
meet the strong demand from consumers and businesses.
                                                                                                             $               $                                      $
The adoption of high-speed fixed broadband services has been                                            8.24B           2.16B             2.95%                14.9
strong since 3Q 2016. The growth in retail broadband                                                 Mobile service    Fixed service    Service revenue    Service revenue per
subscriptions is driven by regulation supporting the open access                                       revenue            revenue        as % of GDP        capita per month
to fixed infrastructure and government support.
1   End user and subscriber service charter
2   Except where stated, all mobile connection metrics in this report exclude machine-to-machine (M2M) connections.
South Africa telecoms market report 2020                                                                                                                  4

Market overview: key market trends for South Africa

Figure 2: Total telecoms service revenue (ZAR billion)                               Figure 4: Telecoms service revenue per capita per month (ZAR)

                                                                                                                                                  219.8
                                                                                                      215.7   216.0                    216.5
                                                                                                                      213.2
                       7.9        7.9       7.9     7.9        7.8         7.7                                                209.6
  8.0       8.0
                                                                                              204.1
                                                                                      200.9
 26.7       27.4      29.5       29.7      29.3     28.9      30.3         31.1

1Q 2018 2Q 2018 3Q 2018 4Q 2018 1Q 2019 2Q 2019 3Q 2019 4Q 2019                      1Q 2018 2Q 2018 3Q 2018 4Q 2018 1Q 2019 2Q 2019 3Q 2019 4Q 2019

          Total mobile service revenue       Total fixed service revenue
                                                            Source: Analysys Mason                                                    Source: Analysys Mason

Figure 3: Total service revenue as a percentage of GDP                               Figure 5: Mobile as a percentage of total service revenue

                      3.06%                                                                                                                       80.1%
                                3.04%                                                                                                  79.6%
                                                                                                      78.8%   78.9%   78.7%   78.6%
                                           2.97%                        2.98%
                                                             2.96%
           2.92%                                                                              77.5%
 2.89%                                             2.89%                              77.0%

1Q 2018 2Q 2018 3Q 2018 4Q 2018 1Q 2019 2Q 2019 3Q 2019 4Q 2019                      1Q 2018 2Q 2018 3Q 2018 4Q 2018 1Q 2019 2Q 2019 3Q 2019 4Q 2019

                                                            Source: Analysys Mason                                                    Source: Analysys Mason
South Africa telecoms market report 2020                                                                                                                         5

  Market overview: mobile market trends for South Africa

  Figure 6: Mobile connections by device type (million)                                    Figure 8: 4G and contract share of mobile connections

                        102.1      105.9       105.7    106.0      106.1     106.8
   96.9      100.4
                                                                                                                                                                25.9%
                                                                                                                                                                22.6%
                                                                                         20.6%
                                                                                         15.4%

 1Q 2018 2Q 2018 3Q 2018 4Q 2018 1Q 2019 2Q 2019 3Q 2019 4Q 2019                          1Q 2018 2Q 2018 3Q 2018 4Q 2018 1Q 2019 2Q 2019 3Q 2019 4Q 2019

        Smartphones        Basic phones         Mobile broadband      Mobile IoT                                     4G      Contract
                                                                Source: Analysys Mason                                                         Source: Analysys Mason

  Figure 7: Mobile ARPU by type (ZAR per month)                                            Figure 9: Cellular data traffic per connection (GB per month)

                                                                                                                                                            1.16
                                                                                 216.6                                                           1.08
205.1                                                                                                                                   1.01
                                                                                                                    0.88    0.93
                                                                                                            0.85
                                                                                                    0.78
                                                                                            0.71

97.5                                                                             104.1
76.8                                                                              81.1

 1Q 2018 2Q 2018 3Q 2018 4Q 2018 1Q 2019 2Q 2019 3Q 2019 4Q 2019                           1Q 2018 2Q 2018 3Q 2018 4Q 2018 1Q 2019 2Q 2019 3Q 2019 4Q 2019

                         Blended             Prepaid      Contract
                                                                Source: Analysys Mason                                                         Source: Analysys Mason
South Africa telecoms market report 2020                                                                                                6

Market overview: mobile market

Subscriber growth remains strong, despite high levels of             5G will likely be launched by most operators with suitable
penetration.                                                         spectrum expected to be assigned in 2020.
Mobile connections (excluding IoT) increased by 7% between           ICASA (finally) published an information memorandum detailing
3Q 2018 and 3Q 2019 to 102 million, indicating continued,            the options for auctioning off spectrum for 4G and 5G services
steady, growth in the mobile market. This is despite the existing    that has continually been delayed for over a decade.
high levels of penetration. However, we expect this growth to
                                                                     Telkom is currently the only mobile operator with suitable 5G
stabilise going forward. Penetration in 3Q 2019 is at 174% and
                                                                     spectrum in the 3500MHz band but has not launched
sustained growth in connections is unlikely. Further growth in
                                                                     commercial services as of March 2020. Liquid Telekom also has
mobile connections will be mostly driven by IoT.
                                                                     suitable spectrum in the same band and plans to launch a
Revenue growth is expected to remain relatively low, as the          wholesale network in 2020. Most other operators expect to
increase in mobile connections is offset by a declining ARPU,        launch 5G as they acquire spectrum sometime in 2020 (please
partly driven by regulation.                                         see the market developments section for more details).
Mobile revenue has been largely stable since 2017 and we expect      Mobile broadband services are still popular outside the
this trend to continue, despite the increasing mobile connections.   affluent areas.
Data prices have historically been unsustainably high in South
                                                                     Mobile broadband represented 8% of mobile connections in
Africa, and we expect ASPUs to decline.
                                                                     3Q 2019. The relatively poor fixed services across most of South
Revenue will come under further pressure by the new End-User         Africa has led to the widespread use of mobile broadband.
and Subscriber Service Charter (EUSSC) which came into effect in
                                                                     South Africa has a relatively developed M2M market for the
March 2019. The amendments to the charter end the automatic
                                                                     Sub-Saharan Africa region.
rollover to per-megabyte charges when data bundles are
exceeded. Users now have to opt in to accept such charges and        We estimate the number of M2M connections to have reached
can set limits on spend. Unused data bundles can also be rolled      6.8 million by 3Q 2019, up from 5.6 million in 3Q 2018. Vodacom
over to the new period, which will impact operator revenue (see      is the primary pioneer behind M2M services in South Africa,
the market developments section for more details).                   accounting for roughly two-thirds of connections.
South Africa telecoms market report 2020 7
Market overview: fixed market trends for South Africa
Figure 10: Household penetration by service Figure 12: Fixed broadband connections by technology (million)
1.92 1.96 2.00
1.80 1.84 1.88
20.3% 1.68 1.75
15.2%
12.1%
10.5%
1Q 2018 2Q 2018 3Q 2018 4Q 2018 1Q 2019 2Q 2019 3Q 2019 4Q 2019 1Q 2018 2Q 2018 3Q 2018 4Q 2018 1Q 2019 2Q 2019 3Q 2019 4Q 2019
Fixed voice Fixed broadband DSL Cable modem FTTP/B BFWA Other
Source: Analysys Mason Source: Analysys Mason
Figure 11: Fixed retail revenue by service (ZAR billion) Figure 13: Fixed ASPU by service (ZAR per month)
7.71 7.73 7.76 7.75 7.74 7.69 7.63 739.9 717.3
7.58
282.9 252.5
1Q 2018 2Q 2018 3Q 2018 4Q 2018 1Q 2019 2Q 2019 3Q 2019 4Q 2019 1Q 2018 2Q 2018 3Q 2018 4Q 2018 1Q 2019 2Q 2019 3Q 2019 4Q 2019
Voice Broadband access Specialist business services Voice Broadband
Source: Analysys Mason Source: Analysys MasonSouth Africa telecoms market report 2020 8
Market overview: fixed market
The fixed market in South Africa has been flat with declines in South Africa has a rich wholesale market, supported by
voice offsetting the growth in broadband. Openserve and numerous small ISPs investing in sporadic fibre
coverage across major cities.
Fixed voice revenue has been in consistent decline, heavily
impacting the value of the market. Most of this decline falls on South Africa has a diverse and highly fragmented fixed market.
the incumbent, Telkom. The country hosts at least thirty different alternative fixed network
operators circumventing Openserve’s wholesale network which
VoIP connections continue to be a popular substitute for PSTN,
accounts for the majority of connections.
increasing by over 100 000 to 550 000 between 3Q 2017 and
3Q 2019, and representing 20% of fixed voice lines. VoIP Openserve (Telkom’s wholesale division), alternative operators
connections are typically cheaper than PSTN, contributing to the and a collection of resellers partner with each other to create a
reduction of overall spend. vibrant wholesale market.
The fixed broadband market has robust and persistent growth, We expect 5G to drive significant growth in fixed-wireless
albeit from relatively low penetration. Broadband revenue access (FWA) connections.
increased by 12% between 9M 2018 and 9M 2019, reaching
Relatively poor fixed network coverage across most of the country
ZAR12.8 billion in the latter 9M period.
and even major cities leaves FWA as a tangible alternative to DSL
Fibre accounts for the bulk of this growth. There were an or fibre. Almost all fixed operators offer FWA solutions.
estimated 600 000 fibre subscribers at the end of 3Q 2019 out
FWA represents only 5% of fixed broadband connections as of
of a total of 2 million fixed broadband connections, up from
3Q 2019. However, we expect this may increase to as much as
250 000 in 3Q 2017. Deployment of fibre is still concentrated in
18% by 2024 as 5G drives a resurgence in its popularity and
affluent suburbs and business areas.
viability as a fixed alternative.
The total value of the fixed market has increased little since 2007.
Rain has already launched commercial 5G FWA services and we
The market totalled ZAR32 billion in 2018 and we expect this to
expect other operators to follow including MTN, MWEB, Telkom
grow only slightly at 2.4% each year to 2024.
and Vodacom.South Africa telecoms market report 2020 9
Contents Market overview
Operator profiles and market shares
Infrastructure status and plans
Regulatory information
Recent and forthcoming market developments
About the author and Analysys MasonSouth Africa telecoms market report 2020 10
Operator profiles: products and services in South Africa
Figure 14: Operators’ products and services
Operator Mobile Fixed broadband Fixed voice Pay TV
Telkom Yes Yes –DSL, fixed LTE, fibre Yes – PSTN, WLL Yes
Vodacom Yes Yes – Fibre, fixed LTE No Yes
MTN Yes Yes – Fibre, fixed LTE No Yes
Cell C Yes Yes – Fibre, fixed LTE No Yes
Planned wholesale 4G and 5G Yes – fibre, fixed LTE and
Neotel Liquid Telecom Yes – WLL No
services in 2020 planned 5G FWA in 2020
Afrihost No Yes – DSL, fibre, fixed LTE No No
Rain No Yes –fibre, fixed LTE, 5G FWA No No
MWEB No Yes – DSL, fibre, fixed LTE No Yes
Vox Telecom No Yes – DSL, fibre, fixed LTE No No
Web Africa No Yes – DSL, fibre, fixed LTE No NoSouth Africa telecoms market report 2020 11
Operator profiles: key mobile market trends for South Africa
Figure 15: Mobile ARPU (ZAR per month) Figure 16: Market share of mobile Figure 17: Contract share of mobile
subscribers subscribers
5.7%
14.1% 12.5%
28.4%
125.8
16.5%
116.5
102.4
100.6 100.0 21.1%
94.5 99.2
92.4
32.5%
19.0%
29.0%
18.4% 17.9%
16.4%
13.7%
45.4% 12.9%
44.5%
1Q 2018
2Q 2018
3Q 2018
4Q 2018
1Q 2019
2Q 2019
3Q 2019
4Q 2019
2Q 2018
1Q 2018
1Q 2018
3Q 2018
4Q 2018
1Q 2019
2Q 2019
3Q 2019
4Q 2019
2Q 2018
3Q 2018
4Q 2018
1Q 2019
2Q 2019
3Q 2019
4Q 2019
Source: Analysys Mason Source: Analysys Mason Source: Analysys Mason
Vodacom MTN Cell C TelkomSouth Africa telecoms market report 2020 12
Operator profiles: key fixed market trends for South Africa
Figure 18: Market share of fixed broadband subscribers Figure 19: Fixed broadband ASPU (ZAR per month)
4.9%
14.4%
13.7% 1077
1004
979
7.2% 14.5%
912
881
11.3% 7.6% 821
783
7.4% 730
22.4%
597
22.4% 557
489
456
40.5%
33.7%
2Q 2019
1Q 2018
2Q 2018
3Q 2018
4Q 2018
1Q 2019
3Q 2019
4Q 2019
1Q 2018
2Q 2018
3Q 2018
4Q 2018
1Q 2019
2Q 2019
3Q 2019
4Q 2019
Source: Analysys Mason Source: Analysys Mason
Telkom MWEB Neotel Liquid Telecom Rain Vox Telecom othersSouth Africa telecoms market report 2020 13
Operator profiles: Vodacom
Vodacom, the mobile incumbent, is the leading mobile operator Figure 20: Vodacom market share of subscribers by service, 4Q
in the market with a stable market share. 2019
Vodacom launched mobile services in 1994 and was the first to
introduce LTE in October 2012. It launched fibre services in
Mobile 44.5%
September 2014, initially for businesses and then the residential
segment in early 2015.
The operator is 60% owned by UK based Vodafone Group, with a
15% stake held by the South African government’s Public
Investment Corporation. The remaining stake is floated on the Fixed broadband
local stock exchange. After two years of regulatory process,
Vodacom called off its ZAR7 billion bid to acquire fixed-line
operator Neotel in 2016 after the Competition Tribunal deemed Source: Analysys Mason
the deal to be anti-competitive.
Vodacom is increasing the availability of digital services and
Vodacom maintains its pole position but faces growing fibre.
competitive and regulatory pressure.
In 2014, Vodacom started rolling out its fibre networks in
Vodacom’s share of connections declined by 2.5% between business parks and selected gated communities. As of mid-2019,
3Q 2018 and 3Q 2019 to 42.9%, as Telkom claims market share. it has grown its fibre footprint to over 80 000 premises and also
Nevertheless, Vodacom added almost 4 million subscribers over partners with around 10 alternative network operators.
two years, reaching nearly 44 million in 3Q 2019.
It has also invested in digital services such as content. In 2018, it
Regulatory pressure has forced Vodacom to lower its data prices. revamped its “Video Play” OTT video platform, offering time-based
Average price per MB decreased by 37% and out of bundle data subscriptions to view movies, series, kids shows and music
rates decreased by 50% in its 2019 financial year. videos. This service has 870 000 users as of March 2019.South Africa telecoms market report 2020 14
Operator profiles: MTN
MTN is the second-largest mobile operator by subscribers. Figure 21: MTN market share of subscribers by service1, 4Q
2019
MTN launched mobile services in 1994 and it was the second
operator to commercialise LTE in December 2012. It is also
actively expanding into the fixed broadband market.
Mobile 29.0%
MTN South Africa is 100% owned by MTN holdings which is in turn
100% controlled by MTN Group. The government’s Public
Investment Corporation is the majority stakeholder in MTN Group
with a 16.3% stake. Remaining shares are held by a diverse
grouping of mutual funds and institutional investors. Fixed broadband
MTN’s market share has been in consistent decline since
2012. Source: Analysys Mason
Its market share peaked in 2012 with over 41% of subscribers. It
MTN is expanding its fibre reach under new management and a
has since been a downward trend, dropping by 5.5 percentage
new brand, Supersonic.
points between 3Q 2017 and 3Q 2019; a net loss of almost
2 million customers. Telkom’s successful expansion into mobile MTN launched its fibre services in 2014 which it then expanded
services with relatively cheap prepaid offerings has been the with the acquisition of Smart Village in 2015 (finalised in
primary reason for this decline. December 2016). It also partners with numerous alternative fibre
providers (such as Frogfoot and Vumatel) to extend its network.
MTN claimed the first 5G trial in South Africa in January 2018.
In 2018 it launched its new fibre division under the Supersonic
In partnership with Ericsson, MTN reported reaching speeds of
brand. Supersonic differentiates by offering guaranteed call back
20Gbps in its 5G trial, claiming this to be the first such trial in the
rates of 30 minutes or signing up via a “simple five-step” process
country. MTN expects to launch commercial 5G services in 2020.
on its website. It covers around 80 suburbs across major cities
and has a target to cover 2.2 million premises by 2022.
1 MTN’s share of fixed broadband connections is relatively small and it has been aggregated into the “others” category as a result.South Africa telecoms market report 2020 15
Operator profiles: Cell C
Cell C is the third mobile operator in terms of subscribers, but it Figure 22: Cell C market share of subscribers by service, 4Q
is struggling financially and looking to sell some (or even all) of 2019
its business to manage its debt.
Cell C entered the market in 2001 initially targeting the youth
Mobile 14.1%
segment and low-end of the market. Cell C was the last operator
to launch LTE in December 2015, followed by LTE-A in March
2017. It also provides fibre services through a network of around
10 partners, but the number of connections is relatively small.
Cell C is reportedly in talks to sell migrate its postpaid subscribers Fixed broadband
to Vodacom. It previously rejected a takeover offer from Telkom in
2019 following its new roaming deal with MTN, and is looking at
means of generating some cash to consolidate its business. Talks Source: Analysys Mason
are still in early stages.
Cell C considers itself to be a pioneer in digital services, but it
Blue Label Telecoms holds 45% of Cell C; 3C Telecommunications has shut down its streaming service.
holds 30% while Net1 UEPS Technologies owns 15% of the
company. The remaining 10% are held by Cell C management and Unlike its competitors, Cell C has embraced over-the-top (OTT)
staff. players and has partnered with the likes of Facebook and
WhatsApp to offer social bundles, providing cheap access to
Cell C’s steady increase in connections has resulted in these applications.
moderate revenue growth and stable market share.
It launched its streaming platform, Black, in 2017 which was
Cell C has been consistently growing at the same pace of the aimed at competing with pay-TV operators like MultiChoice,
market, generating a stable market share of just over 17% of Showmax and Netflix. It invested over ZAR1 billion on content for
subscribers since 2Q 2016. Its number of subscribers increase by the platform over two years, but the market is incredibly
1.8 million to almost 18 million between 3Q 2017 and 3Q 2019. competitive and it effectively shut down the service in December
2019 following a low-profit outlook.South Africa telecoms market report 2020 16
Operator profiles: Telkom
Telkom is South Africa’s incumbent and largest integrated Figure 23: Telkom market share of subscribers by service, 4Q
operator, with a declining share in the fixed market and rising 2019
share in mobile.
Telkom offers retail fixed and mobile services. The mobile
Mobile 12.5%
business arm was created in 2010 and came to the market as the
fourth mobile player. The operator launched LTE in November
2012.
Telkom acts also as a wholesale fixed broadband provider through
its subsidiary Openserve. In February 2017, Telkom and Business Fixed broadband 33.7%
Connexion launched BCX as an integrated end-to-end ICT solution
provider for businesses.
Source: Analysys Mason
The operator is owned by the South African Government with a
39.7% stake, 11.6% by Public Investment Corporation (PIC) and Telkom is the dominant fixed broadband provider but it has
the remaining 48.7% is free float. been losing market share against strong competition.
Telkom is increasing its share of the mobile market at a Its connection numbers peaked in 3Q 2018 at 690 000 but has
considerable pace. since been declining. Telkom’s share of broadband subscribers
dropped from 39.0% in 3Q 2017 to 33% in 3Q 2019.
After its launch in 2010, Telkom slowly increased its market
share, reaching 4.8% after seven years of operation by 3Q 2017. Telkom faces growing competition from a range of smaller fixed
However, its share has since been rising at a remarkable pace, and FWA providers, and the two major mobile operators who are
increasing to 11.3% in 3Q 2019. This represents an increase of expanding their presence. The establishment of Openserve in
over seven million subscribers over the 2 year period to 2015 which offers wholesale access to Telkom’s network on an
11.5 million connections. Telkom’s success is mostly due to its equal basis effectively removes its dominant hold on the market
launch of relatively cheap data bundles in the prepaid segment. and enhances competitors’ ability to compete against Telkom.South Africa telecoms market report 2020 17
Operator profiles: MWEB
MWEB is the second largest fixed broadband operator with a Figure 24: MWEB market share of subscribers by service, 4Q
stable market share. 2019
MWEB uses a range of technologies including DSL, fibre and LTE
to offer broadband services for residential and business
Mobile
customers.
MWEB was a wholly-owned subsidiary of MultiChoice South Africa
Holdings until it was acquired by Internet Solutions (in turn owned
by Dimension Data) in May 2017. MWEB is now the consumer arm
of Internet Solutions which operates under several brands, Fixed broadband 22.4%
including Ignite for SMEs and the IS brand for large enterprises.
MWEB focuses on DSL and fibre after an initial foray into Source: Analysys Mason
WiMAX.
MWEB is growing with a steady increase in connections and
It initially launched WiMAX in 2010 before shutting it down 2
constant share of subscribers.
years later because its provisional licence was not upgraded to a
fully operational one. It turned its focus to DSL, trying to MWEB had been reporting a consistent increase in market share
differentiate on network quality-of-service (QoS). MWEB between 2013 and 2017, where it has since remained stable at
introduced VDSL in 2013. 22% of connections.
It currently offers a range of uncapped xDSL tariffs starting at Its fixed broadband subscribers increased by over 100 000
2Mbps to 40Mbps. Since November 2014, it has worked with between 3Q 2017 and 3Q 2019 reaching 450 000; a 30%
fibre infrastructure providers such as Vumatel and Openserve increase over the two year period which is approximately the
enabling it to launch fibre services with a speed ranging from same rate of growth in the overall market.
2Mbps to 200Mbps. It partners with around eight fibre
infrastructure providers to increase its footprint.South Africa telecoms market report 2020 18
Operator profiles: Vox Telecom
Vox Telecom is the third-largest fixed broadband provider in Figure 25: Vox Telecom market share of subscribers by service,
South Africa with considerable ambition in fibre networks. 4Q 2019
Vox Telecom offers DSL services over Telkom's network and
provides fibre services using open access from infrastructure
Mobile
providers such as Vumatel.
Following the acquisition of ISP Frogfoot Networks in July 2015,
Vox revealed plans to build a national fibre network in non-
metropolitan areas, especially in the eastern part of the country.
Fixed broadband 14.5%
The company is privately-owned.
Vox Telecom is increasing its subscriber base at a considerable
Source: Analysys Mason
pace.
Vox has seen significant subscriber growth, rising from 190 000 Vox Telecom is also building its capabilities in business ICT
in 3Q 2017 to 290 000 in 3Q 2019; over a 50% increase in two services.
years.
Vox offers unified communications, hosting, back-up, IoT, firewalls
Vox effectively leverages a combination of its own network, and a range of SaaS (including ERP, CRM and Office365) to
wholesale providers and a large reselling network to drive its businesses.
coverage and the take-up of subscribers. Its market share has
It also has a small professional services division that offers
been increasing slightly, rising from 12.4% in 3Q 2017 to 14.5% in
managed IT support and advisory to support its ICT portfolio.
3Q 2019.South Africa telecoms market report 2020 19
Operator profiles: Neotel Liquid Telecom
Neotel Liquid Telecom has been gradually pulling out of the Figure 26: Neotel Liquid Telecom market share of subscribers
consumer market to focus on business and wholesale by service, 4Q 2019
customers.
Neotel started life as an ISP that relied on Telkom to provide
Mobile
services. It rolled out its own infrastructure in March 2008 after
acquiring another ISP, Transtel. Around the same time, it launched
a fixed wireless service in addition to fixed voice.
In mid-2016, Liquid Telecom (which is owned by Econet Wireless)
agreed to acquire a controlling stake in Neotel from major Fixed broadband 7.4%
shareholder Tata Communications and Nexus Connexion-led
minority shareholders for ZAR6.6 billion. The acquisition was
finalised in February 2017. Source: Analysys Mason
Neotel is focusing on fibre services to businesses. Neotel Liquid Telecom is currently one of three operators with
suitable 5G spectrum and plans to launch a wholesale network
It terminated its legacy CDMA2000 and WiMAX-based fixed
in 2020.
wireless services and closed its call centre for consumers in 2019
as its refocuses efforts on businesses and wholesale customers. Neotel has 56MHz of spectrum in the 3.5GHz band and plans to
roll the network out and lease it to other operators in 2020 for 5G
Neotel introduced fibre services in September 2014 to attract
services. It has already inked an agreement with Vodacom.
businesses in selected locations of Johannesburg, Pretoria, Cape
Town, Bloemfontein and Durban. It has been gradually losing Neotel Liquid Telecom also plans to roll out an open-access 4G
market share as it shifts its focus to the business segment, 1800MHz network of which MTN is the first confirmed customer.
declining from 12.4% in 3Q 2017 to 7.8% in 3Q 2019.South Africa telecoms market report 2020 20
Operator profiles: Rain Operator profiles: other operators
Figure 27: Rain market share of subscribers by service, 4Q Figure 28: other operators market share of subscribers by
2019 service, 4Q 2019
Mobile Mobile
Fixed broadband 7.6% Fixed broadband 14.4%
Source: Analysys Mason Source: Analysys Mason
Rain is behind the resurgence in FWA connections. South Africa has a buoyant fixed broadband market with many
alternative fibre and FWA providers.
Rain, formerly iBurst and Wireless Business Solutions (WBS), was
rebranded to pursue its FWA push. Fibre networks have been deployed in major cities through a
variety of alternative network operators. Open access to Telkom’s
In September 2019 it launched what it claimed to be the
subsidiary, Openserve, has also allowed smaller providers to use
country’s first commercial 5G launch, offering fixed-wireless
FWA to provide broadband services on a last-mile basis.
connections to consumers and SMEs across major cities. It has
two speed-tiered 5G offers: 30Mbit/s and 200Mbit/s. The alternative providers include a mixture of resellers and
network operators. The major alternative network operators
Rain has also agreed to sell its subsidiary, Broadlink which
include Frogfoot (Vox), Vumatel, Link Africa, Dark Fibre Africa and
focused on businesses, to CipherWave. The transaction is
Octotel.
pending regulatory approval but expected to close by mid-2020.South Africa telecoms market report 2020 21
Contents Market overview
Operator profiles and market shares
Infrastructure status and plans
Regulatory information
Recent and forthcoming market developments
About the author and Analysys MasonSouth Africa telecoms market report 2020 22
Operators’ mobile infrastructure status in South Africa [1/2]
Figure 29: Operators’ mobile infrastructure status
Technology generations New technology launch
Operator Coverage Commentary
and frequencies deployed dates
2G 900/1800MHz ▪ Vodacom announced a five year ZAR50 billion (USD3.7
billion) investment plan for its mobile network in late 2018.
▪ HSPA+: May 2010 ▪ 3G: 99.8% of the population Much of this is aimed at 5G.
LTE: 92.4% of population at
Vodacom 3G 2100MHz ▪ LTE : October 2012 3Q 2019 ▪ The operator has re-farmed its 1800MHz spectrum for LTE
▪ LTE-A: 2016 services. It also roams off Rain’s 4G network.
▪ LTE-A: major cities
▪ Vodacom expects to launch 5G in 2020, following a
4G 1800MHz roaming agreement with Liquid Telecom.
▪ MTN invested ZAR30 billion (USD2.2 billion) in its network
2G 900/1800MHz between 2015 and 2018 to increase LTE coverage. It now
▪ 2G: 99.5% of the population
claims to have the largest 4G network in the country.
▪ 3G: 98% of the population
▪ LTE: December 2012 ▪ The operator has re-farmed its 1800MHz spectrum for LTE
MTN 3G 2100MHz ▪ LTE: 95% of the population
▪ LTE-A: March 2016 services and has signed a deal with Liquid Telecom to roam
as of 3Q 2019 over its 4G network when released.
▪ LTE-A: major cities ▪ MTN expects to launch 5G services in 2020, but is awaiting
4G 1800MHz
spectrum release by the regulator.
2G 900/1800MHz
▪ 3G: 98% via roaming
agreement with MTN ▪ Cell C has re-farmed 10MHz of its 2100MHz spectrum to
▪ LTE: September 2015 roll out LTE.
Cell C 3G 2100MHz ▪ LTE: 95% via roaming
▪ LTE-A: October 2015 agreement with MTN ▪ Offers 3G and 4G services via a new roaming agreement
with MTN signed in November 2019.
▪ LTE-A: major cities
4G 2100MHzSouth Africa telecoms market report 2020 23
Operators’ mobile infrastructure status in South Africa [2/2]
Figure 30: Operators’ mobile infrastructure status
Technology generations New technology launch
Operator Coverage Commentary
and frequencies deployed dates
▪ 2G: 99% via agreement with ▪ Telkom plans to switch off its 2G network in 2020.
2G 1800MHz
Vodacom ▪ Telkom inked a roaming agreement with Vodacom in
▪ HSPA+: June 2011 November 2018 for 2G/3G services against the impending
▪ 3G: 99% via agreement with
▪ TD-LTE: November Vodacom expiration of its previous deal with MTN.
Telkom 3G 2100MHz
2012 ▪ Telkom expects to launch 5G in 2020, but is awaiting
▪ LTE: Around 2000 sites as
▪ LTE-A : October 2014 of 2Q 2018 spectrum release from the regulator. Telkom already owns
4G 2300MHz some 3500MHz spectrum, but reports it is far from enough
▪ LTE-A: major cities for 5G services.
3G N/A
▪ Liquid Telecom plans to rollout its 5G 3500MHz network in
2020 for wholesale use.
Liquid ▪ Planned for major cities in
4G 1800MHz ▪ Planned for 2020 ▪ It also plans to roll out a nationwide 1800MHz 4G network
Telecom 2020.
for wholesale use. In March 2019, MTN signed a 4G
roaming deal with Liquid Telecom.
5G 3500MHz
3G N/A
▪ LTE-A: June 2017 ▪ LTE-A: Major cities ▪ Rain’s mobile networks are primarily use for wholesale
Rain 4G 1800/2600MHz
▪ 5G: September 2019 ▪ 5G: Major cities purposes and FWA services (see next slide).
5G 3600MHzSouth Africa telecoms market report 2020 24
Operators’ fixed access infrastructure plans in South Africa
Figure 31: Operators’ fixed access infrastructure plans
Access infrastructure
Operator Roll-out target Progress: coverage and take-up
plans announced
▪ Coverage in selected areas over the infrastructure of Century City Connect,
MWEB FTTP/B No data available. Frogfoot Networks, Mitsol, Octotel, Openserve and Vumatel.
▪ MWEB’s own FTTP/B roll-out is focused in Gauteng and Western Cape province.
▪ Fibre passed over 2.8 million premises by 1Q 2019, most of which is FTTC.
OpenServe
▪ 163 800km of fibre deployed as of 1Q 2019.
(Telkom’s FTTP/B No data available.
wholesale provider) ▪ All operators have access to Openserve’s DSL and fibre networks on an equal
basis.
Vodacom FTTP/B No data available. ▪ Reported 81 000 premises passed as of 4Q 2019.
▪ The deployment of the open-access network in partnership with Vumatel started
Targets 400 000 premises in Richards Bay with 50 suburbs covered by the end of 2018.
Vox Telecom FTTP/B passed within in several years as ▪ Acquired the fibre ISP Frogfoot Networks in July 2015 to boost its fibre footprint.
of 1Q 2020. ▪ In April 2017, it announced an investment plan worth ZAR550 million (USD41
million) with the plan to lease capacity to other companies.
Plans to have rolled out 5000 ▪ 250 5G enabled sites (or 500 000 households) primarily across Johannesburg
sites by the end of 2020 across and Pretoria as of September 2019.
Rain 5G FWA Cape Town, Johannesburg, ▪ Rains fibre assets under Broadlink will be sold with the deal in 2020.
Pretoria and Durban (of which ▪ Rain shutdown its 4G FWA network in May 2019 with the plan to relaunch as an
2000 will be 5G enabled). open access network.
Neotel Liquid Plans to cover major cities in
FTTP/B, 5G FWA ▪ No rollout details as of March 2020.
Telecom 2020 with its wireless network.South Africa telecoms market report 2020 25
Contents Market overview
Operator profiles and market shares
Infrastructure status and plans
Regulatory information
Recent and forthcoming market developments
About the author and Analysys MasonSouth Africa telecoms market report 2020 26
Regulatory information for South Africa
Figure 32: Regulatory information
Issue Relevant regulatory action
5G spectrum auctions ICASA intends to release 116MHz in the 3500MHz band for 5G services between several operators sometime in 2020.
Not allowed. MTN and Telkom’s proposal to share radio access infrastructure in August 2015 was blocked by the Competition Council on
RAN sharing
the grounds that it would hinder competition.
Mobile number MNP was introduced in November 2006. According to figures from the Number Portability Company 12 783 082 mobile numbers have
portability been successfully ported since November 2006 to end February 2020. Average mobile ports per month is 77 628.
In October 2015 fixed line incumbent Telkom separated its wholesale unit as a standalone division to be called Openserve. The company
Wholesale broadband will be responsible for its own profit and loss. Openserve will be operated on an open access model, where it will sell infrastructure access
and LLU to all licenced operators on a fair and transparent basis. The move has come about without any regulatory intervention. As of February
2020, local loop unbundling (LLU) is still under consideration by ICASA, but has not been implemented.
As of 1 February 2005 any holder of a value added network service (VANS) licence is allowed carry VoIP on their networks. As such VANS
Retail VoIP
operators and ISP’s offer VoIP on a retail basis.
Functional and
Telkom has functionally separated its wholesale and retail division.
structural separation
MTRs for operators with a more than 20% share of total minutes terminated in the wholesale voice market: ZAR0.12 from October 2018,
Mobile termination ZAR0.10 from October 2019 and ZAR0.09 from October 2020.
MTRs for operators with 20% or less share: ZAR0.18 from October 2018, ZAR0.16 from October 2019 and ZAR0.13 from October 2020.
Vodacom has an agreement with Rain and Liquid Telecom, Cell C has an agreement with MTN, and Telkom has an agreement with
Mobile roaming
Vodacom.
Net neutrality Currently no regulatory intervention yet, but the government is keen to enforce network neutrality rules on South African operators.South Africa telecoms market report 2020 27
Contents Market overview
Operator profiles and market shares
Infrastructure status and plans
Regulatory information
Recent and forthcoming market developments
About the author and Analysys MasonSouth Africa telecoms market report 2020 28
Contents Market overview
Operator profiles and market shares
Infrastructure status and plans
Regulatory information
Recent and forthcoming market developments
ICASA is expected to release spectrum needed for 4G and 5G
services in 2020 after considerable delay
ICASA is still going ahead with an open-access network model
(WOAN), but it has scaled the terms back significantly
The new EUSSC regulation will impact mobile handset data
revenue in 2019 and 2020
About the author and Analysys MasonSouth Africa telecoms market report 2020 29
ICASA is expected to release spectrum needed for 4G and 5G services in 2020
after considerable delay
In November 2019, the ICASA published an Information Around 446MHz will be assigned in total, with ICASA taking
Memorandum on the licensing process for the assignment of several key obligations for the licensees in mind.
high-demand spectrum. Prior to this, no spectrum has been
Spectrum to be assigned:
assigned in South Africa for over a decade.
▪ 2×30MHz in the 700MHz band
The release of Spectrum has been continually delayed due to
legal challenges launched by telecoms ministers, operators and ▪ 2×30MHz in the 800MHz band
the consideration of a WOAN. Auctions for spectrum in the
700MHz, 800MHz and 2600MHz band has been in consideration ▪ 170MHz in the 2600MHz band
since 2015, but has been continually delayed and is expected to ▪ 40MHz in the 2300MHz band
be finally be assigned in 2020.
▪ 116MHz in the 3500MHz band.
Spectrum suitable for 4G and 5G services is scarce in South
Africa, which operators claim has, in part, driven the relatively The successful bidders will be subject to six obligations including:
high cost of mobile data services. Operators have refarmed ▪ achieve average download/upload speeds of
spectrum, established numerous roaming deals with each other 30Mbit/s/15Mbit/s to 100% of the population by 2025
and used carrier aggregation to manage the spectrum shortage.
▪ roll out the broadband network to 97% of the population in
The auction will see the release of spectrum needed for both 4G underserved areas before rolling out in urban areas
and 5G services, but the licensees must meet several obligations
and certain portions of each band will be reserved for the WOAN ▪ provide open access to a minimum of at least three MVNOs
(see next section).
▪ buy a minimum of 30% of national capacity from the WOAN
The spectrum will be awarded on a national basis and the reserve for a minimum of 5 years (see next slide).
price for each lot will be different. ICASA is still consulting with
While operators have been waiting for a spectrum auction for
operators and other key players and no final details have been
several years, some may choose to challenge the stringent
released as of March 2020.
obligations during the consultation process.South Africa telecoms market report 2020 30
Contents Market overview
Operator profiles and market shares
Infrastructure status and plans
Regulatory information
Recent and forthcoming market developments
ICASA is expected to release spectrum needed for 4G and 5G
services in 2020 after considerable delay
ICASA is still going ahead with an open-access network
model (WOAN), but it has scaled the terms back
significantly
The new EUSSC regulation will impact mobile handset data
revenue in 2019 and 2020
About the author and Analysys MasonSouth Africa telecoms market report 2020 31
ICASA is still going ahead with an open-access network model (WOAN), but it has
scaled the terms back significantly
The Information Memorandum published by the ICASA in The Information Memorandum includes five options for spectrum
November 2019 guarantees the WOAN assigned spectrum and allocation in the 700MHz, 800MHz and 2600MHz bands. All of
outlines obligations for other operators to contribute to the the options guarantee the WOAN at least 40MHz of spectrum in
open-access model. the 2600MHz band, and then 40MHz split between the 700MHz
and 800MHz band depending on the option.
In October 2016, the Minister of Telecommunications and Postal
Services published the “National Integrated ICT Policy White Successful bidders in the spectrum auction (assumed all major
Paper” which set out a framework for a wholesale open-access operators) can retain their allocated spectrum bands but they will
network (WOAN) operator. Under the original terms of the policy, it have to purchase a minimum of 30% of the national capacity from
was suggested that the ministry could take back spectrum the WOAN for at least five years.
previously assigned to the MNOs and allocate it to the WOAN.
The Information Memorandum indicates a commitment from the
Effectively, all LTE services would be provided through the WOAN.
regulator to achieve some form of wholesale network in the
This policy received considerable criticism and legal challenges, country to improve competition and coverage. However, it has
and the consultation process aided the extended delays to the scaled back from its original ambitions of a nationwide pure-
assignment of 4G spectrum. wholesale model.
The WOAN will be a neutral consortium, including telecoms The regulator is especially committed to achieving nationwide 4G
operators, providing wholesale access to mobile broadband to any coverage. Coverage is generally poor outside of major cities and
operator on an equal basis. especially in terms of 4G services.
An amended draft of the bill was approved by the government in The establishment of a WOAN and the obligations that will be
August 2018, withdrawn in February 2019 and then an updated imposed on successful bidders in the auction process are
version was again adopted in July 2019 which is the latest version designed to achieve 4G coverage of 100% of the population by
as of March 2020. Further changes may be made as the 2025.
consultation process for the Information Memorandum
progresses.South Africa telecoms market report 2020 32
Contents Market overview
Operator profiles and market shares
Infrastructure status and plans
Regulatory information
Recent and forthcoming market developments
ICASA is expected to release spectrum needed for 4G and 5G
services in 2020 after considerable delay
ICASA is still going ahead with an open-access network model
(WOAN), but it has scaled the terms back significantly
The new EUSSC regulation will impact mobile handset data
revenue in 2019 and 2020
About the author and Analysys MasonSouth Africa telecoms market report 2020 33
The new EUSSC regulation will impact mobile handset data revenue in 2019 and
2020
ICASA implemented amendments to the End-User and Figure 33: Impact of the implementation of EUSSC regulation
Subscriber Service Charter (EUSSC) in March 2019 which has on projected mobile data revenue, with or without EUSSC,
forced operators to quickly adapt their billing services and 2015-2024
reduce their data prices. 70
Mobile data revenue (ZAR
Without EUSSC With EUSSC
Amendments to the EUSSC include four significant changes. 60
50
▪ An end to the automatic rollover to per-megabyte charges
billion)
when data bundles are exceeded. Mobile customers must 40
now opt-in to these charges. South Africans previously paid 30
substantial premiums for out-of-bundle data charges and 20
this will help customers to better manage their spend.1
10
▪ Mobile customers are now able to transfer data to other 0
users on the same network. 2015 2016 2017 2018 2019 2020 2021 2022 2023 2024
▪ Operators must now send usage notifications to customers We have reduced our handset data revenue forecast by 12% in
when they have reached 50%, 80% and 100% of the data, 2020 following this regulation.
voice and minute allowances.
The regulation has had a significant impact on operators handset
▪ Unused data no longer automatically expires and customers data prices and revenue. Vodacom reported that in 2019 its out-
can roll it over to the new period for a fee. However, under of-bundle data prices reduced by 50% and its overall price/MB
the regulator’s guidelines, it is not clearly defined what this reduced by 37% following the regulation.
period or fee should be.
We forecast that mobile handset data revenue will be
Some operators have launched legal challenges following these ZAR48 billion in 2020, down from our previous forecast of
amendments and we expect this to continue, particularly with ZAR55 billion. Handset data revenue will continue a strong growth
respect to some of the vague definitions outlined in the policy. trajectory from 2021 as 4G connection numbers continue to rise.
However, we expect much of the changes to remain.
1Mybroadband (2018), Vodacom and MTN subscribers pay up to 2,600% more for out-of-bundle data. Available at
https://mybroadband.co.za/news/cellular/250045-vodacom-and-mtn-subscribers-pay-up-to-2600-more-for-out-of-bundle-
data.html.South Africa telecoms market report 2020 34
Contents Market overview
Operator profiles and market shares
Infrastructure status and plans
Regulatory information
Recent and forthcoming market developments
About the author and Analysys MasonSouth Africa telecoms market report 2020 35
About the author
Terry van Staden (Analyst) is a member of Analysys Mason’s Operator business services and IoT research practice and lead analyst for the SME
Strategies research programme. He specialises in SME bundling strategies, primary research and is responsible for our business survey work.
Prior to joining Analysys Mason, Terry received his masters in economics under full scholarship in South Africa, where his research papers won –
or were nominated for – several national awards. He is a member of the Golden Key International Honour Society and the recipient of the Gold
Duke of Edinburgh's Award.South Africa telecoms market report 2020 36
Analysys Mason’s consulting and research are uniquely positioned
Analysys Mason’s consulting services and research portfolio Consulting
We deliver tangible benefits to clients across the telecoms
industry:
▪ communications and digital service providers, vendors,
financial and strategic investors, private equity and
infrastructure funds, governments, regulators, broadcasters
and service and content providers
Our sector specialists understand the distinct local challenges
facing clients, in addition to the wider effects of global forces.
We are future-focused and help clients understand the challenges
and opportunities new technology brings.
Research
Our dedicated team of analysts track and forecast the different
services accessed by consumers and enterprises.
We offer detailed insight into the software, infrastructure and
technology delivering those services.
Clients benefit from regular and timely intelligence, and direct
access to analysts.South Africa telecoms market report 2020 37 Research from Analysys Mason
South Africa telecoms market report 2020   38

Consulting from Analysys Mason
South Africa telecoms market report 2020

                 PUBLISHED BY ANALYSYS MASON LIMITED IN APRIL 2020
                 Bush House • North West Wing • Aldwych • London • WC2B 4PJ • UK
                 Tel: +44 (0)20 7395 9000 • Email: research@analysysmason.com • www.analysysmason.com/research • Registered in England and Wales No. 5177472
                 © Analysys Mason Limited 2020. All rights reserved. No part of this publication may be reproduced, stored in a retrieval system or transmitted in any form or by any means – electronic,
                 mechanical, photocopying, recording or otherwise – without the prior written permission of the publisher.
                 Figures and projections contained in this report are based on publicly available information only and are produced by the Research Division of Analysys Mason Limited independently of any
                 client-specific work within Analysys Mason Limited. The opinions expressed are those of the stated authors only.
                 Analysys Mason Limited recognises that many terms appearing in this report are proprietary; all such trademarks are acknowledged and every effort has been made to indicate them by the
                 normal UK publishing practice of capitalisation. However, the presence of a term, in whatever form, does not affect its legal status as a trademark.
                 Analysys Mason Limited maintains that all reasonable care and skill have been used in the compilation of this publication. However, Analysys Mason Limited shall not be under any liability for
                 loss or damage (including consequential loss) whatsoever or howsoever arising as a result of the use of this publication by the customer, his servants, agents or any third party.
You can also read