ASSESSMENT OF SNOW CRAB (CHIONOECETES OPILIO) IN THE SOUTHERN GULF OF ST. LAWRENCE (AREAS 12, 12E, 12F AND 19) TO 2020 AND ADVICE FOR THE 2021 ...
←
→
Page content transcription
If your browser does not render page correctly, please read the page content below
Canadian Science Advisory Secretariat
Gulf Region                                                   Science Advisory Report 2021/021

ASSESSMENT OF SNOW CRAB (CHIONOECETES OPILIO) IN
THE SOUTHERN GULF OF ST. LAWRENCE (AREAS 12, 12E,
12F AND 19) TO 2020 AND ADVICE FOR THE 2021 FISHERY

Snow crab (Chionoecetes opilio).                Figure 1. Map of the southern Gulf of St. Lawrence
Credit: Fisheries and Oceans Canada             showing the Crab Fishing Areas (12, 12E, 12F, and 19),
                                                fishing grounds, and management buffer zones (shaded
                                                area). Fishing grounds are labeled as follows: 1)
                                                Chaleur Bay, 2) Shediac Valley, 3) Orphan Bank, 4)
                                                Bradelle Bank, 5) Magdalen Channel, 6) Cape Breton
                                                Corridor, 7) Laurentian Channel, and 8) American Bank.

Context:
Snow crab (Chionoecetes opilio) has been commercially exploited in the southern Gulf of St. Lawrence
since the mid-1960s. There are four individually managed fishing areas among which Area 12 (Figure 1)
is the largest fishery in terms of its fishable surface, number of participants and landings. In Areas 12,
12E and 12F, the fishing season generally starts in April or May as soon as the Gulf is clear of ice and
continues into early summer. In Area 19, the fishery opens after June 30 and typically ends in mid-
September. The landing of females is prohibited and only hard-shelled males ≥ 95 mm of carapace width
are commercially exploited.
DFO Gulf Region Fisheries and Aquaculture Management requested an assessment of the resource
status in 2020 and catch advice for the 2021 fishery. This document provides an overview of the
assessment results. Catch rates and other fishery performance indicators are reported. The
assessment of the status of the southern Gulf snow crab resource (Areas 12, 19, 12E and 12F) is based
on fishery independent trawl surveys that provide indicators of: abundance (commercial biomass),
reproductive potential (abundance of mature females), and recruitment. A science peer review virtual
meeting was held via Zoom on February 10-11, 2021. Participants at the science review were from
DFO Science, DFO Fisheries and Aquaculture Management, fishing industry, and Indigenous
organizations.

June 2021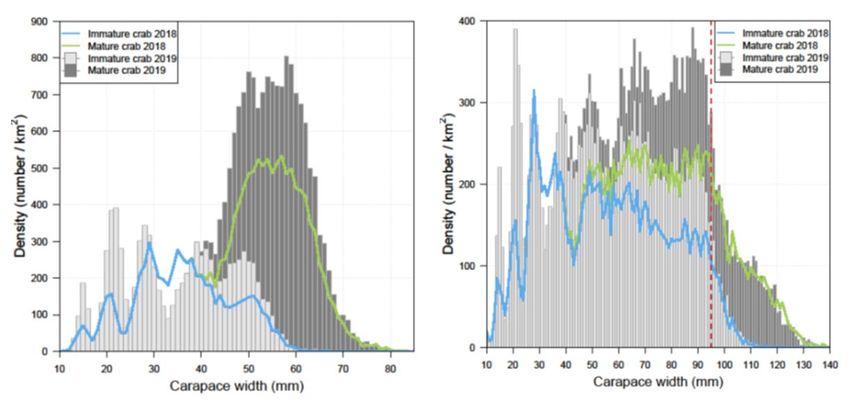
Snow Crab
    Gulf Region                                                   Southern Gulf of St. Lawrence

SUMMARY
•     Snow crab in the southern Gulf of St. Lawrence (sGSL) is considered to be a single stock
      unit for assessment purposes and comprises snow crab fishing areas 12, 12E, 12F, and 19.
•     The landings of snow crab from the sGSL in 2020 were 28,270 tonnes (t) from a revised
      quota of 31,152 t. Catch per unit of effort have decreased in all fishing areas in 2020 from
      2019.
•     Concerns of biomass overestimation were raised during the 2019 assessment and persisted
      in 2020. Indicators of survey biases were presented with supporting data and hypotheses
      were discussed.
•     The exploitation rate of the 2020 fishery was estimated at 35.6% based on the 2019 survey
      commercial biomass estimate. However, overestimation of the commercial biomass would
      imply that the exploitation rate during the 2020 fishing season was higher than estimated.
•     The 2020 commercial biomass was estimated at 77,748 t and composed of 75% recruitment
      and 25% of residual biomass.
•     Overestimation biases ranged from 30 to 40% among mature females and sub-legal males.
      Overestimation bias estimates among commercial crab were estimated at 14%, though this
      value was deemed less reliable because of complex fishery-related dynamics.
•     Recurrent overestimations of the commercial biomass would result in exploitation rates
      exceeding the agreed upon level in the Precautionary Approach harvest decision rules.
•     The risks of biomass indicators falling under the limit and upper stock reference points
      assuming different levels of overestimation biases were presented. However, no consensus
      on the level of overestimation bias was reached.
•     Despite overestimation in the abundance indices, the stock continues to show signs of
      sustained recruitment and productivity. Overall, the stock is expected to remain in the
      healthy zone of the Precautionary Approach.
•     A plan will be developed to address bias and catchability issues for the upcoming surveys
      and consistency in the indicators used in the stock assessment.
•     There is continued evidence of warming conditions in the sGSL and the extent to which it
      could impact snow crab population dynamics and distribution is not well understood.

BACKGROUND
Species Biology
Snow crab (Chionoecetes opilio) is a crustacean with a flat, almost circular body and five
pairs of legs. In order to grow, the hard outer shell is periodically shed in a process called
molting. After molting, crabs have a soft shell for a period of 8 to 10 months. Soft-shelled crab is
defined by shell hardness (< 68 durometer units) and includes both new-soft (condition 1) and
clean hard-shelled crab (condition 2). The term white-crab is used in the summer fishery of
Area 19 because the newly-molted crabs have reached a relatively harder carapace than those
observed during the spring fishery (Areas 12, 12E and 12F). White crab is defined by shell
hardness < 78 durometer units and includes both new soft (condition 1) and clean hard-shelled
crab (condition 2).

                                                   2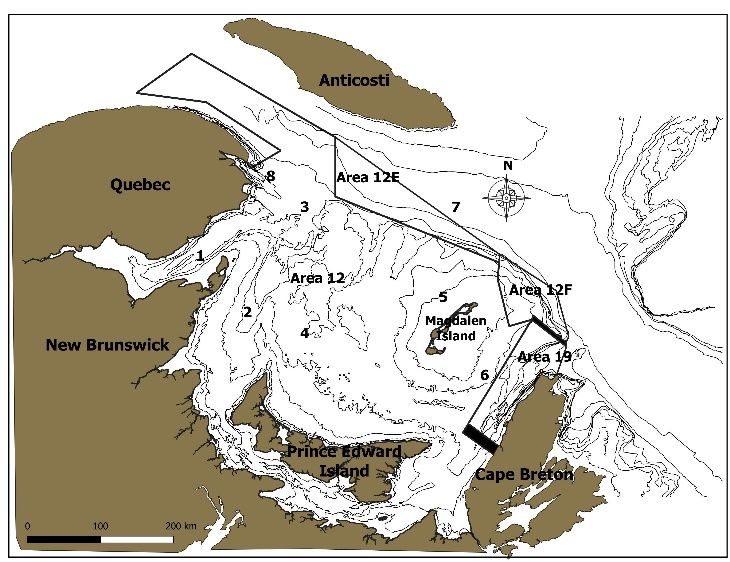
Snow Crab
 Gulf Region                                                                    Southern Gulf of St. Lawrence

Snow crab do not continue to molt throughout their lifespan. Females stop growing when they
acquire a wide abdomen for carrying eggs, occurring at carapace widths (CWs) less than
95 mm. Males stop growing when they acquire large claws on the first pair of legs, which can
occur at CWs between 40 and 150 mm. Females produce eggs that are carried beneath the
abdomen for approximately two years in the southern Gulf of St. Lawrence (sGSL). The eggs
hatch in late spring or early summer and the newly-hatched crab larvae spend 12-15 weeks in
the water column. At the end of this period, they settle on the bottom. It takes at least 8-9 years
(post-settlement) for males to reach legal commercial size.

Fishery
Until 1994, the snow crab fishery in Area 12 (Figure 1) involved 130 mid-shore crab harvesters
from New Brunswick, Quebec, and Nova Scotia. Since 1997, the Prince Edward Island (PEI)
coastal fishery, (formerly Areas 25/26) has been integrated into Area 12. In 2003, a portion of
the coastal fishery off Cape Breton (formerly Area 18) was also integrated into Area 12. For the
purpose of this assessment, Area 12 refers to the management unit that includes snow crab
fishing zones 12, 18, 25, and 26 (as defined in regulation) (Figure 1). The number of allocation
shares in Area 12 was 244 in 2020 (Table 1).
Area 19 (Figure 1) was established in 1978 for the exclusive use of Cape Breton inshore fish
harvesters with vessels less than 13.7 meters (45 feet) in length. There were 158 allocation
shares in Area 19 in 2020.
Areas 12E and 12F were introduced in 1995 as exploratory fisheries. In 2002, the status of
Areas 12E and 12F was changed from exploratory to commercial fishing areas. There were four
snow crab allocation shares in Area 12E and 43 allocations shares in Area 12F in 2020. For
2020, harvesters in Area 12F requested a lower Total Allowable Catch (TAC) than the value
originally assigned for the area based on the decision rule.

Table 1. Number of allocation shares, vessels, traps, revised quotas, opening dates, and dates of the last
landing of the snow crab fishery by management area in the southern Gulf of St. Lawrence in 2020.
 Characteristics                 Area 12          Area 12E          Area 12F           Area 19        Southern Gulf
 Allocation shares 1               244               4                 43                158              449
 Number of active
                                   309                 4                24               106                440
 vessels
 Total number of traps
                                 37,402              475              1,655             1,699             41,231
 allowed
 Opening date                    April 24          April 24          April 24           July 2                -
 Date of the last
                                  July 1           June 30            July 1         August 13                -
 landing
 Revised quota (t) 2             27,435              238              1,192             2,287            31,152 3
 Landings (t)                    24,668              234              1,084             2,284             28,270
1 The number of quota allocations among which the Total Allowable Catch (TAC) is divided (Source: DFO

Administrative List for Snow Crab Areas 12, 12E, 12F, and 19).
2 For reasons of interannual quota adjustments, reconciliations, and re-distribution of the scientific quota among

areas, the revised quota does not necessarily correspond to the TAC in the notice to harvesters.
3 Quota includes 450 t set aside to finance the trawl survey in 2020 (under Section 10 of the Fisheries Act).

The minimum legal CW for this male only fishery is 95 mm; soft-shelled and white crab are not
targeted or retained by the fishery.
Management of these fisheries is based on quotas and effort controls (trap allocations, trap
dimensions, and seasons). At-sea soft-shelled and white crab catch monitoring protocols allow
for the closure of portions of fishing areas when the proportion of these males exceeds 20% in

                                                           3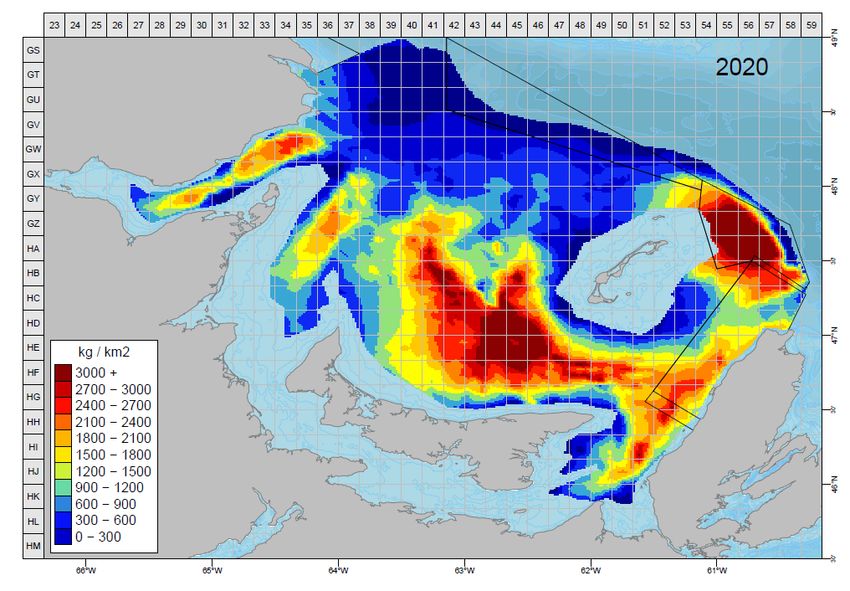
Snow Crab
 Gulf Region                                                         Southern Gulf of St. Lawrence

the catch. The protocols are in place to maximize the yield and the reproductive potential of the
resource. Due to the COVID-19 pandemic, there were few at-sea observers deployed onboard
snow crab vessels during the 2020 fishing season. The soft-shelled protocol was consequently
not applied in Areas 12, 12E and 12F. As COVID-19 restrictions eased during the summer,
observers were deployed on Area 19 fishing vessels and the white-shelled crab protocol was
applied in the area. Because of limited data, analyses based on the at-sea observer data to
monitor the fishery performance such as the catch composition, the mean size of commercial-
sized males and the percentage of soft-shelled crabs could not be performed for the 2020
fishing season.
Grid closures were implemented at different times during the fishing season based on confirmed
observations of North Atlantic right whales (NARW). These closures displaced some of the
fishing effort from traditional grounds in 2020. Information on the closures can be found here.
The landings from the sGSL were low in the 1970s and increased with four periods of high
landings: 1981-1986, 1994-1995, 2002-2009, and more recently 2012 to 2020 (Figure 2). Snow
crab landings from the sGSL in 2020 were 28,270 t from a revised quota of 31,152 t. Factors that
could explain why portions of the quota were not landed, a first for the time-series, include
displaced fishing effort in response to grid closures for NARW, overall lower catches, and lower
than expected abundance of commercial-sized adult male crabs.

Figure 2. Landings (tonnes; t) in the southern Gulf of St. Lawrence snow crab fishery by fishing area from
1969 to 2020.

Landings in Area 12 were 24,668 t from a revised quota of 27,435 t (Tables 1 and 2; Figure 2).
The fishing effort estimated from logbooks has varied from 161,148 to 559,365 trap hauls
between 1987 and 2020, with the lowest effort in 2010 and the highest effort in 2020 (Hébert et
al. 2021).

                                                    4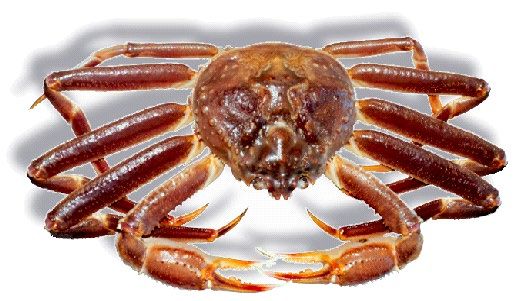
Snow Crab
 Gulf Region                                                                   Southern Gulf of St. Lawrence
Table 2. Quota and landings (tonnes; t), catch per unit of effort (CPUE; kg/trap-haul), fishing effort (trap
hauls), soft-shelled crab percentages, and associated closed grids for the snow crab fishery in Area 12,
2012 to 2020.
Fishery descriptor       2012      2013       2014       2015      2016       2017       2018       2019      2020
Quota (t) 1              18,143    22,548     19,409     23,021    19,393     39,651     20,909     28,051    27,435
Landings (t)             18,159    22,645     19,633     23,080    19,499     39,825     20,769     27,554    24,668
CPUE
                          68.0       76.4       61.8      67.9       64.0       72.0      44.2       55.5       44.1
(kg/trap-haul)
Effort (trap hauls)     267,044 296,398 317,689 339,912 304,624 553,125 469,887 496,468 559,365
Soft-shelled crab
                           3.7        2.8       4.4        4.9        5.3       6.0        4.4        5.2       NA4
(%) in catches 2
Grids closed
                            7          5         8         41          5         57         43        93        NA4
(total of 323)
1Since  2012, quotas were revised for inter-annual quota adjustments, reconciliations, and re-distribution of the
scientific quota among areas, the revised quotas do not necessarily correspond to the TAC in the notice to
harvesters.
2 The percentages are based on durometer readings < 68. Catches are defined as male crabs of all sizes.
3 Grids closed according to the soft-shelled crab protocol. Additional closures to minimize fishery interactions with

North Atlantic right whales are not accounted for in this table.
4 At-sea observer coverage was limited in 2020 due to the COVID-19 pandemic.

The 2020 landings in Area 12E were 234 t from a revised quota of 238 t (Tables 1 and 3;
Figure 2). The fishing effort in Area 12E has varied from 1,825 to 10,074 trap hauls between
1995 and 2020, with the lowest effort in 2010 and the highest effort in 2006 (Hébert et al. 2021).
The fishing effort in Area 12E increased from 3,415 trap hauls in 2019 to 5,098 trap hauls in
2020.

Table 3. Quota and landings (tonnes; t), catch per unit of effort (CPUE; kg/trap-haul), fishing effort (trap
hauls), soft-shelled crab percentages, and associated closed grids for the snow crab fishery in Area 12E,
2012 to 2020.
Fishery descriptor         2012      2013       2014       2015       2016      2017       2018       2019      2020
Quota    (t) 1             251        204        170        189       144        199        266       217        238
Landings (t)               185        204        178        192       144        203        260       224        234
CPUE (kg/trap-haul)        32.9       40.1       47.3      65.8       51.5       60.9      46.6       65.7       45.9
 Effort (trap hauls)      5,623     5,097     3,765      2,918     2,796     3,333      5,579      3,415       5,098
 Soft-shelled crab
                           3.3       15.9       7.8       9.8        1.1       2.0       4.6         3.1        NA3
 (%) in catches 2
 Grids closed
                            0          0         0         0          0         0         0           0         NA3
 (total of 8)
1Since 2012, quotas were revised for interannual quota adjustments, reconciliations, and re-distribution of the

scientific quota among areas, the revised quotas do not necessarily correspond to the TAC in the notice to
harvesters.
2 The percentages are based on durometer readings < 68. Catches are defined as male crabs of all sizes.
3 At-sea observer coverage was limited in 2020 due to the COVID-19 pandemic.

In Area 12F, the landings were 1,084 t from a revised quota of 1,192 t (Tables 1 and 4;
Figure 2). The fishing effort in Area 12F has varied from 4,437 to 23,163 trap hauls between
1995 and 2020, with the lowest effort in 2002 and the highest effort in 2014 (Hébert et al. 2021).
The fishing effort increased from 18,083 trap hauls in 2019 to 22,168 trap hauls in 2020.

                                                            5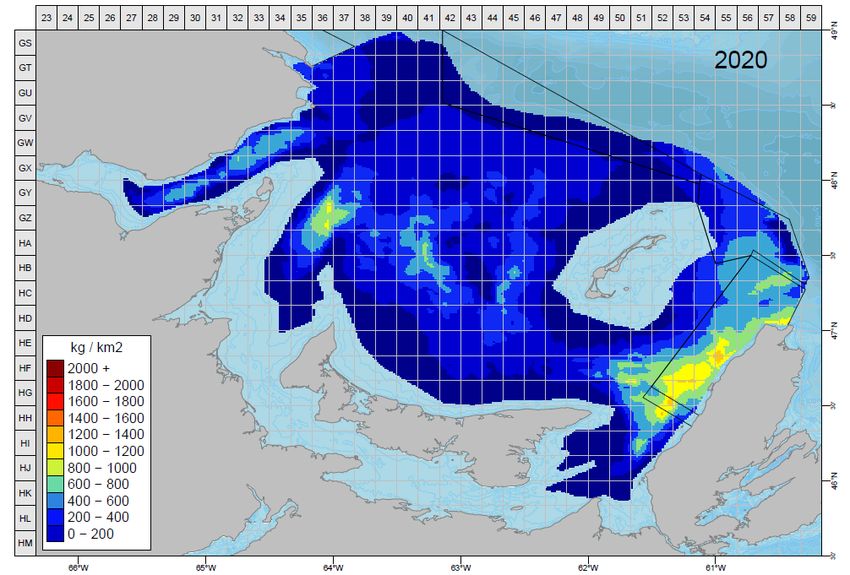
Snow Crab
 Gulf Region                                                                  Southern Gulf of St. Lawrence
Table 4. Quota and landings (tonnes; t), catch per unit of effort (CPUE; kg/trap-haul), fishing effort (trap
hauls), soft-shelled crab percentages, and associated closed sectors for the snow crab fishery in
Area 12F, 2012 to 2020.
Fishery descriptor         2012       2013      2014       2015       2016      2017       2018      2019          2020
Quota    (t) 1              706       543        906        516       373        680      1,218      1,155         1,192
Landings (t)                706       543        882        510       381        684      1,183      1,166         1,084
CPUE (kg/trap-haul)        41.8       49.0       38.1      38.2       43.9      72.6       69.1       64.5         45.2
 Effort (trap hauls)      16,890 11,086       23,163     13,351     8,667     9,421     17,120     18,083      22,168
 Soft-shelled crab
                           9.4         2.4      1.7       3.3        10.4      1.9        1.3         2.1       NA3
 (%) in catches 2
 Sectors closed
                            0           0        0         0          0         0          0           0        NA3
 (total of 3)
1Since 2012, quotas were revised for interannual quota adjustments, reconciliations, and re-distribution of the

scientific quota among areas, the revised quotas do not necessarily correspond to the TAC in the notice to
harvesters.
2 The percentages are based on durometer readings < 68. Catches are defined as male crabs of all sizes.
3 At-sea observer coverage was limited in 2020 due to the COVID-19 pandemic.

The 2020 landings in Area 19 were 2,284 t from a revised quota of 2,287 t (Tables 1 and 5;
Figure 2). The fishing effort in Area 19 has varied from 11,138 to 56,517 trap hauls between
1987 and 2020, with the lowest effort in 2010 and the highest effort in 2004 (Hébert et al. 2021).
The effort in 2020 was 22,458 trap hauls, a decrease from 2019.

Table 5. Quota and landings (tonnes; t), catch per unit of effort (CPUE; kg/trap-haul), fishing effort (trap
hauls), white crab percentages, and associated closed sectors for the snow crab fishery in Area 19, 2012
to 2020.
Fishery descriptor         2012      2013       2014      2015       2016       2017      2018       2019          2020
Quota (t) 1               2,907      2,654     3,745      2,130      1,701     2,945      2,046      2,792     2,287
Landings (t)              2,906      2,657     3,745      2,129      1,701     2,944      2,048      2,792     2,284
CPUE (kg/trap-haul)       178.1      148.5     147.4      144.8      142.5     142.8      156.1      112.7     101.7
Effort (trap hauls)       16,317    17,890     25,407    14,703     11,937     20,616    13,120     24,774     22,458
White crab
                            4.5       3.0        1.0       5.5        8.2       11.6       8.8       20.9          NA
(%) in catches 2
Sectors closed3             0/9       0/9        0/9       2/9        4/9        3/9       1/9        4/9          6/9
1Since  2012, quotas were revised for interannual quota adjustments, reconciliations, and re-distribution of the
scientific quota among areas, the revised quotas do not necessarily correspond to the TAC in the notice to
harvesters.
2 The percentages are based on durometer readings < 72. Catches are defined as male crabs of all sizes.
3 Total number of sectors was changed from 4 to 9 in 2009.

Catch per unit of effort (CPUE; expressed as kilogram per trap-haul, kg/th) is considered an
index of fishery performance and is calculated directly from logbook data as the ratio of total
landings (kg) to total effort (trap-hauls). CPUE values are not standardized and do not account for
changes in management measures and fishing practices and as a result may not be directly
proportional to biomass. The fishery CPUE indices are not used to infer on abundance of the
commercial adult male snow crab. The unstandardized CPUE from the fishery correlates weakly
with the estimated biomass from the assessment. This results in differences in perception of
stock abundance based on fishing industry observations (CPUE variations within season and
between years) from those of the assessment.
Average CPUE during the 2020 fishery decreased in all areas compared to 2019 (Figure 3).

                                                           6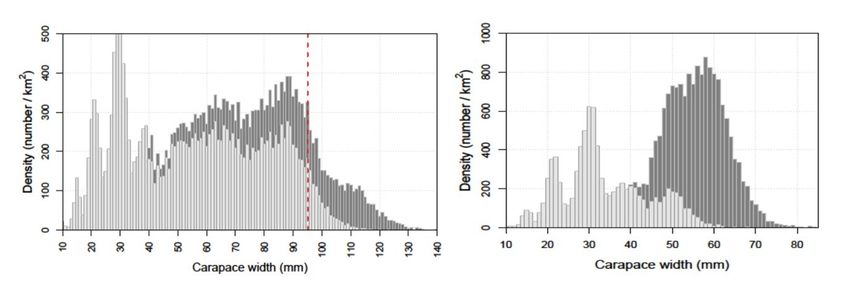
Snow Crab
 Gulf Region                                                        Southern Gulf of St. Lawrence

Figure 3. Catch per unit effort (CPUE; kg / trap-haul) in the southern Gulf of St. Lawrence snow crab
fishery, Areas 12 (black squares), 12E (black circles), 12F (open circles) and 19 (open squares) based on
logbooks, 1997 to 2020.

ASSESSMENT
Snow crab in the sGSL is considered as a single stock unit for assessment purposes. This stock
unit comprises snow crab fishing areas 12,12E,12F and 19.
Details of the snow crab survey design and protocol can be found in DFO 2012a. The polygons
used for the assessment can be seen in Figure 4. In 2020, the number of sampling stations
remained at 355. As per the recommendations from the 2014 scientific peer review
(DFO 2014a), the 350 successful sampling stations from the 2019 trawl survey were used as
fixed stations and a new set of five sampling stations (i.e. the three stations that were
abandoned and the two sampling stations that were conducted outside their assigned grids in
2019) was generated randomly. The survey was conducted from the vessel Avalon Voyager II,
a new vessel used since 2019. A total 353 stations were successfully trawled in 2020; two
sampling square grids had to be abandoned due to failures to successfully trawl the area. The
survey was conducted between July 11 and September 10, 2020. Sampling protocols were
identical to previous years (Hébert et al. 2021).
The survey in 2020 was financed through a collaborative agreement with the fishing industry
under Section 10 of the Fisheries Act.

                                                    7
Snow Crab
Gulf Region Southern Gulf of St. Lawrence
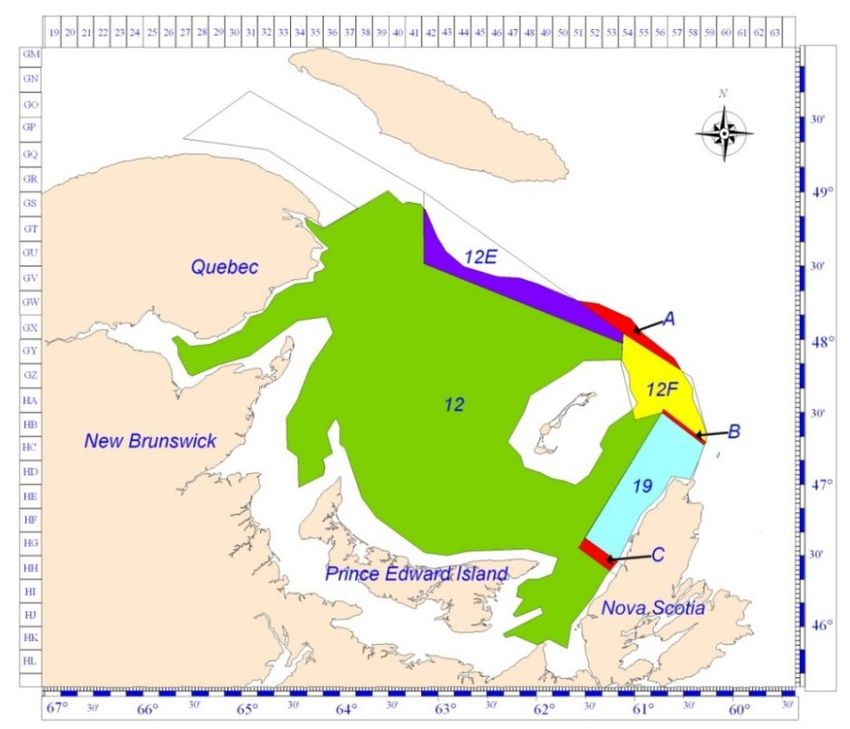
Figure 4. The survey and estimation polygon of 57,842.8 km2 used for the 2020 snow crab stock
assessment in the southern Gulf of St. Lawrence (all of the coloured areas) and corresponding estimation
polygons for the four crab fishing areas (12, 12E, 12F, and 19). The unassigned zone north of areas 12E
and 12F (label A) and buffer zones (labels B and C) are also shown.
Stock Status, Trends and Recent Survey Issues
Stock status is assessed from various abundance and biomass indices calculated using kriging
with external drift (KED), with depth as a secondary variable (DFO 2012a; Wade et al. 2014),
applied to standardized survey catches (numbers or weights per trawl swept area). Commercial
crab biomass (legal-sized adult males) was sub-divided by residual biomass (hard-shelled adult
males of legal size remaining after the fishery) and recruitment biomass (soft-shelled adult
males >= 95 mm CW referred to as R-1 that will be available to the fishery the following fishing
season). Predictors of four- three- and two-year fishery recruitment indices are also estimated,
referred to as R-4, R-3 and R-2, respectively (see DFO 2020 for definitions). A population
recruitment index is estimated from survey catches of small male crabs (34-44 mm CW), which
take at least six years to reach commercial size.
The change in survey vessel in 2019 was accompanied by significant catch increases of 30-
40% among male crab from 34 mm to 95 mm CW and mature female crab (Figure 5). These
catches suggest an increase in survey catchability, as natural processes such as recruitment,
migration or mortality cannot account for these increases over such a broad size range.
Investigations in 2019 suggested that an increase of unaccounted bottom trawling during the
hauling of the net, referred to as the passive trawling phase, partially accounted for 12.9% of the
increase in trawl swept area (DFO 2020). In 2020, despite additional measures implemented to
control the passive trawling phase, the survey catches remained significantly high compared to
2018.
In contrast, commercial sized-crab abundance and biomass remained at comparable levels over
the same period (2018-2020). Despite the uncertainties and unknown mechanisms surrounding
the increased survey catchability among sub-legal males and mature females accompanying
8Snow Crab
Gulf Region Southern Gulf of St. Lawrence
the change in survey vessel, quantifying the increase in catchability on commercial-sized males
component, which is highly affected by the fishery, is complex to resolve. Hypotheses were
proposed to explain this apparent stability of the commercial index of the crab stock in 2019 and
2020 despite the survey catchability increases among sub-legal male and female crab. Among
the probable hypotheses are; 1) a strong increase in commercial-sized male crab mortality in
2019 and 2020 that counterbalanced a survey catch increase among commercial crab that
would otherwise have been observed and, 2) that survey catchability increases are size-
dependent and strongly focused on sub-legal-sized crab. Other proposed hypotheses were
large-scale crab migration, or increases in catchability located in areas of high female and sub-
legal male abundance. However, these additional hypotheses cannot account for the degree of
the increases nor their restricted association to sub-legal sizes.
Figure 5. Comparison of the size-frequency distributions from the 2018 and 2019 snow crab surveys for
male (left panel) and female (right panel) snow crab. Blue lines indicate 2018 immature crab, green lines
represent 2018 mature crab, vertical dash red line indicates the 95 mm CW legal size. 2019 immature
crab are indicated by light grey bars while 2019 mature crab are represented by dark grey bars.
As a result of the repeated high catches of mature female and sub-legal male snow crab in
2020, methods were proposed to estimate the potential bias on the commercial-sized male
survey biomass using the 2020 fishery landings data and/or the residual biomass from the 2020
post-fishery survey. The first method compared the sum of the 2020 landings plus the 2020
residual biomass with the commercial biomass estimate from the 2019 survey with a 70%
survival rate applied (5-years moving average on commercial-sized adult males). The sum of
the residual biomass plus the landings in 2020 was 14.4% lower than the commercial biomass
estimate from the 2019 survey. This difference between the predicted and observed biomass
values suggests an overestimation bias of 14.4% in the commercial biomass for the 2020
fishery. Moreover, the overestimation of the survey indices would also apply to the residual
biomass estimate, resulting in the difference from the method described above being possibly
higher than 14.4%.
A Leslie analysis was explored as a second method, estimating the initial, or pre-fishery,
biomass based on the depletion of the weekly CPUE during the 2020 fishery. The use of CPUE
as core data raised concerns as fishery catches are known to be influenced by many factors
and may not reflect true stock abundance signals. While the results of the Leslie analysis
9Snow Crab
Gulf Region Southern Gulf of St. Lawrence
supported an overestimation bias of >14.4% on the commercial biomass estimate, the method
was deemed unreliable.
In summary, data are suggesting that mature female and sub-legal male abundance indices for
2019 and 2020 are over-estimated by 30-40%, while commercial-sized crab could be over-
estimated by at least 14.4%. These biases will be considered in the following assessment and
risk analysis, though corrections will not be directly applied, unless otherwise stated.
The point estimate for the biomass of commercial-sized adult males in the sGSL from the 2020
trawl survey was estimated at 77,748 t (Table 6; Figure 6). In the 2020 trawl survey,
concentrations of commercial-sized adult males were located in Bradelle Bank, in Shediac
valley, in Chaleur Bay, in the central and southern parts of the Magdalen Channel, in Area 12F
and in the southeastern part of the sGSL (Figure 6). The majority (81.6%) of the biomass in
2020 was located in Area 12, followed by Area 19, 12F, 12E with respectively 9.0, 8.5, and
0.9%.
Table 6. Total commercial, recruitment, and residual biomass (t; means with 95% confidence intervals) of
commercial-sized adult male crabs (>= 95 mm carapace width) in the southern Gulf of St. Lawrence,
2009 to 2020.* Data from the 2019 and 2020 surveys are likely overestimated.
Commercial Recruitment Residual
Year of the survey Biomass (t) Biomass (t) Biomass (t)
31,015 20,618 10,454
2009
27,519-34,829 17,747-23,818 8,687-12,474
35,929 20,477 15,490
2010
32,049-40,147 17,815-23,423 13,022- 18,289
62,841 29,643 33,679
2011
55,985-70,299 25,676-34,045 28,430-39,613
74,778 49,010 25,615
2012
64,881-85,748 40,382-58,931 21,607-30,147
66,709 39,988 27,092
2013 54,294-81,108 31,504-50,055 22,041-32,952
67,990 44,285 23,863
2014 59,802-76,978 37,440-52,014 20,356-27,799
58,927 34,982 24,108
2015 51,368-67,278 29,145-41,643 20,290-28,429
98,394 74,124 24,309
2016 87,150-110,677 64,811-84,392 20,876-28,143
65,738 51,127 14,650
2017 57,221-75,157 43,976-59,103 12,134-17,534
80,746 59,609 21,432
2018 70,984-91,467 51,755-68,310 17,271-26,291
79,066* 58,995* 20,291*
2019* 69,072-90,091 50,215-68,863 16,940-24,109
77,748* 58,438* 19,107*
2020* 67,706-88,852 49,759-68,189 16,235-22,339
10Snow Crab
Gulf Region Southern Gulf of St. Lawrence
The estimated recruitment to the fishery at the time of the 2020 survey represented 75% of the
commercial biomass estimate. The remaining 25% is the residual biomass estimate. Though the
proportion of the residual biomass in 2020 is similar to previous years, its distribution appears
more diffused in 2020 (Figure 7). High concentrations of residual biomass have not been
observed despite many fishing grid closures, suggesting a high fishing pressure on the
commercial biomass or an increase in discard mortality on these crabs during the 2020 fishing
season.
Figure 6. Densities (kg per km2) of commercial snow crab caught in the 2020 sGSL snow crab trawl
survey.
11Snow Crab
Gulf Region Southern Gulf of St. Lawrence
Figure 7. Densities (kg per km2) of the residual biomass of snow crab caught in the 2020 sGSL snow crab
trawl survey.
Figure 8. Estimated (black circles are the means with 95% confidence interval vertical bars) and predicted
(open squares are the means with the 95% confidence interval bands as dashed lines) biomasses of R-1
(adult male crabs >= 95 mm carapace width of carapace condition 1 and 2) snow crab in the year of the
survey, 1997 to 2020. The predicted abundances are based on a relationship to the estimated
abundances of R-2 (adolescent male crabs with a carapace width larger than 83 mm) in the previous
year. Prediction of R-1 biomass for 2021 is based on abundances of R-2 estimated in 2020 and shown in
Figure 9.
12Snow Crab
Gulf Region Southern Gulf of St. Lawrence
From 2015 to 2019, the estimated abundance of commercial-sized adult male recruitment has
been higher than the predicted values (Figure 8). Following the vessel change in 2019, the high
predicted recruitment to the fishery for 2021 is driven by the overestimated abundance of R-2
crab from the survey in 2020. The extent to which recruitment to the fishery will be realized in
2021 is uncertain given the overestimation in the survey estimates.
Despite overestimation in the abundance indices, the stock continues to show signs of
sustained recruitment and productivity, along with a strong cohort (25-34 mm CW) among small
male and female crabs in 2020 (Figure 9). Overall the stock is expected to remain in the healthy
zone of the Precautionary Approach (PA) framework (DFO 2014b, Figure 10).
Figure 9. Size-frequency distributions from the 2020 snow crab survey for male (left panel) and female
(right panel) snow crab. Immature crab are indicated by light grey bars while mature crab are represented
by dark grey bars. The vertical dash red line indicates the 95 mm CW legal size for male.
To account for probable bias in the 2020 trawl survey commercial biomass estimate, different
options were proposed. The first approach was to apply a 15% correction factor to the 2020
survey biomass estimate of 77, 748 t and perform a risk analysis for catch options with a 30%
bias on the abundance of R-2 in 2019 and 2020. This resulted in a corrected commercial
biomass of 66,086 t and an exploitation rate of 38.3% based on the harvest decision rules and a
catch option of 25,311 t for the 2021 fishing season. The second approach addressed
uncertainties around the quantification of the bias on the 2020 survey commercial biomass
estimate. A risk analysis was performed applying equal weight to a bias range from 0 to 30%
and is considered to be a robust analytical approach to deal with the range of potential bias
levels. Under this option, in order to maintain a less than 5% probability of the stock reference
point to fall under Blim, the catch option would need to be set lower than 26,000 t. The last
approach presented was the use of the Flim of 34.6% as identified in the PA (DFO 2012b) on the
uncorrected commercial biomass of 77, 748 t. This resulted in a catch option of 26,901 t for the
2021 fishing season.
Using the 2020 point estimate for the commercial biomass (77,748 t), notwithstanding indicators
suggesting potential overestimation would define a 40.4% exploitation rate and a catch option of
31,410 t.
13Snow Crab
Gulf Region Southern Gulf of St. Lawrence
Figure 10. Harvest decision rule (solid black line; proportional variant 4; DFO 2014b) for the southern Gulf
of St. Lawrence snow crab fishery.
Environmental Considerations
In September 2020, near-bottom temperatures were near the mean value of the period 1991 to
2020 in the central portion of Area 12 as well as in the western part Chaleur Bay. However, the
bottom waters in large portions of Area 12, Area 19, the deeper parts of Area 12E and 12F, and
both entrances of Northumberland Strait were significantly warmer than normal. The channels
connecting the slope of the Laurentian Channel to the mouth of Chaleur Bay were also warmer
than normal. Colder-than-normal bottom waters were only present in a small area south of
Shediac Valley and in St. George’s Bay.
In September 2020, the snow crab habitat index (bottom area with temperatures from -1 to 3°C)
was the fourth lowest of the 1971-2020 time series (Figure 11). It was 10% below the 1991-
2020 average in 2020 and is similar to the 2019 value which was down 11% from the 2018
value. The mean temperature (1.3°C) within the defined snow crab habitat area index (-1 to
3°C) in 2020 increased by about 0.3°C compared to 2019 (1.0ºC, Figure 11). Looking at the last
three decades, the mean temperature was at the highest of the time series in 2012, decreased
in 2013 and 2014, and remained above the normal since then.
Snow crab is a stenothermic species with a preference for colder water temperatures. A
temperature regime shift from cold to warm may have impacts on population dynamics of snow
crab such as shortened reproductive cycles, increased per capita fecundity, and increased size
at maturity, greater natural mortality, spatial contraction of habitat, and skewed sex ratio for
reproduction. The outcome of climate change on snow crab population dynamics can be
relatively abrupt and even detrimental, and the direction of the effect may be difficult to predict
(Sainte-Marie et al. 2008).
14Snow Crab
Gulf Region Southern Gulf of St. Lawrence
Figure 11. Habitat area index (water temperatures of -1 to 3ºC; km²; square symbols) for commercial-
sized adult male snow crab in the southern Gulf of St. Lawrence and the mean temperature (ºC; circle
symbols) within the index area from 1971 to 2020.
Sources of Uncertainty
Meaningful interpretation of long-term trends and variations of snow crab stocks relies on a
robust sampling protocol, sampling design and standardization of survey catches. In addition to
current survey catchability issues, the survey has undergone a number of changes to its
sampling design, including multiple areal expansions, survey station redistributions and five
survey vessel changes. In particular, only half of the survey stations have remained fixed since
the last survey redesign in 2013 due to the practice of relocating survey stations when trawl
damage is encountered. The relocation of stations has introduced a potential source of bias
when they are consistently moved to more trawlable bottoms. These issues can weaken the
ability to track population trends as well as situating the stock with respect to the harvest control
rule limits and reference points.
In 2019 and 2020, survey catchability increased among sub-legal and mature female crab. This
surge was partially explained by an increase in the extent of the passive trawling phase, brought
on by changes in winch speed and end-of-tow vessel maneuvers, though other unknown
mechanisms associated with the 2019 vessel change are thought to have played a role. As the
catches of commercial-sized male snow crab in 2019 and 2020 was comparable to 2018, the
relationship of these mechanisms to the commercial stock is currently unknown.
Environmental conditions in the sGSL are known to affect a number of life history processes
including molting and growth, reproduction, larval development and migratory behavior. Varying
annual conditions are expected to affect abundance and biomass estimates through seasonal
migratory changes, making the timing of survey sampling a potential issue along more marginal
survey areas. Longer-term influences of environmental conditions on life history processes may
15Snow Crab
Gulf Region Southern Gulf of St. Lawrence
lessen our ability to predict fishery recruitment, which currently assumes homogeneity through
time.
Of major concern for the long-term future of the stock is the consistent warming of the deep
waters of the Laurentian Channel. If this warm water mass were to penetrate further into the
sGSL it would significantly lower the quality of snow crab habitat. Incursions of these warmer
waters are currently limited to peripheral snow crab habitat in areas 12E, 12F and the
northeastern part of Area 19.
CONCLUSIONS AND ADVICE
Despite the potential overestimation of the 2019 and 2020 commercial biomass estimates, the
snow crab stock continues to be considered in the healthy zone of the PA and shows strong
signs of recruitment and productivity.
While the proportion of residual biomass in 2020 is similar to previous years, high
concentrations of residual biomass were not observed in the survey despite fishing grid
closures, suggesting a high fishing pressure on the commercial biomass or an increase in
discard mortality.
The increased survey catchability and corresponding increases in passive phase trawling were
identified and presented following the 2019 survey, however no corrective action on the
commercial biomass estimate was applied for the 2020 season (DFO 2020). In 2020, 11% of
the TAC was left unfished, the first time since 1997 that such a portion of the quota was not
landed. Leaving a portion of the quota unharvested is consistent with the interpretation of
commercial biomass overestimation, with additional caveats of a later than normal fishery
opening and NARW area closures.
A risk table is presented (Table 7) summarizing the probability associated to the lower (Blim or
LRP) and upper stock reference points (BUSR) for different levels of assumed bias on the
commercial biomass, along with the corresponding exploitation rates, for a fixed catch option
using the point estimate of 77,748 t. The probability of falling under BUSR remains close to zero
under every scenario due to the strong predicted recruitment to the commercial stock, even
when a 30% overestimation is considered on the recruit abundance index. When an
overestimation bias of 10% was applied to the point estimate, the probability of going under Blim
(residual biomass of under 10,000 t) was very close to the PA threshold value of 5% and
increased rapidly with the level of bias. In scenarios of a 10% bias or more, the realized
exploitation rate would exceed the agreed maximum rate of 45% as defined in the harvest
decision rules in the snow crab PA (DFO 2014b).
16Snow Crab
Gulf Region Southern Gulf of St. Lawrence
Table 7. Risk table demonstrating the probabilities of falling under the Precautionary Approach (PA)
reference points for different levels of presumed overestimation bias applied to the biomass point
estimate as well as the realized exploitation rates for the different scenarios.
Bias on the Biomass
Residual Commercial Exploitation rate (%)
commercial estimate (t)
biomass biomass assuming TAC
biomass (corrected for
< B lim < B USR of 31,410 t
estimate bias)
0% 77,748 t 0% 0% 40.4%
5% 73,861 t 0.7% 0% 42.5%
10% 69,973 t 4.2% 0% 44.9%
15% 66,086 t 17.4% 0.1% 47.5%
20% 62,198 t 44.8% 0.4% 50.5%
With respect to fishing pressure, the overestimated commercial biomass resulted in increases to
the projected exploitation rate (Table 7), which could have potential consequences to the stock
and fishery. For example, higher than intended exploitation rates could lead to lower fishery
performances in 2021, i.e. low CPUE, which would increase the amount of fishing effort required
to catch the TAC.
Past changes in survey vessels, fishing practices, statistical design, and survey station
relocations have led to variations in survey catchability. Such factors must be either controlled
or otherwise accounted for if abundance and biomass estimates are to remain comparable from
year to year otherwise perceived changes in abundance and biomass indices may no longer
reflect true changes in stock size. For 2021, adopting a subset of fixed survey stations is
proposed to address the trend of drifting into trawlable habitat. Changes to the end-of-tow
procedure will be proposed to reduce the impact of the passive phase on the time series.
Additional technological tools (e.g. camera system, positional sensors) will also be explored to
further examine trawl catchability and behavior following the active-trawling phase.
To further refine the time-series indices and confidence in the biomass estimation, other
sources of comparative data, when available, will be utilized to develop abundance indicators
and to groundtruth survey indices. The development of a population model as a means of
estimating annual changes in catchability, in addition to retroactively standardizing the survey
time-series, continues to progress. To address questions with respect to spatial and temporal
patterns in catch and biomass, and to detect potential bias related to depth and/or bottom
temperature, spatial analyses will be examined.
Given the multiple indices indicating an overestimation bias in the 2020 survey estimates
ranging up to 40%, in addition to the diffuse and low residual biomass and 11% of the TAC not
being captured, options compliant with DFO’s PA have been presented to be considered for the
2021 season.
17Snow Crab
Gulf Region Southern Gulf of St. Lawrence
LIST OF MEETING PARTICIPANTS
Name Affiliation
Adam Cook DFO Science - Maritime
Alan Dwyer DFO Fisheries and Aquaculture Management - Gulf Antigonish
Amélie Rondeau DFO Science - Gulf
Brittany Beauchamp DFO Science - NCR
Carter Hutt PEI Snow Crab Association
Craig Knickle Mi'kmaq Confederacy of PEI
Daniel Desbois Association des crabiers Gaspésiens inc. (ACG)
Darrell Mullowney DFO Science – Newfoundland and Labrador Region
Devin Ward North Shore Micmac District Council (Anquotum Resource Management)
Emmanuel Saindt-Duguay Association de gestion halieutique autochtone Mi’kmaq et Malécite (AGHAMM)
Jean Lanteigne Fédération régionale acadienne des pécheurs professionnels (FRAPP)
Jean-François Landry DFO Science - Gulf
Jérôme Beaulieu DFO Fisheries and Aquaculture Management - Québec
Joel Chassé DFO Science - Gulf
Josiane Massiera DFO Fisheries and Aquaculture Management - Gulf Moncton
Laura Ramsay Prince Edward Island Fishermen’s Association (PEIFA)
Leonard LeBlanc Gulf Nova Scotia Fleet Planning Board
Luc Haché Association interprovinciale des crabiers zone 12E
Marcel Hébert DFO Science - Gulf
Mark Laflamme DFO Science - Gulf
Martin Noël Association des pêcheurs professionnels crabiers acadiens (APPCA)
Mathieu Noël Union des pêcheurs des maritimes
Matthew Hardy DFO Science - Gulf
Mélanie Roy DFO Science - Gulf
Mikio Moriyasu DFO Science - Gulf
Paul Boudreau Regroupement des pêcheurs professionnels des Îles-de-la-Madeleine
Renée Allain DFO Science - Gulf
Robert Haché Association des crabiers acadiens inc. (ACA)
Stephanie Boudreau DFO Science - Gulf
Steve Lapierre Groupe de pêcheurs zone 12F Inc.
Steve Haché DFO Communications - Gulf
Tobie Surette DFO Science - Gulf
SOURCES OF INFORMATION
This Science Advisory Report is from the February 10-11, 2021 regional advisory meeting on
the stock status in 2020 and fishery advice for 2021 for Snow Crab from the Southern Gulf of
St. Lawrence. Additional publications from this meeting will be posted on the Fisheries and
Oceans Canada (DFO) Science Advisory Schedule as they become available.
18Snow Crab
Gulf Region Southern Gulf of St. Lawrence
DFO 2012a. Proceedings of the Gulf Region Science Peer Review Framework Meeting of
Assessment Methods for the Snow Crab Stock of the southern Gulf of St. Lawrence;
November 21 to 25, 2011. DFO Can. Sci. Advis. Sec. Proceed. Ser. 2012/023.
DFO. 2012b. Revised reference points for snow crab to account for the change in estimation
area of the southern Gulf of St. Lawrence biological unit. DFO Can. Sci. Advis. Sec. Sci.
Advis. Rep. 2012/002.
DFO. 2014a. Assessment of snow crab in the southern Gulf of St. Lawrence (Areas 12, 19, 12E
and 12F) and advice for the 2014 fishery. DFO Can. Sci. Advis. Sec. Sci. Advis. Rep.
2014/008.
DFO. 2014b. Assessment of candidate harvest decision rules for compliance to the
Precautionary Approach framework for the snow crab fishery in the southern Gulf of St.
Lawrence. DFO Can. Sci. Advis. Sec. Sci. Advis. Rep. 2014/007.
DFO. 2020. Assessment of snow crab (Chionoecetes opilio) in the southern Gulf of St.
Lawrence (Areas 12, 19, 12E and 12F) to 2019 and advice for the 2020 fishery. DFO Can.
Sci. Advis. Rep. 2020/014.
Hébert, M., Surette, T., Landry, J.-F., and Moriyasu, M. 2021. Review of the 2019 snow crab
(Chionoecetes opilio) fishery in the southern Gulf of St. Lawrence (Areas 12, 19, 12E and
12F). DFO Can. Sci. Advis. Sec. Res. Doc. 2021/012. iv + 45 p.
Sainte-Marie, B., Gosselin, T., Sévigny, J.-M., and Urbani, N. 2008. The snow crab mating
system: opportunity for natural and unnatural selection in a changing environment. Bulletin
of Marine Science 83: 131-161.
Wade, E., Moriyasu, M., and Hébert, M. 2014. Methods and models used in the 2012
assessment of the snow crab (Chionoecetes opilio), stock in the southern Gulf of St-
Lawrence. DFO Can. Sci. Advis. Sec. Res. Doc. 2013/113.
19Snow Crab
Gulf Region Southern Gulf of St. Lawrence
THIS REPORT IS AVAILABLE FROM THE:
Center for Science Advice (CSA)
Gulf Region
Fisheries and Oceans Canada
P.O. Box 5030, Moncton (NB) E1C 9B6
Telephone: 506-851-6201
E-Mail: DFO.GLFCSA-CASGOLFE.MPO@dfo-mpo.gc.ca
Internet address: www.dfo-mpo.gc.ca/csas-sccs/
ISSN 1919-5087
ISBN 978-0-660-38945-5 Cat. No. Fs70-6/2021-021E-PDF
© Her Majesty the Queen in Right of Canada, 2021
Correct Citation for this Publication:
DFO. 2021. Assessment of snow crab (Chionoecetes opilio) in the southern Gulf of
St. Lawrence (Areas 12, 12E, 12F and 19) to 2020 and advice for the 2021 fishery. DFO
Can. Sci. Advis. Sec. Sci. Advis. Rep. 2021/021.
Aussi disponible en français :
MPO. 2021. Évaluation du crabe des neiges (Chionoecetes opilio) du sud du golfe du Saint-
Laurent (zones 12, 12E, 12F and 19) jusqu’en 2020 et avis pour la saison de pêche de
2021. Secr. can. de consult. sci. du MPO. Avis sci. 2021/021.
20You can also read