People in unassigned seating are struggling the most - Workplace effectiveness has declined - Gensler
←
→
Page content transcription
If your browser does not render page correctly, please read the page content below
U.S. WORKPLACE SURVEY 2020
 A PUBLICATION OF THE GENSLER RESEARCH INSTITUTE

Workplace
effectiveness
has declined.
People in
unassigned
seating
are struggling
the most.
Unassigned seating and other paradigm
                                                                                                                                                                    shifts are putting stress on the workplace.

                                                                                                                                                                    After more than 15 years of researching the connection   All this has resulted in rapid change and
                                                                                                                                                                    between workplace design and employee and business       experimentation in the workplace—and it’s taking
                                                                                                                                                                    performance, the positive impact of providing people     its toll on workers. In this period of flux, we need to
                                                                                                                                                                    with an optimal work environment is well proven.         pause and evaluate change, asking, “Are the shifts
                                                                                                                                                                    What makes a work environment optimal, however, is       transforming the workplace really delivering value?”
                                                                                                                                                                    far from static.
                                                                                                                                                                                                                             One trend in particular shows signs of stress: an
                                                                                                                                                                    Increasingly mobile and collaborative work,              increasing portion of the workforce is being asked
                                                                                                                                                                    experiments with unassigned seating and other            to work without dedicated seating. This may seem
                                                                                                                                                                    forms of mobility, globalization, and an always-on       like the logical next step as work becomes more
                                                                                                                                                                    culture are changing the nature of work and the          distributed and dynamic, but its implementation
                                                                                                                                                                    workplace. Evidence suggests that some of these          warrants further consideration.
                                                                                                                                                                    changes are for the better, while others are for
                                                                                                                                                                    the worse.                                               In line with the ongoing debate about open
                                                                                                                                                                                                                             environments, the right solutions for unassigned
                                                                                                                                                                    With real estate costs on the rise, companies            seating areas must consider the worker’s need
                                                                                                                                                                    require flexibility to accommodate rapid growth and      for private spaces and a sense of ownership, with
                                                                                                                                                                    fluctuating head counts. In this volatile economy,       attention to specific concerns such as cleanliness,
                                                                                                                                                                    workplaces are being asked to do more than ever          noise, ergonomics, and technology.
                                                                                                                                                                    before—often within a shrinking footprint.

                                                                  TABLE OF CONTENTS

1	Unassigned seating and other paradigm shifts    8	Is unassigned seating working?                  18		In an era of choice, the office is still people’s
   are putting stress on the workplace.                                                                    preferred place to work.
                                                  10		How do you fix unassigned seating?
2	The workplace is more complex than                                                                 20		To create an optimal workplace, understand
                                                  14		Fixing unassigned seating requires more than
   ever before.                                                                                            whatkindofworkplaceisrightforyourorganization.
                                                       just the right workplace.
4	Workplace effectiveness and experience                                                             22   APPENDIX
                                                  16		Out-of-office mobility is also a key
   have declined.
                                                       strategy to improve workplace effectiveness
6   What makes an optimal workplace?                   and experience.

                                                                                                                              The Collective, Seattle, Washington                                                                                                                      1
INTRODUCTION
+5%
2020
Theworkplace
The workplaceisismore more complex
complex than
than ever 2019 2020
before.
ever before.
Organizations
Workersare areleveraging mobility to
more mobile,
2016
improve flexibility, and
more distributed, real-time
morechange, and efficiency.
collaborative.
10% 67%
have jobs that require
are currently in them to work with
The extended economic expansion in the The recent coworking craze represents
unassigned seating colleagues in other
U.S. has propelled office rents to record shifts in the way people work as well as
locations
highs; and as the population continues the desire for flexibility that comes with
its shift toward cities, downtown rents uncertainty. The U.S. is at the front of
have shown particularly high growth. this trend; 20% of the global coworking
Uncertainty means that despite continued footprint is here, representing 10% of
growth, employers are positioning for office inventory in some markets, and our
headwinds. With a renewed focus on data suggests 1 in 5 U.S. workers uses a
maximizing their real estate utilization, coworking space during a typical week.
employers are also delivering a flexible Instances of unassigned seating, and
workplace that can easily accommodate broader mobility both in and out of the
rapid changes in head count or team office also appear to be on the rise. 2020 2020
configurations in real time. 2019 2019
+6%
20% 43%
of workers use work in a variety
a coworking space of spaces throughout
during an average the day
week +24%
3x 25% 3.6%
increase in unassigned increase in urban U.S. unemployment
seating by workers at large Class A U.S. office rate, the lowest 2020
companies in past 4 years rents 2010 to 2019 since 1970 2019 2020
2016
(Source: CBRE Econometric Advisors) (Source: American Time Use Survey as of February 2020)
60%
20% 24% 48%
have choice
in where to work
of workers spend
time working away
from the office during
of the global coworking of U.S. workers do an average week
footprint is located in some or all of their
the U.S. work at home
(Source: GCUC—Global Coworking) (Source: America Time Use Survey)
+3%
Percent of respondents who exhibit each characteristic.
2 U.S. Workplace Survey 2020 3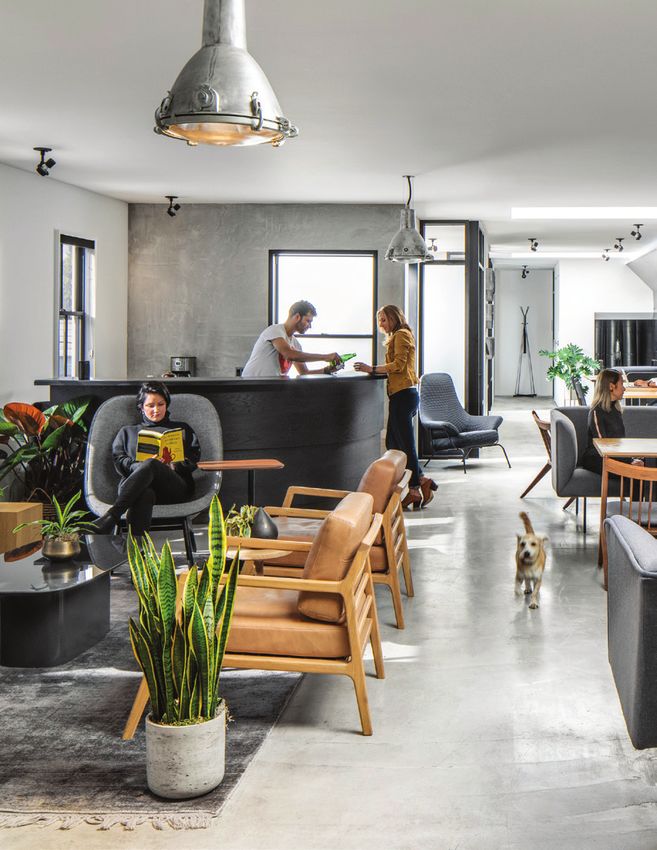
FINDINGS

    Workplace effectiveness and experience
    have declined, a consequence of continued                                                                                                                 Both workplace effectiveness and
    dramatic shifts in the way people work.                                                                                                                   experience have declined since our last
                                                                                                                                                              Workplace Survey.

    The effectiveness of the U.S. workplace    that many forms of mobility—the ability                                                                   WORKPLACE EFFECTIVENESS (WPI)                                WORKPLACE EXPERIENCE (EXI)
    is declining across all the work modes     to work away from the office for part
    Gensler tracks, with 2020 registering      of the week, then work in a variety of                                                                     2019
                                                                                                                                                          2020                                   66    70              2019                                 66
    the lowest effectiveness numbers we’ve     spaces in the office—are aligned with
    measured since beginning our Workplace     greater effectiveness. But overall, the                                                                    2020                                   66                    2020                               64
    Surveys in 2008.                           decline in performance suggests that
                                               increased mobility in aggregate has not                                                                   40                                                      80   40                                                         80
    This comes amid a growth in a wide range   yet improved employee effectiveness                                                                       Gensler’s Workplace Performance Index (WPI) score            Gensler’s Experience Index (EXI) score is a composite
    of mobility solutions. Our data suggests   or experience.                                                                                            is a composite measure of the effectiveness and              measure of the overall employee experience, capturing
                                                                                                                                                         functionality of the physical workplace based on 30+         broad cultural, behavioral, and interpersonal factors.
                                                                                                                                                         individual variables.

    WORK MODE EFFECTIVENESS

                                                         2008                                                                                     2013                                                    2016                                                   2019          2020
    4.4

                                 FOCUSING
    4.2
                                 COLLABORATING
                                 VIRTUALLY*
    4.0                          COLLABORATING
                                 IN PERSON
                                 LEARNING
    3.8                          SOCIALIZING

    3.6

    3.4
                                                                                                                                                                                      The workplace is becoming less effective
                                                                                                                                                                                      in supporting all work modes.
    3.2
                                                                                          The effectiveness of the workplace in supporting each
                                                                                          work mode by year, as measured on a 5-point scale
                                                                                          where 1 is least effective and 5 is most effective.
    3.0                                                                                  *We began measuring collaborating virtually separate
                                                                                           from in-person collaboration in 2016

4   U.S. Workplace Survey 2020                                                                                                                                                                                                                                                        5
FINDINGS
What makes an optimal workplace? WORKPLACE EFFECTIVENESS (WPI) WORKPLACE EXPERIENCE (EXI)
Mostly open environments with on-demand 11%
TOTALLY OPEN
No walls—everyone +/– 0 PTS + 2 PTS
private spaces consistently prove best. in the organization
sits together
All the various forms of mobility studied effective mobility and the mostly MOSTLY OPEN
in this research continue to play out on open workplace typology. We’ve asked With on-demand +4 PTS +7 PTS
the platform of the physical workplace— respondents for the workplace typology 15% private space; offices
and the design of that workplace has a where they work—and what their ideal only when required
significant impact on the performance, typology might be. Roughly 1 in 7 by role
experience, and behaviors of workers. workers currently sit in a mostly open
In our 2019 report, we identified six environment—and when asked about Despite being the best workplace solution, only
“degrees of openness” that bring their ideal workplace, they tend to prefer
nuance to the open-office debate— more private environments. However, 15% of our respondents are currently in mostly
and showed that mostly open when our data is segmented to show open environments, down from 26% in 2019.
environments, those that supplement how each typology performs, mostly
open seating with on-demand private open environments support more choice,
space, tend to perform best. provide a wide variety of spaces, and are
correlated with greater innovation and SOMEWHAT OPEN
Those relationships hold true in our effectiveness overall.
2020 data, and also show a link between 38% Few in private offices; –3 PTS –3 PTS
desks with low/medium
panels for privacy
CHOICE INNOVATION
SHARED OFFICES
3.9 10% Mostly shared offices/ –3 PTS –1 PTS
3.7 3.7 3.7 team rooms that sit
TOTALLY OPEN 60% 3.6 3.6
3 to 6 people
MOSTLY OPEN 62%
SOMEWHAT OPEN 37%
SHARED OFFICES 50% MOSTLY PRIVATE
MOSTLY PRIVATE 50% 19% Individual offices for +1 PTS –1 PTS
most; the rest have
TOTALLY PRIVATE 60% medium/high panels
TOTALLY MOSTLY SOMEWHAT SHARED MOSTLY TOTALLY
OPEN OPEN OPEN OFFICES PRIVATE PRIVATE
Percent of respondents with choice in where to work, by degree of openness. How innovative respondents see their company to be, based on Innovation TOTALLY PRIVATE
Index ratings, by degree of openness. All scores are on a 5-point scale.
7% An enclosed, individual work +2 PTS +2 PTS
environment for everyone
AVERAGE WPI SCORE 66 AVERAGE EXI SCORE 64
Percent of respondents who currently sit in each type of workplace
environment, compared to how each workplace type scores on
Gensler’s WPI and EXI scores.
6 U.S. Workplace Survey 2020 7
FINDINGS                                                                                                                                                        Gusto, San Francisco

    Is unassigned seating working?
    People without assigned seats are
    struggling, even those who like it.
    Unassigned seating is on the rise—our                 The reviews are mixed: many workers
    data shows 10% of the U.S. workforce                  in unassigned seating want their seat
    no longer has an assigned seat at work,               back, while many are happy with the
    doubling from 5% in 2019. While the                   scenario. Taken as a whole, our data
    idea of unassigned seating (also known                suggests unassigned seating has a
    as “hot desking,” “dynamic seating,”                  negative impact on performance and
    “hoteling,” etc.) isn’t new, its recent               experience—a challenge to a dominant
    growth in application is notable. The                 narrative centered around the increased
    larger portion of working population                  choice and freedom that should follow
    in unassigned seating now lets us                     suit. For the people who like unassigned
    look more deeply into the qualities                   seating, the negative impacts are
    of their experience at work, and begin                diminished. Those workers report slightly
    to understand the implications of                     lower performance, but a slightly better
    this trend for workplace effectiveness                experience than the average worker.
    and experience.

                                                             1 in 10 U.S. workers don’t
                                                             have an assigned seat.
                               90%
                           ASSIGNED

                                                                                                                                                                                      WORKPLACE EFFECTIVENESS (WPI)         WORKPLACE EXPERIENCE (EXI)

                                                                                                           LIKE HAVING AN
                      DO YOU HAVE                                                                          UNASSIGNED SEAT                                           50%               LIKE HAVING AN
                                                                                                                                                                                       UNASSIGNED SEAT            64
                                                                                                                                                                                                                             LIKE HAVING AN
                                                                                                                                                                                                                             UNASSIGNED SEAT           65
                    AN ASSIGNED SEAT                                      10%       UNASSIGNED
                        AT WORK?                                                                           WANT AN ASSIGNED
                                                                                                           SEAT BACK                                                 50%               WANT AN ASSIGNED
                                                                                                                                                                                       SEAT BACK          56
                                                                                                                                                                                                                            WANT AN ASSIGNED
                                                                                                                                                                                                                            SEAT BACK          58

                                                                                                                                                                                       ASSIGNED                        66    ASSIGNED                 64

                                                                                                                                                                                                  AVERAGE WPI SCORE    66         AVERAGE EXI SCORE   64

    The chart above shows 90% of workers have assigned seats and 10% have          have an assigned company location.These percentages are among workers
    unassigned seating. Of that 10%, 50% like having an unassigned seat, and 50%   who currently sit in unassigned seating, representing whether they prefer that
    want their seat back. Note that these percentages are among workers who        scenario or would rather have an assigned seat.
    have an assigned company location, excluding 5% of our sample who do not

8   U.S. Workplace Survey 2020                                                                                                                                                                                                                              9
FINDINGS
How do you fix unassigned seating?
The ability to focus is hardest hit; the most Most important design factors for unassigned seating:
important solution is privacy.
Ample private spaces,
Comparing data for workers in unassigned of time collaborating with others in
1 reservable and on-demand 5 Maintenance and cleanliness
seating to those with assigned seats, person may be the most apt to thrive
Spaces to support virtual
and those in top performing workplaces
overall, uncovers specific areas where
in unassigned seating. Those who need
significant amount of time to focus, 2 collaboration 6 Ergonomics and comfort
unassigned seating underperforms. This less so.
7
data suggests the fundamental challenges Enough work settings
that come with taking away someone’s
desk, as well as areas to focus on to
Providing the right suite of alternative
workspaces or amenities can make a
3 for everyone
Noise management
sizable impact—in particular, workers in
improve unassigned seating. Technology to support
The biggest difference: unassigned seating
unassigned seating struggle to find private
places to work, and places to take phone 4 Personal storage 8 group work
is a particular challenge to the ability calls. They also struggle with the basic
to focus and to work with colleagues issues that come with losing a desk—
virtually. And as a result, our data suggests storage, cleanliness, comfortable seating,
workers who spend a significant amount and overall noise.
Unassigned seating poses particular
ASSIGNED WANT AN LIKE HAVING AN
challenges to focused work and virtual ASSIGNED SEAT UNASSIGNED SEAT
collaboration. BACK
34%
Focusing Collaborating Collaborating Learning Socializing
30%
in person virtually 34%
4.7 4.7 4.7 4.6 FOCUSING
4.4 49%
4.1 Unassigned seating is more appropriate
3.9 3.9 3.9
for those whose work styles tend
3.5 3.4 3.3 3.3 3.3 toward in-person collaboration.
3.2
42%
51%
COLLABORATING 42%
IN PERSON
27%
COLLABORATING
VIRTUALLY 14% 10%
14%
15%
5%
5% 3%
AVERAGE TOP PERFORMING LEARNING 5%
ASSIGNED WORKPLACES SOCIALIZING 4% 5%
5% 6%
AVERAGE
UNASSIGNED
Work mode effectiveness scores for workers with assigned seats compared to Time spent in each work mode during an average week for workers with
those without assigned seats, and to workers in top performing workplaces as assigned seats compared to those without assigned seats but would prefer to
defined by the top quartile of WPI scores. All scores are on a 5-point scale. have a desk, and to those without assigned seats and are happy with it.
10 U.S. Workplace Survey 2020 11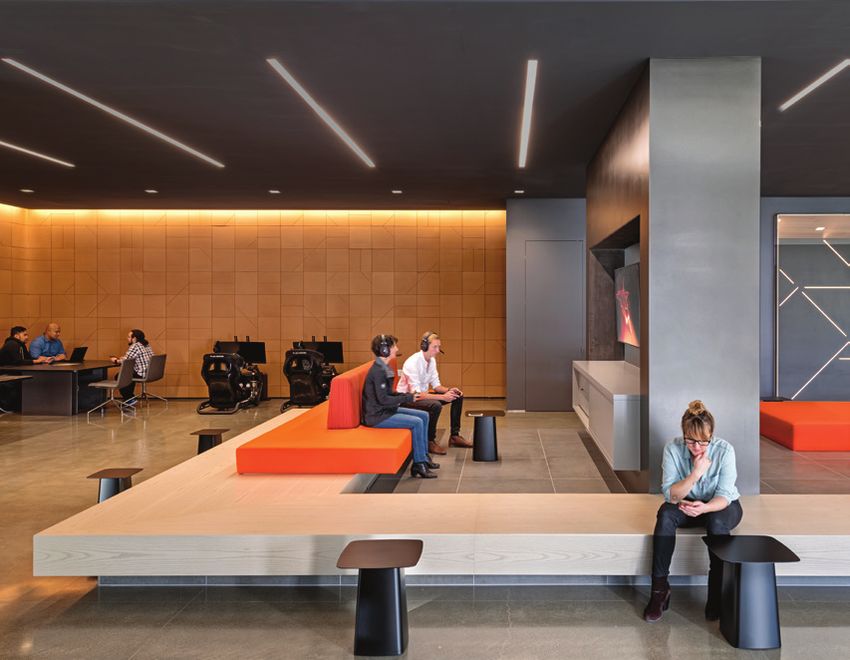
FINDINGS

     1
     Ample private spaces. The ability to
     find privacy is paramount for workers,
     even more so for those in unassigned
     seating. Having both reservable and
     on-demand space that is consistently
     available and within close proximity to
     workers is key.

     2
     Spaces to support virtual
     collaboration. Workers in unassigned
     seating struggle to find places to
     take calls and video conferences;
     provide a variety of places to            Confidential Consulting Firm                                     United Technologies Digital Accelerator, Brooklyn, N.Y.
     collaborate virtually with others, with
     considerations for both noise and
     technology.
                                                                                                                                                                     5
     3                                                                                                                                                               Maintenance and cleanliness.
                                                                                                                                                                     Sharing spaces, and the increased
     Enough work settings for everyone.                                                                                                                              utilization that comes with that
     Even if workers are highly mobile,                                                                                                                              sharing, makes maintenance and
     everyone should be able to be in the                                                                                                                            hygienic concerns even more
     office at once—and workers should                                                                                                                               important—ensure all work settings
     always be able to find the spaces they                                                                                                                          are sufficiently clean and ready
     need to perform their best.
                                                                                                                                                                     for work.

     4                                                                                                                                                               6
     Personal storage. Create convenient
                                                                                                                                                                     Ergonomics and comfort. As workers
     places to store personal belongings
                                                                                                                                                                     use a wider variety of spaces, ensuring
     and work-related materials for
                                                                                                                                                                     that all spaces are comfortable and
     all workers.                              CBRE, Houston, Texas                                                                                                  ergonomically appropriate for work
                                                                                                                                                                     helps optimize worker well-being and
                                                                                                               CBRE, Minneapolis, Minn
                                                                                                                                                                     performance.

                                                                                                                                                                     7
                                                                                                                                                                     Noise management. Provide a
                                                                                                                                                                     variety of spaces with varying noise
                                                                                                                                                                     levels to accommodate different work
                                                                                                                                                                     styles and behaviors; some should be
                                                                                                                                                                     energetic and accessible, others more
                                                                                                                                                                     quiet and private.

                                                                                                                                                                     8
                                                                                                                                                                     Technology to support group work.
                                                                                                                                                                     Equip spaces and empower
                                                                                                                                                                     workers with the right technology
                                                                                                                                                                     to collaborate virtually.

         NCR, Atlanta                                                         CBRE Headquarters, Los Angeles   Zendesk, 989 Market, San Francisco

12   U.S. Workplace Survey 2020                                                                                                                                                                                13
FINDINGS

     Fixing unassigned seating requires more than                                                                           What do U.S. workers think about unassigned seating?
     just the right workplace. Worker perception and
     participation are also a significant barrier.                                                                            Stressful                                                                                             65%

                                                                                                                              Confusing                                                                                             65%

     As unassigned seating grows in                they are no more likely to be in unassigned
     application, understanding how the            seating at this time. Across industries
                                                                                                                              Difficult                                                                                         62%
     general working population perceives the      studied, technology workers appear most
     trend is important to informing when, and     receptive, but on average only 1 in 4 see                                  Fun                                                              30%
     how, the strategy should be adopted. For      the strategy in a positive light.
     workers not currently sitting in unassigned                                                                              Productive                                                 24%
     seating, its perception is neutral to         Ultimately, any workplace transition’s
     negative—two-thirds of U.S. workers           success will lean not only on the
                                                   appropriateness of the strategy to workers’                                Efficient                                                  24%
     agree it sounds confusing and stressful,
     while less than a quarter think it sounds     needs, and organizational culture and
     productive or efficient.                      processes, but also on how the change is                                 For workers not currently in unassigned seating, the percent who agree with
                                                   communicated and managed. Similar to                                     each of the above statements about unassigned seating.
     However, perceptions around unassigned        broader discussions around open working
     seating are not universal. By role, those     environments, a key barrier to adoption is
     in more senior positions are more likely      negative perception—that sentiment must
     than other workers to express positive        be addressed for any strategy to succeed.
     impressions of unassigned seating, though

                                                                                                                            ROLE
     SentryOne, Charlotte, N.C.
                                                                                                                             MANAGEMENT                               17%                  45%                                                  38%
                                                                                         Workers in more senior positions                                                   RECEPTIVE            NEUTRAL                                              NOT RECEPTIVE

                                                                                         have higher receptivity to          PROFESSIONAL/TECHNICAL STAFF             11%          27%                              62%
                                                                                         unassigned seating.                 ADMINISTRATIVE                           11%          29%                                60%

                                                                                                                            INDUSTRY

                                                                                                                             TECHNOLOGY                               27%   RECEPTIVE                     40%   NEUTRAL                               33%   NOT RECEPTIVE

                                                                                                                             CONSUMER GOODS/RETAIL                    20%                      34%                                        46%
                                   Those working in legal, government,
                                   defense, or energy industries may be least                                                MANAGEMENT ADVISORY                      20%                      38%                                          42%

                                   receptive to unassigned seating.                                                          FINANCIAL/INSURANCE                      18%                  34%                                        48%

                                                                                                                             SCIENCES                                 10%          34%                                        56%

                                                                                                                             MEDIA                                    10%          59%                                                                 31%

                                                                                                                             NOT-FOR-PROFIT                           10%         30%                                   60%

                                                                                                                             ENERGY                                   9%         32%                                      59%

                                                                                                                             GOVERNMENT/DEFENSE                       9%         27%                               64%

                                                                                                                             LEGAL                                    7%       28%                                65%

                                                                                                                            Receptivity to unassigned seating by role and by industry.

14   U.S. Workplace Survey 2020                                                                                                                                                                                                                                             15
FINDINGS
Out-of-office mobility is also a key TIME SPENT IN THE OFFICE
strategy to improve workplace 5 DAYS
50%
effectiveness and experience.
4 DAYS
23%
People still spend the majority of their far from universal. Overall, mobile workers
working time in the office—and that time, tend to have higher effectiveness (WPI)
and the quality of that environment, and experience (EXI) scores. These workers
are directly associated with higher are also the most engaged. Mobility may
performance. Interestingly, the ability to put pressure on how teams collaborate, but
work away from the office for a portion those who are most mobile are also highly
of one’s workweek also shows positive likely to have an awareness of what their
benefits—effectiveness outside the office colleagues are working on.
LESS THAN 3 DAYS
brings effectiveness back to the office too.
Increased mobility may have a greater 17%
While broad measures of autonomy and impact on those in more senior positions
mobility—like having choice in where compared to professional, technical, and
to work during an average day—are administrative workers. The relationship
unequivocally associated with higher of mobility to performance varies by the
performance, the right amount of time nature of the individual’s work.
3 DAYS
working in versus away from the office is
10%
WORKPLACE EFFECTIVENESS (WPI) WORKPLACE EXPERIENCE (EXI) Half of the workforce spend at least
one day per week away from their
MANAGEMENT
primary office.
LESS THAN 3 DAYS 81 82
Percent of respondents within each mobility profile.
3 DAYS 70 70
4 DAYS 67 66
5 DAYS 66 63
40 90 40 90
PROFESSIONAL/TECHNICAL
Innovation Job satisfaction
LESS THAN 3 DAYS 61 61
For professional/technical workers, time 4.4
3 DAYS 61 61
spent in the office doesn’t have as large an 4.2
4 DAYS 62 60
impact on effectiveness and experience. 3.7
5 DAYS 60 57 3.5
40 90 40 90
ADMINISTRATIVE/SUPPORT STAFF 5 DAYS LESS THAN 5 DAYS LESS THAN
3 DAYS 3 DAYS
LESS THAN 3 DAYS 60 58 Administrative and support staff shows
3 DAYS 66 66 the best effectiveness and experience
4 DAYS 63 62 when working three days in the office
5 DAYS 60 57
during an average week.
40 90 40 90
Innovation is measured by the Innovation Index, a composite score
Percent of respondents within each mobility profile, of how innovative an employee sees their company to be. Job
top performers compared to average. satisfaction is measured on a 5-point agreement scale.
16 U.S. Workplace Survey 2020 17FINDINGS
In an era of choice, the office is still
people’s preferred place to work, but
only if it’s designed to support their work.
The more choices people have in where above all other places. For those whose
to work, the more important it is to workplaces aren’t performing, they would
understand their preferred work settings. rather work from home.
We asked respondents a simple question—
where would you prefer to work among The additional benefits of high-
four options: a coffee shop, a coworking performance workplace environments
space, your home, or your company’s are myriad and well-proven by both this
workplace? The workplace and people’s and prior Gensler Workplace Surveys.
homes consistently outrank the other Employees in high-performing workplaces
choices, but another interesting insight rate their company in a more positive
also emerged. When we segment our light, are more empowered to experiment
data between those with the highest and with new ways of working, are more aware
lowest WPI scores, we found that the of the impact of their work and what their
workers with the highest WPI scores— colleagues are working on. They’re also
those with the best performing, best more engaged, more satisfied with their
designed workspaces—prefer working jobs, and more likely to recommend their
from their company’s office location company as a place to work.
Confidential Tech Client, Santa Clara, Calif.
My company is I am empowered to I am aware of Job Likelihood to
PREFERRED PLACE TO WORK, PEOPLE IN PREFERRED PLACE TO WORK, PEOPLE IN considered a leader experiment with new what other teams satisfaction recommend company
LOWEST-PERFORMING WORKPLACES HIGHEST-PERFORMING WORKPLACES in its industry ways of working in my company
are working on 4.6 4.6
4.5
1 Home My company’s workplace 4.2 4.2
2 My company’s workplace Home
3.4
3 Coworking Coworking 3.0 3.1 3.0
LOWEST HIGHEST
WPI WPI 2.7
4 Coffee shop Coffee shop
Respondent rankings of their preferred place to work, lowest performing Measures of employee engagement and performance, lowest performing workplaces
workplaces vs. highest as measured by WPI score. vs. highest as measured by the WPI score. All scores are on a 5-point scale.
18 U.S. Workplace Survey 2020 19CONCLUSION
To create an optimal workplace,
understand what kind of workplace is
right for your organization.
Create a workplace strategy with the granularity Be careful with unassigned seating—making it
and flexibility to support different worker needs. work requires extra attention, and often a wider
The complexity, dynamism, and rapid change of work variety of alternative work spaces. The general
mean the response time of the work environment is sentiment among workers: unassigned seating sounds
narrowing. As new forms of mobility—both in and stressful and confusing. Half of people currently
away from the office—continue to enter the workplace without assigned spaces would prefer to keep it that
ecosystem, continually measuring what does work, way; the other half would want an assigned seat back.
as well as what doesn’t, is imperative. Responses on Don’t underestimate the importance of consistency
the part of employers and those managing real estate and ownership provided by one’s desk, and weigh the
need to be just as fast as the impact of change on space-saving and collaborative benefits of unassigned
workers. When the impact of a shift appears negative, seating against the potential negative impacts on
that doesn’t mean reverting back to old modes of performance, experience, and individual work. And if
work—but it also doesn’t mean expecting workers to you do implement unassigned seating, make sure to
eventually adapt and fall in line. focus on design strategies that address the increased
need for on-demand privacy, and the acute issues of
cleanliness, storage, and ergonomics.
20 U.S. Workplace Survey 2020 Etsy, Brooklyn, N.Y. 21APPENDIX | RESEARCH HISTORY
History
Gensler’s U.S. Workplace Survey 2020 is relates to employee effectiveness,
the latest iteration of ongoing research on business performance, and innovation.
the workplace, which began in 2005.
A subsequent survey in 2006 established This report represents the integration
the connections between workplace of our historic workplace surveys with Gensler 2013 U.S. Workplace Survey / Key Findings 3
design,
2
employee productivity, and
Gensler 2013 U.S. Workplace Survey / Key Findings recent insights into the nature of Gensler 2013 U.S. Workplace Survey / Key Findings 3
Gensler 2013 U.S. Workplace Survey / Key Findings 3
business competitiveness. In 2008, experience, drawing from the 2017
our research established a framework Gensler Experience Index. These
for understanding knowledge work questions, in addition to existing
HISTORY OF GENSLER
WORKPLACE
through the lensRESEARCHof the four “work workplace survey questions, allow for
modes”—focus, collaborate, learn, direct comparison with data collected
ing research Gensler’s
Gensler’s2013
and
2013survey
socialize.
U.S. Workplace
We
is the latest
Survey
discovered
iteration
continues
of ongoing
that
this thread
research through
Gensler’s past
2013 U.S. research
Workplace efforts,
Survey continues thisas well
thread
r’s first on
bythe
taking
workplace,
the pulsewhich
of the
began
American
in 2005workplace as it the
with Gensler’s relates
first to by taking the pulse of the American workplace as it relates to
ablished the effectiveness
workplace
employeesurvey. A and
effectiveness, support
subsequent
businesssurvey inof allestablished
performance,
2006 four
and work
opportunities
the as parallel
employee surveys
effectiveness, business conducted
performance, and around
opportunities
productivity, connections
to create a culture
between of workplace
innovation.design,
Parallelemployee
questionsproductivity,
allow for to the
create globe ininnovation.
a culture of the UK, Middle
Parallel East,
questions Asia,
allow for
h established modes
and
direct
business connect
comparison withtodataemployee
competitiveness. collected
In 2008, throughengagement
our research
Gensler’s
established
2008 direct comparison with data collected through Gensler’s 2008
ough the
and company
asurvey.
framework This for
performance.
putsunderstanding
our findings inknowledge
the contextwork
of fundamental
through the work Germany,
survey. This puts ourand Latin
findings in the America. This work
context of fundamental
arn, and
support
lens
andof lifethe
socialize.
fourover
shifts
realign today’s
“work
We discovered
workplace
modes,”
that
that
with
focus,and
time period
thetoday’s
collaborate,
effectiveness
points tolearn,
world. and support
and to
solutions
puts our findings in the context of
and life shifts over that time period and points to solutions to
realign today’s workplace with today’s world.
ment and Gensler’s
of all four work2013
modesand 2016
connect U.S. engagement
to employee Workplaceand fundamental work and life shifts over
company performance.
Surveys continued these efforts, taking that time period.
the pulse of the American workplace as it
22squared, Atlanta, GA
22squared, Atlanta, GA
22squared, Atlanta, GA
2005 2006 2008
GENSLER’S
UK WORKPLACE SURVEY
WORKPLACE U.S. WORKPLACE SURVEY U.S. & UK WORKPLACE SURVEYS 2013
RESEARCH
Employees see a clear link between The link is confirmed between the physical Our survey established the four work modes U.S. WORKPLACE SURVEY
the physical work environment and work environment and productivity in the and confirmed a link between workplace and Focus, balance, and choice in the workplace
personal productivity. minds of workers. business performance. emerge as key drivers of satisfaction,
performance, and innovation.
2008 2012 2013
2005 2006 2005 2006 U.S. + U.K.2008 What we’ve learned about
2012 U.S. Workplace
2013 Survey
U.K. Workplace Survey U.S. Workplace Survey U.K. Workplace Survey U.S. Workplace Survey WorkplaceU.S. Surveys
+ U.K. 2008 focus in the workplace.
What we’ve2012
learned about 2013 Survey
U.S. Workplace
U.S. + U.K.
Workplace Surveys focus in theWhat we’ve learned about
workplace. U.S. Workplace Survey
KEY FINDINGS: Workplace Surveys KEY FINDINGS: focus in the workplace.
KEY FINDINGS:
KEY FINDINGS: KEY FINDINGS: KEY FINDINGS: KEY FINDINGS: KEY FINDINGS: KEY FINDINGS: KEY FINDINGS:
Four work modes—focus, KEY FINDINGS: Analysis of Gensler’s Workplace KEY FINDINGS: Focus, balance, and choice KEY FINDINGS:
Employees see a clear link The link is confirmed between Employees see a clear link The link is confirmed between collaborate, learn,
Four and
worksocialize—
modes—focus, Performance Index (WPI)
Analysis databaseWorkplace in the workplace
of Gensler’s emerge
Focus, as and choice
balance,
between the physical work
ASIA WORKPLACE
environment and personal
the physical work environment between the physical work
and productivity in the minds environment and personal
the physical work environment
U.K. WORKPLACE
and productivity in the minds
GERMANY
emerge as thecollaborate,
framework learn,
which to understand time
emergeSURVEYas the
U.S.
through
Four
at the
and
work
2019 framework
socialize—
modes—focus,
collaborate,through
learn, and socialize—
uncovers thatPerformance
the effectiveness
of space for focus is a key
Index
driver
uncovers that the
(WPI)ofdatabase
Analysis
effectiveness
Performance
key drivers of satisfaction,
Gensler’s Workplace in the workplaceFocus,
performance,
Index (WPI) database
and innovation.
emerge
MIDDLE as EAST
balance,
in WORKPLACE
key drivers of satisfaction,
and choice
the workplace emerge as
61%
of local workers have a
private office; only 39% of
expat workers have one.
SURVEY 2016 of LATIN AMERICA
WORKPLACE
office. Employees at to
top-performing
WORKPLACE of the effectiveness of for
other work SURVEY
U.S. WORKPLACE
productivity. They also report of workers. Management-level productivity. They also report SURVEY
workers.2016
Management-level which
companies value work
understand
SURVEY emerge
modes more
time at the
as the framework through 52%
of workers would prefer an
of space
modes and workplace
focus is a keythat
uncovers
performance
driver
the effectiveness performance, and key innovation.
drivers of satisfaction,
2020
WORKPLACE
open environment as long as
the work environment as very respondents note workplace the work environment as very respondents note workplace office. Employees at top-performing of the effectiveness of other workis a key driver
SURVEY 2016 which to understand time at the of space for focus performance, and innovation.
private spaces are available.
2019
48%
2016 2017 2019 2020
of workers currently sit in
highly and have spaces that more as a whole. modes and workplace performance
shared offices of 2–6 people.
important to job satisfaction. has a positive effect on the important to job satisfaction. has a positive effect on the companies value workVery
office. modes
few
Employeesmore
people
at top-performing of the effectiveness of other work
bottom line and company
SURVEY 2017
bottom line and company effectively support
highlyeach
37%
one. spaces that more
andsay
have
of workers have to work in the
companies as a whole.
their idealvalue work modes more
workplace modes and workplace performance
same space most of the time.
51%
KEY FINDINGS | EXTENDED REPORT of the average Middle East
competitiveness. competitiveness. effectively support each one.
workers’ week is spent in the
highly is“totally open”that more
and have spaces as a whole.
México DF
office; locals spend even less,
only 40%.
U.S. & ASIA WORKPLACE SURVEY San José
Medellín
UK & LATIN AMERICA WORKPLACE SURVEYS effectively support each one.
Quiet zones in offices U.S. & GERMANY WORKPLACE SURVEYS MIDDLE EAST WORKPLACE SURVEY
Findings connect workplace design directly Additional global surveys uncover global have significantly higher Research integrates new questions focused on Data uncovers significant differences in the
Bogotá
impact than break rooms
to organizational innovation and an Lima
differences in social behavior, and problems One in seven corporate well-being and experience, and challenges the workplace experience of expats compared
employees use coworking
“innovation ecosystem.” Rio de Janeiro
São Paulo
with workplace equity. during an average week open/closed office debate. to locals.
Santiago
Buenos
Aires
74%
of employees at the most
I innovative companies work
away from their primary
workspace regularly.
22 U.S. Workplace Survey 2020 23APPENDIX | GLOBAL COMPARISONS
The U.S. workplace is falling
behind its global peers.
The decline in performance for U.S. WORKPLACE EFFECTIVENESS (WPI) WORKPLACE EXPERIENCE (EXI)
workplaces represents a marked shift—
workplace performance lags behind recent MIDDLE EAST 2020 70 U.S. 2020 64
data collected in other global markets. As
a market that often acts as the bellwether
LATIN AMERICA 2017 69 GERMANY 2019 59
for global trends, this shift in performance
is worth noting. JAPAN
UK 2016 67 2020 47
While the dynamism of today’s workplace
40 80
makes it hard to attribute this shift to any
U.S. 2020 66
one factor, the various forms of mobility
studied in this report are likely at play. In
particular, a rise in unassigned seating and GERMANY 2019 65
continued challenges of open environments
may explain lower performance. JAPAN 2020 54
40 80
24% 27%
INDIVIDUAL OFFICE
38% 37%
LATIN
GERMANY JAPAN U.S. U.S.
OPEN PLAN AMERICA 41% MIDDLE EAST
2019 2020 2020 2020 2017 2020
42%
11%
18%
SHARED OFFICE OF 2
8% GROUP OFFICE OF 3–6
24% 18%
58% 55% 48% 12%
6%
21% 4%
26%
26% 15%
MIDDLE LATIN
AMERICA UK UK GERMANY JAPAN
EAST 2020 2016 12% 2016 2019 2020
2017
50%
17% 24% 24%
75%
42% 33% 30%
U.S. WORKERS ARE ONLY AVERAGE ON CHOICE SHARED OFFICES ARE UNCOMMON IN THE U.S.
By global region, percentage of workers who report they have choice in Type of individual work setting employees have, by global region. Data is
where to work. Data is from most recent Workplace Survey in each country, from most recent Workplace Survey in each country, conducted between
conducted between 2019 and 2020. 2016 and 2020.
24 U.S. Workplace Survey 2020 25APPENDIX | RESEARCH METHODS APPENDIX | THE WPIx
Methods Applied Research Tools: the WPIx SM
400,000+
This survey represents data collected Survey questions included those from Gensler’s Workplace Performance Index to measure the success of the design
via an online survey conducted among Gensler’s WPI and EXI alongside additional (WPIx) is a proprietary, web-enabled solution. By using a core set of parallel
5,000+ anonymous, panel-based questions that asked respondents to rate survey tool designed to measure the questions, individual projects can then
respondents representing a broad cross their workspaces and companies across performance of an individual workplace or be directly benchmarked against the client respondents
section of demographics, including a variety of factors, including innovation, portfolio for our clients. The tool is used results of national surveys to put project
education, age, gender, and geographical motivation, choice, and technology, as well for both pre- and post-occupancy analysis work into a context of broader knowledge
50+ 11
location. Respondents do not work for as individual patterns of behavior to allow for comparisons and to document and trends in workplace design.
Gensler, are not necessarily working for and preferences. improvements in workplace effectiveness.
Gensler clients or in Gensler-designed At the beginning of a project, the WPIx WPI surveys are conducted as a part
spaces, and were recruited via a third- The Gensler Research Institute team is used to gather employee input on of direct client engagements. The
employed inferential statistics techniques, results of WPI surveys are collected in
countries languages
party panel provider. how they work, space effectiveness, and
such as multiple linear regression, workplace experience factors to inform a separate database from Workplace
Respondents were required to be full- bivariate correlation, and analysis of design decisions. Survey responses. The WPI database
time knowledge workers who work in an variance (ANOVA), as well as descriptive now has over 400,000 survey responses
office some or all of the time, and work for statistics, to derive these findings. For all Post-occupancy, typically 3 to 6 months from employees of Gensler clients.
companies with more than 100 employees inferential statistical tests, the Institute after move-in, employees are surveyed
within 10 designated industry segments. team utilized a p-value cutoff of 0.005.
WORKPLACE EXPERIENCE FRAMEWORK
LEGAL FINANCE
9% 10%
NOT-FOR-PROFIT
10% MANAGEMENT/
ADVISORY
10% MALE
36% CULTURE
ENERGY MISSION & INSPIRATION
10% INDUSTRY TECHNOLOGY GENDER
10%
EMPOWERMENT & AWARENESS
GOVERNMENT/ CREATIVITY & INNOVATION
CONSUMER GOODS DEFENSE
11% 11% FEMALE
64%
SCIENCES MEDIA
10% 9%
SPACE INTERACTION
FUNCTIONALITY & EFFECTIVENESS SOCIAL CONNECTION
GEN Z EXECUTIVE
BABY BOOMER 2% VARIETY & CHOICE TECHNOLOGY & TOOLS
ADMIN 10%
19% 21% AESTHETICS AUTONOMY
MILLENNIAL
GENERATION
43%
ROLE BEHAVIOR
MANAGEMENT
35% REFLECTION & EXPERIMENTATION
WORKING AWAY FROM THE DESK
GEN X PROF/TECH
34% WORK MODES
36%
26 U.S. Workplace Survey 2020 27Bibliography
CBRE. (2019). “Q3 2019 U.S. Flexible Office IDC. (2018). “Global Spending on Mobility McLaurin, J.P. (2018). “The Open Office Isn’t
Figures.” Retrieved from https://www.cbre. Solutions Forecast to Reach $1.8 Trillion Dead.” Gensler. Retrieved from http://www.
us/research-and-reports/US-Flexible-Office- in 2022, According to New IDC Spending gensleron.com/work/2018/7/26/the-open-
Figures-Q3-2019 Guide.” https://www.idc.com/getdoc. office-isnt-dead.html
jsp?containerId=prUS44259318
CBRE Econometric Advisors. (2020). Retrieved U.S. Bureau of Labor Statistics. (2020). “Labor
from https://www.cbre-ea.com/ Pew Research Center. (2018). “Millennials are Force Statistics from the Current Population
the largest generation in the U.S. labor force.” Survey.” Retrieved from https://www.bls.gov/
Gallup. (2020). “Is Working Remotely Effective? Retrieved from https://www.pewresearch. cps/
Gallup Research Says Yes.” Retrieved from org/fact-tank/2018/04/11/millennials-largest-
https://www.gallup.com/workplace/283985/ generation-us-labor-force/
working-remotely-effective-gallup-research-
says-yes.aspx JLL. (2019). “Coworking’s unstoppable market
growth.” Retrieved from https://www.us.jll.
GCUC. (2018). “2018 global coworking forecast: com/en/coworking-market-growth
30,432 spaces and 5.1 million members by
2022.” Retrieved from https://gcuc.co/2018- JLL. (2019). “United States office outlook – Q4
global-coworking-forecast-30432-spaces-5-1- 2019.” Retrieved from https://www.us.jll.com/
million-members-2022/ en/trends-and-insights/research/office-market-
statistics-trends
Photo Credits
Cover Jasper Sanidad
C2 Gensler/Heywood Chan
9 Rafael Gamo
12 Nicole England (top), Gensler/Ryan Gobuty (middle), Garret Rowland (bottom), Benny Chan (right)
13 Garrett Rowland (top), Jasper Sanidad (middle), Jason O’Rear (bottom)
14 Connie Zhou
19 Jasper Sanidad
21 Garrett Rowland
C3 Jason O’Rear
Team Oversight Analytics Team Editorial Team Design Team
Diane Hoskins Michelle DeCurtis Tim Pittman Laura Latham
Janet Pogue Isabel Kraut Kyle Sellers Minjung Lee
Christine Barber Justin Chase
Jerde Analytics
© 2020 Gensler.
The information contained within this document is and shall remain the property of Gensler.
This document may not be reproduced without prior consent from Gensler.
www.gensler.com/research
Brex, San Francisco
28 U.S. Workplace Survey 2020gensler.com/research
A publication of the Gensler Research Institute
The Gensler Research Institute is a collaborative combination of global and local research grants,
network of researchers focused on a common goal: and external partnerships, we seek insights focused
to generate new knowledge and develop a deeper on solving the world’s most pressing challenges.
understanding of the connection between design, We are committed to unlocking new solutions and
business, and the human experience. Through a strategies that will define the future of design.
4 U.S. Workplace Survey 2020You can also read