Quantifying the Speed of Chromatophore Activity at the Single-Organ Level in Response to a Visual Startle Stimulus in Living, Intact Squid - Frontiers
←
→
Page content transcription
If your browser does not render page correctly, please read the page content below
BRIEF RESEARCH REPORT
                                                                                                                                                 published: 18 June 2021
                                                                                                                                        doi: 10.3389/fphys.2021.675252

                                                Quantifying the Speed of
                                                Chromatophore Activity at the
                                                Single-Organ Level in Response to a
                                                Visual Startle Stimulus in Living,
                                                Intact Squid
                                                Stavros P. Hadjisolomou 1* , Rita W. El-Haddad 1 , Kamil Kloskowski 2 , Alla Chavarga 2 and
                                                Israel Abramov 2
                                                1
                                                 Department of Social and Behavioral Sciences, College of Arts and Sciences, American University of Kuwait, Salmiya,
                                                Kuwait, 2 Department of Psychology, Brooklyn College, City University of New York, Brooklyn, NY, United States

                           Edited by:
                                                The speed of adaptive body patterning in coleoid cephalopods is unmatched in
                       Daniel Osorio,           the natural world. While the literature frequently reports their remarkable ability to
University of Sussex, United Kingdom
                                                change coloration significantly faster than other species, there is limited research
                       Reviewed by:
                                                on the temporal dynamics of rapid chromatophore coordination underlying body
                  Pamela Imperadore,
 Zoological Station Anton Dohrn, Italy          patterning in living, intact animals. In this exploratory pilot study, we aimed to
                     Cecile Bellanger,          measure chromatophore activity in response to a light flash stimulus in seven squid,
      Université de Caen Normandie,
                              France
                                                Doryteuthis pealeii. We video-recorded the head/arms, mantle, and fin when squid
                   *Correspondence:
                                                were presented with a light flash startle stimulus. Individual chromatophores were
              Stavros P. Hadjisolomou           detected and tracked over time using image analysis. We assessed baseline and
            shadjisolomou@gmail.com
                                                response chromatophore surface area parameters before and after flash stimulation,
                   Specialty section:
                                                respectively. Using change-point analysis, we identified 4,065 chromatophores from 185
         This article was submitted to          trials with significant surface area changes elicited by the flash stimulus. We defined
              Invertebrate Physiology,
                                                the temporal dynamics of chromatophore activity to flash stimulation as the latency,
               a section of the journal
                Frontiers in Physiology         duration, and magnitude of surface area changes (expansion or retraction) following
           Received: 02 March 2021              the flash presentation. Post stimulation, the response’s mean latency was at 50 ms
            Accepted: 27 May 2021               (± 16.67 ms), for expansion and retraction, across all body regions. The response
           Published: 18 June 2021
                                                duration ranged from 217 ms (fin, retraction) to 384 ms (heads/arms, expansion).
                               Citation:
     Hadjisolomou SP, El-Haddad RW,
                                                While chromatophore expansions had a mean surface area increase of 155.06%,
       Kloskowski K, Chavarga A and             the retractions only caused a mean reduction of 40.46%. Collectively, the methods
          Abramov I (2021) Quantifying
                                                and results described contribute to our understanding of how cephalopods can
 the Speed of Chromatophore Activity
             at the Single-Organ Level          employ thousands of chromatophore organs in milliseconds to achieve rapid, dynamic
        in Response to a Visual Startle         body patterning.
       Stimulus in Living, Intact Squid.
            Front. Physiol. 12:675252.          Keywords: cephalopod, chromatophore, camouflage, communication, body pattern, startle response, light flash
     doi: 10.3389/fphys.2021.675252             stimulation, temporal dynamics

Frontiers in Physiology | www.frontiersin.org                                         1                                           June 2021 | Volume 12 | Article 675252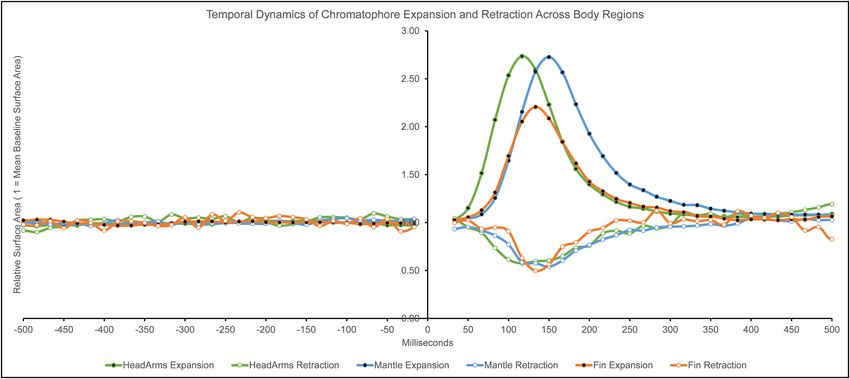
Hadjisolomou et al.                                                                                          Quantifying Speed of Chromatophore Activity

INTRODUCTION                                                              exploratory pilot study, we aim at replicating the sub-jet-
                                                                          threshold behavioral responses to flash stimulation with a
Unlike the slower chromatophore control of flatfish (2–8 s;               different species, Doryteuthis pealeii (Lesueur, 1821), to examine
Ramachandran et al., 1996), coleoid cephalopods can change                the mechanisms and temporal dynamics of the sensorimotor
body patterns in milliseconds. For decades, scientists in                 system underlying chromatophore control in intact animals
the field of cephalopod vision have focused on the goal                   (Hadjisolomou, 2017). Due to ethical and logistical issues
of creating a complete characterization of the sophisticated              involved with long-distance transportation of D. opalescens for
coleoid body patterning abilities. As a result, existing reports          experimentation, D. pealeii was chosen as this species is available
are sufficient to describe and explain several known body                 to be studied in Woods Hole, Massachusetts.
patterns in cephalopods for camouflage and communication                     Further, in addition to the mantle, we expanded observations
(Hanlon and Messenger, 1988; Hanlon, 2007; Langridge et al.,              to include chromatophore activity from the understudied
2007; Zylinski et al., 2009; How et al., 2017). Nevertheless, a           regions of the arms, head, and dorsal fin (Figure 1). Young
theoretical framework on cephalopod body patterning, which                (1976) reported on the CNS control of chromatophores in
does not include the dimension of time, will be inherently                D. pealeii, elaborating that separate chromatophore lobes in the
inadequate in modeling, holistically, the range of dynamic,               brain control different body regions. Specifically, the posterior
rapid transformations observed in animals living in the wild.             chromatophore lobes (PCL) mainly control chromatophores
One approach toward studying this topic is by stimulating                 on the mantle and fin regions, while chromatophores on
the visual system of a living, intact animal, using a light               the arms and head are primarily controlled by the anterior
flash to elicit muscular activation of chromatophores, and                chromatophore lobes (ACL) and pedal lobes (PL). Axons
quantifying the response dynamics by tracking surface area                from the PCL connect without a synapse to chromatophore
changes in time.                                                          organs through the pallial nerve. Electrode stimulation of
    Experiments conducted in the Gilly laboratory revealed                PCL neurons in Lolliguncula brevis (Blainville, 1823) causes
how light flashes elicit startle jet-escape responses in squid,           chromatophore expansion on the mantle and fin (Dubas
Doryteuthis opalescens (Berry, 1911). The brief, intense light            et al., 1986), but it did not result in retraction of any
stimulus activates the central nervous system (CNS) at the                expanded chromatophores. Both species are part of the same
magnocellular and palliovisceral lobes, which relay information           family, Loliginidae (Lesueur, 1821), and have anatomical
to the stellate ganglia to modulate forceful muscle contractions          similarities (Díaz-Santana-Iturrios et al., 2019), thus allowing for
of the mantle expelling water through the funnel in the                   approximations between them. We chose these body regions to
process (Otis and Gilly, 1990; Gilly et al., 1991; Gilly and              observe any discrepancies in timed responses due to circuitry
Lucero, 1992; Neumeister et al., 2000; Preuss and Gilly,                  differences. By video-recording all body regions in intact, living
2000). Within the stellar nerve, a group of non-giant motor               squid, we quantified the temporal dynamics from light flash
axons innervates chromatophore muscles (Ferguson et al.,                  stimulation to expansions and retractions at the single-organ
1988). In one of these studies (Neumeister et al., 2000),                 level across thousands of chromatophores. Similar to the Reiter
which investigated the effects of temperature on escape                   et al. (2018) study, which used unrestrained European cuttlefish
responses in restrained squid, the flash stimulus produced                (Linnaeus, 1758), we measured chromatophore activity from
transient chromatophore expansions. Responding to the light
flash startle stimulus, animals exhibited a robust jet-escape
startle response with transient chromatophore expansions.
However, when light intensity was decreased by “positioning
the flash unit further from the squid” (Neumeister et al.,
2000, p. 551), the animal showed chromatophore expansions
as sub-jet-threshold startle responses (in the absence of jetting).
Squid are a useful species for studying chromatophores
because they have fewer and larger chromatophore organs
(density: 8 mm−2 , maximum diameter: 120–1,520 µm; Hanlon,
1982) compared to octopus (density: 230 mm−2 ; maximum
diameter: 300 µm; Packard and Sanders, 1971) and Sepia
(density: 35–50 mm−2 ; maximum diameter: 300 µm; Hanlon
and Messenger, 1988), offering a simpler model to study
chromatophore control.
    The Neumeister et al. (2000) study validates a reliable
method of using flash stimulation and video-recording the skin,
from a close-up perspective, to investigate the synchronicity
of chromatophore activity at the single-organ level in squid.              FIGURE 1 | D. pealeii (mantle length approximately 14 cm) expressing
                                                                           disruptive body patterning with some chromatophores expanded (dark
Since studying chromatophore response dynamics across all
                                                                           bands), while others are retracted. Numbers indicate the different body
body regions was not the study’s primary focus, chromatophore              regions measured in the study: 1 = head/arms, 2 = mantle, and 3 = fin.
expansions only on the mantle were reported. For this

Frontiers in Physiology | www.frontiersin.org                         2                                            June 2021 | Volume 12 | Article 675252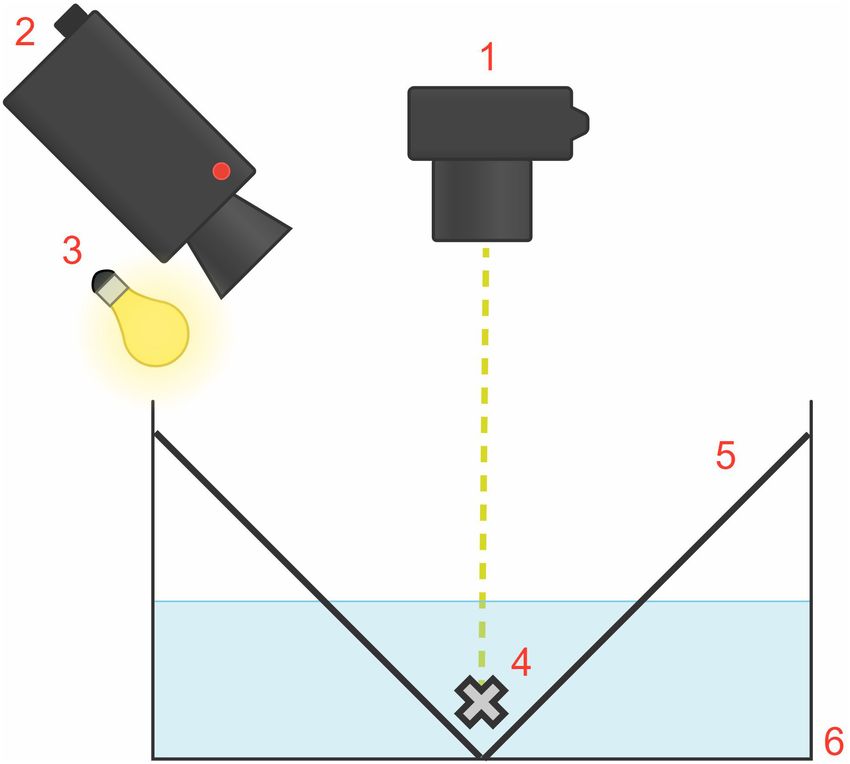
Hadjisolomou et al.                                                                                                  Quantifying Speed of Chromatophore Activity

unrestrained squid. The procedures and methodologies described
below enable non-invasive data collection of chromatophore
activity from living animals to study behavioral responses in
intact organisms.

METHODS
Animals
Adult D. pealeii were collected from coastal waters near Woods
Hole, Massachusetts, US, in 2014. From large population holding
tanks, eight healthy animals (mantle length: 12–15 cm; unknown
sex and age) without any visible physical injuries were selected
for inclusion. We transported individual squid and housed them
together in a 2 m × 1.5 m × 1 m rectangular, light-brown opaque,
fiberglass housing chamber connected to an open, temperature-
controlled (17–19◦ C) seawater system. Gravel and sand on the
bottom of the housing tank provided a natural substrate for
animals to settle. Animals were fed twice a day on an ad libitum
diet of live Fundulus fish and crabs1 .
                                                                                  FIGURE 2 | Diagram of the experimental tank set-up, measuring
Experimental Design                                                               53 cm × 43 cm × 18 cm (situated inside the rig; external rig structure and
Here, n refers to the number of different body regions examined                   black tarp and opaque covers not shown). The flash unit (1) providing the
                                                                                  visual startle stimulus was fixed on the rig at a right angle and 50 cm above
(head/arms, mantle, and fin). Each body region, therefore, was                    the animal (4). The camera (2) and light source (3) were at a 45◦ angle above
considered to be an experimental unit. The study was a within-                    the animal. The white “V-shaped” partition configuration (5) enabled squid to
subjects design consisting of one group of three experimental                     settle naturally at the bottom of the white, rectangular tank (6).
units, and there were eight animals. One animal was excluded
due to a lack of significant chromatophore responses from data
analysis (see “Results” section).                                                Startle Stimulus and Sub-Jet-Threshold Startle
                                                                                 Response
Procedure                                                                        Animals were presented with light flashes to elicit the startle
Experimental Set-Up                                                              reflex response. To deliver the startle stimulus in a top-
To collect measurements, we constructed a rectangular rig                        down direction, a Canon SpeedLite 580EX-RT flash unit was
covered with a layer of black cloth and an additional layer of an                fixed on the rig at a right angle and 50 cm above the
opaque, black tarp to prevent light from entering.                               animal. Similar to the Neumeister et al. (2000) study, we
                                                                                 found that D. pealeii have jet-escape startle responses and
Experimental Tank and Acclimation                                                transient chromatophore expansions to intense light flashes.
The rectangular experimental tank, measuring 53 cm × 43 cm                       For this study, the duration of each light flash stimulus
× 18 cm, consisted of white, opaque plastic walls containing                     was ∼100 µs, with an illuminance of 12,500 lx, providing
10 L of seawater (Figure 2). For each trial, one squid was                       an even exposure of the stimulus on the animal from this
placed within the experimental tank inside the rig. To establish                 distance. The entire animal was illuminated, but we video-
habituation to the experimental apparatus, each squid was placed                 recorded only one specific body region per trial for analysis.
in the experimental tank for 10 min then returned to the                         The stimulus was sufficient in producing muscular contraction
group home tank, 24 h before experimental trials began. We                       but well below the jet-escape sensory threshold to minimize
created a white “V-shaped” partition configuration to enable                     jetting. Thus, this study’s behavioral responses comprised of
the squid to settle naturally at the bottom of the tank, thus                    chromatophore expansions and retractions to light flashes in the
preventing chromatophore displacement outside of the camera                      absence of jetting.
frame. We placed an overhead light source at a 45◦ angle
to illuminate the animal for video recording. The ambient                        Experimental Trial Procedure
light and visual environment determined the chromatophore’s                      Once in the experimental rig, animals were allowed to
state (expanded or retracted) before light flash stimulation.                    procedurally acclimate and settle on the bottom of the tank,
The animals adopted a lighter skin tone to camouflage in the                     as evidenced by the animal remaining motionless for at least
white, uniformly lit tank during trials. Thus, to allow for a                    5 min. Once an animal habituated, it received a sequence of
lighter skin tone, most chromatophores were retracted before                     approximately 90 flashes. For this study, we used a 10-s inter-
flash stimulation.                                                               stimulus interval (ISI), which does not cause attenuation due to
1
 See Supplementary Material for the Ethical Note and Experimental Controls       learning, fatigue, or a combination of both (Otis and Gilly, 1990).
sections.                                                                        With an ISI of 10 s, the total sequence duration lasted for 15 min

Frontiers in Physiology | www.frontiersin.org                                3                                            June 2021 | Volume 12 | Article 675252
Hadjisolomou et al. Quantifying Speed of Chromatophore Activity
per body region and each region was tested during different analysis if the software was unable to detect chromatophores
sessions. The duration and ISI were tested in preliminary trials (Hadjisolomou and El-Haddad, 2017). In such cases, image noise
and found to be appropriate for the purposes of this study. The due to fluctuations of color and luminance created artifacts
rationale was to reduce testing sessions and have only one per that interfered with chromatophore detection and tracking.
body region since 15 min were sufficient. However, each significant expansion or retraction followed
Each flash stimulation was considered an individual trial. The the same pattern regardless of which body region or squid
purpose was to elicit the sub-jet-threshold startle response. Each showed the response.
animal received 90 trials for each of the three body regions, for a
total of 270 trials for each of the eight animals, thus 2,160 trials Chromatophore Expansion
in total. One body region per animal was tested at a time (we Out of the 185 trials with significant chromatophore surface area
counterbalanced the order of the body regions tested per animal). changes (from seven animals), 166 (thus, 90% of these trials)
For details on video-recording, scoring, image analysis, and showed expansion following the flash stimulus (six animals). Out
statistical analysis see Supplementary Material. of these, the head/arms region had 85 trials (Squids #1, 5, and 7),
followed by the mantle with 50 (Squids #1 and 4–7), and then the
fin with 31 (Squids #2 and 5–6).
RESULTS Within these 166 trials, 4,000 (98% out of the total
4,065) chromatophores showed significant expansion. On the
Chromatophore Surface Area Changes head/arms, there were 1,598 chromatophores; from the mantle,
there were 1,743; and on the fin, there were 659.
Following Light Flash Presentation
Out of the 2,160 total trials, 230 were suitable to be analyzed
by Change Point Analysis (CPA) (Taylor, 2000). Based on
Chromatophore Retraction
CPA, 185 were identified to have significant chromatophore The remaining 19 trials showed significant chromatophore
surface area changes. A total of 4,065 individual chromatophores retractions following the flash stimulus (six animals). The
responded to the startle stimulus with either transient expansion head/arms had nine trials (Squids #1, 3, and 7), the mantle eight
or retraction of the pigment. These chromatophores were (Squids #1 and 4–6), and the fin had two (Squid #1).
further analyzed to characterize response activity pre- and post- Within these 19 trials, we tracked and measured 65
stimulation. The remaining 45 trials showed no significant chromatophores showcasing significant retraction. On the
responses by CPA and were excluded, including all Squid #8 trials head/arms, there were 39 chromatophores; from the mantle 21;
and all expansion trials in Squid #3. and on the fin, there were five.
Additionally, the numbers of trials with chromatophore
responses were not equivalent across squid (Squid #2, Descriptive Statistics of Transient
for example, did not show any retraction responses Responses
in any trials). Furthermore, not all squid had all body Temporal Dynamics
regions significantly responding to the flash stimulus, We calculated descriptive statistics on the temporal dynamics
and in other cases, there were trials with both significant of chromatophore surface area changes following the startle
expansion and retraction instances on the same body region. stimulus (see Table 1 and Figure 3). We estimated each value
Thus, there is an unequal distribution of chromatophore with an estimated margin of error of ± 16.67 ms, determined
numbers and body regions represented in the data (see by the inter-frame interval when recording at 60 frames per
Supplementary Figures 2–5). second frequency.
The discrepancies in this dataset are the observed behavioral
differences between animals; a few animals would swim back Magnitude of Response
and forth often enough to invalidate significant parts of the We calculated the magnitude of chromatophore expansion or
footage. Additionally, trials were excluded in the process of image retraction activity by comparing peak response values of response
TABLE 1 | Descriptive statistics of temporal dynamics in milliseconds (ms).
Response time (tR) Delay time (tD) Rise time (tRt) Response duration (rD)
Expansion Retraction Expansion Retraction Expansion Retraction Expansion Retraction
(ms) (ms) (ms) (ms) (ms) (ms) (ms) (ms)
Head/Arms 50 50 83 83 117 117 300 267
Mantle 67 67 117 100 150 150 384 250
Fin 67 67 100 117 134 134 334 217
Response time (tR) is the time to reach or pass the 5% value of the maximal response;
delay time (tD) is the time to reach or pass the 50% value of the response; rise time (tRt) is the time required to reach the 100% value of the response; response duration
(rD) is the time between the 5% values of response before and after the peak.
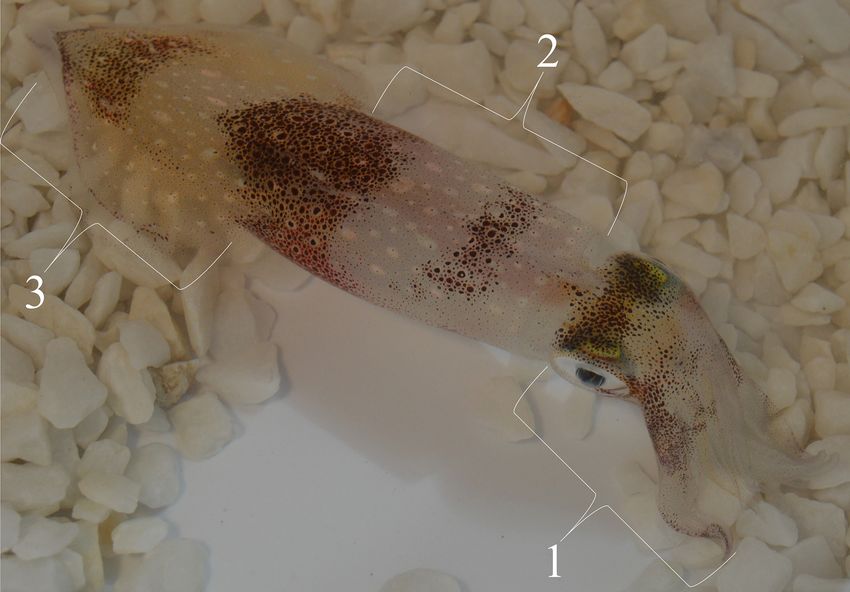
Frontiers in Physiology | www.frontiersin.org 4 June 2021 | Volume 12 | Article 675252Hadjisolomou et al. Quantifying Speed of Chromatophore Activity
FIGURE 3 | Temporal dynamics (in milliseconds) of chromatophore expansion and retraction across body regions. Surface area values are relative to the average
pre-flash chromatophore surface area (1 = average of pre-flash chromatophore surface area; values above 1 = expansion, values below 1 = retraction). Negative
values of milliseconds indicate time before the light flash presentation, 0 indicates flash presentation, positive values indicate time after the light flash presentation
(The two frames containing the flash stimulus, t = 0 ms and t = 17 ms, were removed from analysis due to the animal not being observable).
chromatophore surface area (RCSA) with the pre-flash baseline We also report the following novel observations: this is the
chromatophore surface area (BCSA) (Figure 3). first record of chromatophore activation to light flash stimulation
on regions other than the dorsal mantle; our videos show
Expansion
chromatophore activation on the head, arms, and fin, in addition
On average, the relative chromatophore surface area increased
to the mantle. Also, for the first time, we show chromatophore
by 155.06% across all body regions (4,000 chromatophores).
retraction to light flash stimulation: chromatophores that were
Specifically:
expanded before stimulation (such as dark bands on the
Head/arms: 159%
mantle or expanded chromatophores on the head) responded
Mantle: 168%
with a transient retraction. Further, we observed synchronous
Fin: 116%
chromatophore expansion and retraction on different parts of
Retraction the mantle in the same trial (for example, chromatophores on
On average, the relative chromatophore surface area decreased by dark bands on the mantle contracted, while chromatophores on
40.46% across all body regions (65 chromatophores). Specifically: light skin expanded).
Head/arms: 43% The general temporal dynamic patterns emerging from this
Mantle: 46% data are the following: the speed of expansion and retraction
Fin: 50% activation was the same across body regions. Differences in
response durations were not dependent on the magnitude
of response. Finally, the head/arms were faster in most
DISCUSSION measurements compared to other body regions. The short
latencies reported here are suggestive of a reflexive component
In this exploratory pilot study, we systematically elicited of the response.
behavioral responses using a light flash stimulus in intact, living
squid and analyzed the temporal dynamics and magnitude of
Light Flash Stimulation Elicits
thousands of chromatophore surface area changes at the single-
organ level. Here, we report a replication of the following Sub-Jet-Threshold Responses in
Neumeister et al. (2000) findings using a different squid species. D. pealeii
D. pealeii with uniform light skin patterns before stimulation Chromatophore Expansion
responded to flashes with jetting and chromatophore expansion Packard and others have described how flashes of light can
and lower flash intensities triggered transient darkening in the elicit responses in chromatophores from dissected octopus skin
absence of jetting. Our results demonstrate that it is feasible to use (Packard and Brancato, 1993; Ramirez and Oakley, 2015). More
intact, living animals, to measure, non-invasively, the temporal relevant to this study, Neumeister et al. (2000) reported how light
dynamics of chromatophore control during body patterning. flashes elicit sub-jet-threshold chromatophore expansion in the
Frontiers in Physiology | www.frontiersin.org 5 June 2021 | Volume 12 | Article 675252Hadjisolomou et al. Quantifying Speed of Chromatophore Activity
squid D. opalescens. In agreement with the Neumeister study head/arms are about 33 ms faster than those on the mantle.
findings, we demonstrate that the presentation of light flashes The time difference may not be explained due to response
elicits chromatophore expansion in a different squid species, magnitude since these two body regions are almost identical in
D. pealeii. Also, we validate a method to measure chromatophore that dimension. The circuitry’s differences (Young, 1976) may
activity from unrestrained squid. explain these temporal discrepancies on the head/arms (ACL and
PL) compared to those of the mantle (PCL).
Chromatophore Retraction
This is the first study to report chromatophore retraction in Response Duration (rD)
response to presentation of a light flash stimulus. Comparing Most discrepancies were found in the response duration, the time
the two different types of chromatophore activity, expansions between the 5% values of response before and after the peak,
and retractions, enables a more thorough characterization of between and within body regions when comparing expansion
the sensorimotor system since the mechanisms underlying each and retraction. We calculated the duration by finding the time
type of action are not well understood. However, out of 4,065 difference between the initial response and the return to the
chromatophores analyzed, only 65 showed retraction. As stated pre-flash state following the peak response. Across the type of
in the “Experimental Tank and Acclimation” section, only a responses and body regions, chromatophore change duration is
small number of chromatophores were expanded in the original short, between 217 and 384 ms. Compared to color changes seen
experimental set-up. Therefore, chromatophores responded in in other species (Ramachandran et al., 1996), the sub-second
the only possible outcome given their original state: retracted cephalopod chromatophore change is unparalleled.
chromatophores expanded and expanded chromatophores When it comes to expansion, the chromatophores on the
retracted. These findings demonstrate the method’s validity head/arms are the fastest to complete the response and reach pre-
in studying the retraction mechanism, an essential part of the flash surface area values at 300 ms, followed by the fin (+34 ms)
chromatophore system in rapid body patterning. and the mantle (+84 ms). A different pattern was observed with
retraction responses: chromatophores on the fin had the shortest
Characterization of Temporal Dynamics duration of response at 217 ms, followed by those on the mantle
of Sub-Jet-Threshold Responses (+33 ms), and lastly by those on head/arms (+50 ms).
Response Time (tR) It is worth noting that the response duration was the only
Our findings indicate similarities when comparing expansion dimension in which retraction had a shorter overall interval
with retraction and between the different body regions. The than expansion. For example, the most prolonged response
average response time to reach or pass the 5% value of the duration during retraction (267 ms) was still faster than the
maximal response was 50 ms (± 16.67 ms). This was identical briefest response duration in expansion (300 ms). One reason
across all body regions and between expansions and retractions. to explain this phenomenon is that chromatophore expansion
These results echo the timing of the startle response mentioned and retraction may depend on separate mechanisms; during
in previous studies (Neumeister et al., 2000; Mooney et al., 2016). expansion, the surrounding radial muscles pull and expand the
Based on these findings, the speed of the onset of rapid body pigment (Bell et al., 2013). The retraction mechanism, however,
patterning in squid is characterized by a latency of 50 ms. is still not fully understood.
Delay Time (tD)
When measuring the average time to reach or pass the 50% Characterization of the Magnitude of
value of the response, the head/arms is faster in reaching this Sub-Jet-Threshold Responses
mark than the other two body regions in both expansions and Results indicate differences between the scale of chromatophore
retractions. We believe this difference can be explained by the surface area changes when a chromatophore expands or retracts.
fact that chromatophores on this body region are controlled by While the surface area increased 155.06% on average during
separate lobes (ACL and PL; Young, 1976), and thus the temporal an expansion, the retraction only caused a 40.46% decrease. As
discrepancies may be due to the circuitry. The differences discussed in the “Response Duration” section, one reason for
between fin and mantle timings average out when we aggregate this may be the different mechanisms involved in expansion
data for both expansion and retraction. compared to retraction.
Other discrepancies were found when analyzing
Rise Time (tRt) chromatophores across the body regions. The mantle and
The rise time to reach the 100% value of the response peak is the head/arms showed the largest surface area expansions with 168%
same within body regions in expansion and retraction, though and 159% corresponding changes, respectively. The fin had a
there are differences between regions. Thus, each body region has 116% increase on average. It is unclear why there is a close to 50%
specific temporal benchmarks of maximum response regardless difference between the fin and the other regions. This may be due
of the chromatophore change type. The chromatophores on to differences in the type and distribution of chromatophores on
the head/arms are the fastest between body regions, followed the fin compared to the head/arms and mantle when it comes
by the fin in second place, and lastly, the mantle. Considering to body patterning. It is necessary to investigate further if fin
the slight differences in the magnitude of response between the chromatophores do not expand as much as those on the mantle
body regions, it is surprising that the chromatophores on the and head/arms and why that would be the case.
Frontiers in Physiology | www.frontiersin.org 6 June 2021 | Volume 12 | Article 675252Hadjisolomou et al. Quantifying Speed of Chromatophore Activity
LIMITATIONS AND FUTURE DIRECTIONS CONCLUSION
Unequal Distribution of Trials Between In the natural world, cephalopods are renowned for the dynamic
range and speed of adaptive body patterning used in camouflage
Body Regions and Animals
and communication. In this exploratory study, we used a
The number of trials with significant chromatophore responses
light flash stimulus to elicit transient chromatophore surface
was not equal per body region within each animal nor between
area changes to quantify the chromatophore system’s temporal
animals, and thus there was an unequal distribution of body
dynamics in living, intact animals. Our measurements here verify
regions and chromatophores represented in the dataset. This
the early onset of the sub-second chromatophore changes in body
unequal distribution precludes the possibility to run statistical
patterning with an unparalleled speed. Based on our findings,
analyses in determining significant differences in the temporal
we argue that measuring the temporal dynamics of complete
dynamics and magnitude of responses. Also, due to ethical
behavioral responses during body patterning in intact, living
considerations, we determined that a larger number of animals
animals is a feasible and essential addition to studies using excised
to be used was not well-warranted. For future studies, we advise
isolated skin of subjects. The unexpected differences between
scheduling shorter trials over several days so more data can be
body regions and expansion and retraction responses exemplify
collected from fewer animals.
the need to continue this research line. Such details of timing
the temporal dynamics are essential for comprehensive and
Unequal Number of Significant Surface quantitative descriptions of body patterning. The methodology
and findings described in this study collectively contribute to
Area Changes Between Expansion and our understanding of how cephalopods can employ thousands
Retraction of chromatophore organs within milliseconds for rapid, adaptive
Out of the 4,065 chromatophores showing significant responses, body patterning.
only 65 showed retractions. The small sample size makes it
difficult to generalize the retraction results. To promote the
animal adopting a darker skin tone, we ran additional pilot DATA AVAILABILITY STATEMENT
trials using black tanks and white gravel to generate visual
contrast between the substrate and walls. The contrast increased The raw data supporting the conclusions of this article will be
the probability of squid expressing a disruptive or uniformly made available by the authors, without undue reservation.
dark pattern. When squid experienced light flashes while having
dark patches of skin, we observed more retractions. However,
attempting to replicate these trials using black tanks within the rig ETHICS STATEMENT
was impossible due to the video frames’ noise resulting from less
visibility. Future studies on chromatophore retraction may utilize Ethical review and approval was not required for the animal
visual contrast in the environment and appropriate equipment to study because Ethical approval was not required since, at the
remove videography noise. time this study took place (July, 2014), the Institutional Animal
Care and Use Committee (IACUC) protocols were not issued for
invertebrate research in the United States and in the Institution
Potential Extraocular Chromatophore where the experiments with live animals were carried out.
Nevertheless, procedures were performed to minimize pain and
Responses
distress of the animals involved.
The overall results of our study showed that the response time
(tR) was in line with timings from Otis and Gilly (1990).
They argue that “[t]he 50-ms delay for giant axon excitation AUTHOR CONTRIBUTIONS
in the startle-escape is similar to that for mantle contraction,
indicating that the major source of behavioral delay lies in SH, KK, AC, and IA contributed to the conception and design of
the central nervous system and not in conduction time along the study. SH ran the video trials, collected data, organized the
the giant axon (Hadjisolomou et al. Quantifying Speed of Chromatophore Activity
ACKNOWLEDGMENTS SUPPLEMENTARY MATERIAL
SH would like to thank the staff at the Marine The Supplementary Material for this article can be found
Resources Center for providing valuable support in online at: https://www.frontiersin.org/articles/10.3389/fphys.
undertaking this study. 2021.675252/full#supplementary-material
REFERENCES Neumeister, H., Ripley, B., Preuss, T., and Gilly, W. F. (2000). Effects of
temperature on escape jetting in the squid Loligo opalescens. J. Exp. Biol. 203,
Bell, G. R., Kuzirian, A. M., Senft, S. L., Mäthger, L. M., Wardill, T. J., and Hanlon, 547–557. doi: 10.1242/jeb.203.3.547
R. T. (2013). Chromatophore radial muscle fibers anchor in flexible squid skin. Otis, T. S., and Gilly, W. (1990). Jet-propelled escape in the squid Loligo
Invertebrate Biol. 132, 120–132. doi: 10.1111/ivb.12016 opalescens: concerted control by giant and non-giant motor axon pathways.
Díaz-Santana-Iturrios, M., Salinas-Zavala, C. A., Granados-Amores, J., de la Cruz- Proc. Natl. Acad. Sci. U.S.A. 87, 2911–2915. doi: 10.1073/pnas.87.8.
Agüero, J., and García-Rodríguez, F. J. (2019). Taxonomic considerations 2911
of squids of the family Loliginidae (Cephalopoda: Myopsida) supported by Packard, A., and Brancato, D. (1993). Some responses of Octopus chromatophores
morphological, morphometric, and molecular data. Mar. Biodivers. 49, 2401– to light. J. Physiol. Lond. 459:429.
2409. doi: 10.1007/s12526-019-00979-3 Packard, A., and Sanders, G. D. (1971). Body patterns of Octopus vulgaris and
Dubas, F., Hanlon, R. T., Ferguson, G. P., and Pinsker, H. M. (1986). Localization maturation of the response to disturbance. Anim. Behav. 19, 780–790. doi:
and stimulation of chromatophore motoneurones in the brain of the squid, 10.1016/s0003-3472(71)80181-1
Lolliguncula brevis. J. Exp. Biol. 121, 1–25. doi: 10.1242/jeb.121.1.1 Preuss, T., and Gilly, W. F. (2000). Role of prey-capture experience in the
Ferguson, G. P., Martini, F. M., and Pinsker, H. M. (1988). Chromatophore motor development of the escape response in the squid Loligo opalescens: a
fields in the squid, Lolliguncula brevis. J. Exp. Biol. 134, 281–295. doi: 10.1242/ physiological correlate in an identified neuron. J. Exp. Biol. 203, 559–565. doi:
jeb.134.1.281 10.1242/jeb.203.3.559
Gilly, W., Hopkins, B., and Mackie, G. O. (1991). Development of giant motor Ramachandran, V. S., Tyler, C. W., Gregory, R. L., Rogers-Ramachandran, D.,
axons and neural control of escape responses in squid embryos and hatchlings. Duensing, S., Pillsbury, C., et al. (1996). Rapid adaptive camouflage in tropical
Biol. Bull. 180, 209–220. doi: 10.2307/1542390 flounders. Nature 379, 815–818. doi: 10.1038/379815a0
Gilly, W. F., and Lucero, M. T. (1992). Behavioral responses to chemical Ramirez, M. D., and Oakley, T. H. (2015). Eye-independent, light-activated
stimulation of the olfactory organ in the squid Loligo opalescens. J. Exp. Biol. chromatophore expansion (LACE) and expression of phototransduction genes
162, 209–229. doi: 10.1242/jeb.162.1.209 in the skin of Octopus bimaculoides. J. Exp. Biol. 218, 1513–1520. doi: 10.1242/
Hadjisolomou, S. P. (2017). Behavioral Responses to Pulses of Light in the jeb.110908
Longfin Inshore Squid, Doryteuthis pealeii (Lesueur, 1821). Ph.D. Dissertation. Reiter, S., Hülsdunk, P., Woo, T., Lauterbach, M. A., Eberle, J. S., Akay, L. A.,
New York, NY: The Graduate Center, City University of New York. et al. (2018). Decomposing the control and development of skin patterning in
Hadjisolomou, S. P., and El-Haddad, G. (2017). SpotMetrics: an open- cuttlefish. Nature 562, 361–366. doi: 10.1038/s41586-018-0591-3
source image-analysis software plugin for automatic chromatophore Taylor, W. A. (2000). Change-Point Analysis: A Powerful New Tool for Detecting
detection and measurement. Front. Physiol. 8:106. doi: 10.3389/fphys.2017. Changes. Deerfield, IL: Baxter Healthcare Corporation.
00106 Young, J. Z. (1976). The nervous system of Loligo II. Suboesophageal centres.
Hanlon, R. (2007). Cephalopod dynamic camouflage. Curr. Biol. 17, R400–R404. Philos. Trans. R. Soc. Lond. B Biol. Sci. 274, 101–167. doi: 10.1098/rstb.1976.
Hanlon, R. T. (1982). The functional organization of chromatophores and 0041
iridescent cells in the body patterning of Loligo plei (Cephalopoda: Myopsida). Zylinski, S., Osorio, D., and Shohet, A. J. (2009). Perception of edges and visual
Malacologia 23, 89–119. texture in the camouflage of the common cuttlefish, Sepia officinalis. Philos.
Hanlon, R. T., and Messenger, J. B. (1988). Adaptive coloration in young cuttlefish Trans. R. Soc. Lond. B Biol. Sci. 364, 439–448. doi: 10.1098/rstb.2008.0264
(Sepia officinalis L.): the morphology and development of body patterns and
their relation to behaviour. Philos. Trans. R. Soc. Lond. B Biol. Sci. 320, 437–487. Conflict of Interest: The authors declare that the research was conducted in the
doi: 10.1098/rstb.1988.0087 absence of any commercial or financial relationships that could be construed as a
How, M. J., Norman, M. D., Finn, J., Chung, W. S., and Marshall, N. J. (2017). potential conflict of interest.
Dynamic skin patterns in cephalopods. Front. Physiol. 8:393. doi: 10.3389/fphys.
2017.00393 Copyright © 2021 Hadjisolomou, El-Haddad, Kloskowski, Chavarga and Abramov.
Langridge, K. V., Broom, M., and Osorio, D. (2007). Selective signalling by This is an open-access article distributed under the terms of the Creative Commons
cuttlefish to predators. Curr. Biol. 17, R1044–R1045. Attribution License (CC BY). The use, distribution or reproduction in other forums
Mooney, T. A., Samson, J. E., Schlunk, A. D., and Zacarias, S. (2016). Loudness- is permitted, provided the original author(s) and the copyright owner(s) are credited
dependent behavioral responses and habituation to sound by the longfin squid and that the original publication in this journal is cited, in accordance with accepted
(Doryteuthis pealeii). J. Comp. Physiol. A 202, 489–501. doi: 10.1007/s00359- academic practice. No use, distribution or reproduction is permitted which does not
016-1092-1 comply with these terms.
Frontiers in Physiology | www.frontiersin.org 8 June 2021 | Volume 12 | Article 675252You can also read