National HSE Winter Plan 2019-20
←
→
Page content transcription
If your browser does not render page correctly, please read the page content below
National HSE Winter Plan 2019-20
November 2019
Contents

Introduction                                                                  3
Overview of Unscheduled Care Performance                                      4
Projecting Demand for Winter 2019-20                                          9
Approach to Winter 2019-20                                               11
Winter 2019-20 Funding                                                   15
Winter Action Team Initiatives                                           16
Winter Action Team Initiatives – Funding Breakdown                       18
Appendix 1: Lessons learned from Winter 2018-19                          19

                                           National HSE Winter Plan 2019-20       2
Introduction
While service providers are now experiencing high demand on a year round basis, it is reasonable to expect, and
therefore essential to plan for, a more intense peak during the winter period. A prolonged holiday period, severe
winter weather, seasonal influenza and the spread of norovirus in conjunction with other healthcare associated
infections are examples of such pressures that increase during this period.
Since 2009, the number of people aged 65 years and older has increased by 35%, consistently higher than the
European Union average of 15% over the same period. With this trend set to continue over the coming years,
increased demand for services will occur as the population increases in age.
An ageing population, while good for society, results in increasing demand for services as patients get older. For
example, compared to people aged 64 years and younger, use of inpatient hospital care is over seven times
greater among people aged 65 years and old and over 14 times greater among people aged 80 years and older.
Such increases in demand for services is heightened during winter.
The purpose of the National Winter Plan 2019-20 is to provide additional supports and measures to address the
anticipated surge in activity during the winter months in hospitals and across the community. Building on lessons
learned from last winter, a number of initiatives are planned to support the system this winter with a particular
focus on mitigating against significant egress challenges.
To this effect, a ‘lessons learned’ session was held with the Winter Action Teams in April 2019, a Winter
Preparedness guidance document was released to the system in August and each Winter Action Team submitted
an Integrated Winter Plan to provide assurance in terms of their preparedness for Winter 2019-20 and inform the
development of this plan.
This document sets out the current and projected demand and activity expected during winter 2019-20 and
outlines the proposed approach within the system to deal with same.
National HSE Winter Plan 2019-20 3Overview of Unscheduled Care Performance
Winter 2018-19 Vs Winter 2017-18 (Oct - Mar)
ED attendances have increased year on year over the past two winters (October to March) as outlined at Figure 1.
This growth trend significantly outstrips the mean projected growth in population of 1.3% per annum (2017 to
2020).
Winter 2018 / 2019 Winter 2017 / 2018 Winter 2016 / 2017
120,000
115,791 115,465
115,000
111,282
107,873 108,094
110,000 104,464
105,000
100,000
95,000
90,000
Jan
Nov
Feb
Mar
Oct
Dec
Figure 1: ED attendances – Winter 2016-17, 2017-18, 2018-19
Figure 1 can be misleading in assessing the consistency of the pressure during the winter period in terms of the
volume of days each month. At a glance, it would appear that there is significant variation each month from
December to March in terms of volume. Figure 2 below displays the same metrics under the guise of the average
number of daily attendances each month during winter. This eliminates the variance in the number of days per
month and displays a trend of more consistent pressure.
Winter 2018 / 2019 Winter 2017 / 2018 Winter 2016 / 2017
3,800 3,735 3,731 3,725
3,700 3,590 3,596
3,600
3,487
3,500
3,400
3,300
3,200
3,100
3,000
2,900
2,800
Jan
Feb
Nov
Mar
Dec
Oct
Figure 2: ED attendances (daily average) – Winter 2016-17, 2017-18, 2018-19
National HSE Winter Plan 2019-20 4Overview of Unscheduled Care Performance
This demand trend for ED attendances is reflected at Figure 3 with similar annual growth rates recorded in ED
admissions however it is of note that the rate of growth reduced slightly during winter 2018-19, despite further
increases in ED attendances. This could be related to a milder winter with lower levels of reported influenza and
Norovirus in the system.
Winter 2018 / 2019 Winter 2017 / 2018 Winter 2016 / 2017
35,000
31,985
30,648
30,226
29,633 29,369 28,073
30,000
25,000
20,000
Jan
Feb
Nov
Mar
Oct
Dec
Figure 3: ED admissions – Winter 2016-17, 2017-18, 2018-19
The overall 8am trolley count also improved significantly by -5,122 (-9.1%) during winter 2018-19 when compared
to the previous winter (2017-18) which recorded a slight dis-improvement on winter 2016-17 of +1,226 (+2.2%).
Winter 2018 / 2019 Winter 2017 / 2018
12,000
11,500
11,000
10,500
10,000 9,645
9,500
9,909
9,000
8,493
8,500 8,900
8,000 7,575
7,500
7,000
6,500 6,547
6,000
Jan
Feb
Mar
Nov
Oct
Dec
Figure 4: 8am trolley count – Winter 2016-17, 2017-18, 2018-19
National HSE Winter Plan 2019-20 5Overview of Unscheduled Care Performance
Figure 5 below illustrates the average daily number of trolleys per month over the past three winters. It outlines the
true trend in trolleys in Q1 as opposed to figure 4 by eliminating the variance in number of days per month.
Winter 2018 / 2019 Winter 2017 / 2018 Winter 2016 / 2017
400
350
300 320 318 311
283
250
244
200
211
150
100
Jan
Feb
Mar
Nov
Oct
Dec
Figure 5: 8am trolley count (daily average) – Winter 2016-17, 2017-18, 2018-19
Delayed Transfers of Care (DTOC) tracked significantly higher during Winter 2018-19 when compared to Winter
2017-18. Of note the number of DTOCs during Winter 2018-19 was higher on each corresponding week when
compared to the winter before.
Winter 2017 / 2018 Winter 2018 / 2019
700
650
600
550
500
450
400
06-Nov
13-Nov
20-Nov
27-Nov
01-Jan
08-Jan
15-Jan
22-Jan
29-Jan
05-Feb
12-Feb
19-Feb
26-Feb
04-Mar
11-Mar
18-Mar
25-Mar
04-Dec
11-Dec
18-Dec
25-Dec
02-Oct
09-Oct
16-Oct
23-Oct
30-Oct
Figure 6: DTOCs Winter 2018 / 2019 Vs Winter 2017 / 2018
While the number of patients listed as DTOCs is sensitive to the impact of increased funding in terms of additional
home support hours, as reflected in the historical downward trend toward the Christmas period, the level of activity
has significantly increased in terms of the number of patients being added and removed from the list each week.
National HSE Winter Plan 2019-20 6Overview of Unscheduled Care Performance
September 2019 (Year to date) Performance
Sept YTD 2019 Sept YTD 2018 Diff (no.) Diff (%)
ED Attends 1,006,196 976,421 29,775 +3.0%
ED Admits 262,683 259,056 3,627 +1.4%
8am Trolley Count 80,809 75,521 5,288 +7.0%
Avg. Weekly DTOCs 633 559 74 +13.2%
In terms of trends, year on year increases recorded in ED attendances for 2019 (YTD) can be attributed to
significantly higher levels in Q1 and early Q2 2019. Towards the end of Q2, the trend in ED attendances has
moderated when compared to the same period in 2018 as illustrated in the graph below (Figure 7), whilst still
remaining above profile for the actual population growth.
30,000
2019 2018
28,000
26,000
24,000
22,000
20,000 Storm Emma
18,000
12-Feb
01-Jan
15-Jan
29-Jan
26-Feb
12-Mar
26-Mar
09-Apr
23-Apr
07-May
21-May
10-Sep
24-Sep
13-Aug
27-Aug
02-Jul
16-Jul
30-Jul
04-Jun
18-Jun
Figure 7: ED Attendances – September YTD 2019 Vs 2018
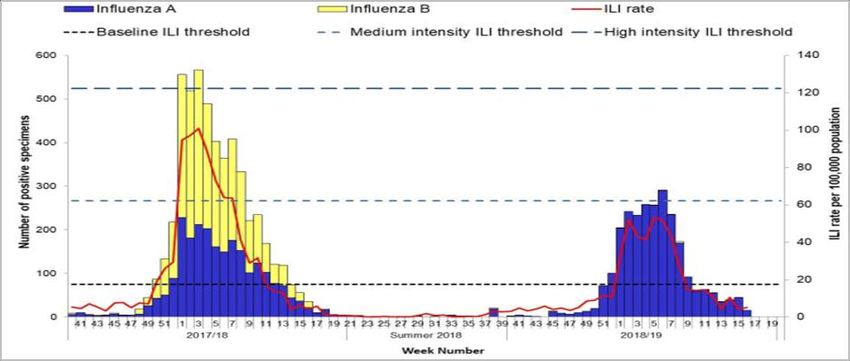
Figure 8 indicates the levels of sentinel GP reported influenza like illnesses over the past two winters and
highlights the low levels reported during Winter 2018-19 – the lowest recorded since Winter 2011-12.
Figure 8: ILI sentinel GP consultation rates per 100,000 population, baseline ILI threshold, medium and high intensity
National HSE Winter Plan 2019-20 7Overview of Unscheduled Care Performance
The influenza-like illness (ILI) rate has been below the Irish baseline ILI threshold (17.5/100,000 population) since
week 9 2019 (week ending 3rd March 2019). ILI rates were above the baseline threshold level for eight
consecutive weeks (weeks 1 – 8, 2019) and have remained below the medium intensity ILI threshold all season.
Influenza A (H1N1) pdm09 has been the dominant circulating virus in the 2018/2019 season overall. Results
showed that the vaccine was a good match for the circulating influenza A(H1N1)pdm09 viruses in 2018/2019.
The run rate for DTOCs remains significantly higher during 2019 (YTD) when compared to 2018 (YTD).
850 2019 2018
800
750
700
650
600
550
500
450
400
01-Jan
15-Jan
29-Jan
12-Feb
26-Feb
12-Mar
26-Mar
10-Sep
24-Sep
09-Apr
23-Apr
07-May
21-May
13-Aug
27-Aug
04-Jun
18-Jun
02-Jul
16-Jul
30-Jul
Figure 9: Delayed Transfer of Care - YTD 2019 Vs 2018
Summary
At a national level, a significant increase is noted across ED attendances, admissions, 8am trolley counts and
delayed transfers of care (DTOC), when comparing September 2019 Year to Date (YTD) to the same period in
2018. In 2019, ED attendances and admissions increased by 3% and 1% respectively, with a 7% increase in the
8am trolley count, when compared to the same time in 2018. September 2019 YTD saw the figure for ED
attendances surpass 1 million, with a differential no of 29,775, since the same time in 2018. The average number of
weekly DTOCs during September 2019 YTD is 13% higher than the average reported during the same period in
2018.
The operational flow effects are Acute Hospitals operating close to or above 100% occupancy, high levels of surge
in use, and increased delayed transfers of care (+13.2% increase), a pressurized workforce and challenges to
improve patient experience times across the system.
National HSE Winter Plan 2019-20 8Projecting Demand for Winter 2019-20
The Irish population has increased by an average of +1.25% annually over the period 2015 to 2018. The growth in
ED attendances over the same period has outstripped this trend growing by an average of +3.75% annually.
Taking a view of Winter 2019-20, this section sets out our approach to modelling the potential growth in demand in
Emergency Departments for the season.
Population Growth
Method - M1F1 2015 2016 2017 2018 2019 2020 2021
All ages 4,687,800 4,739,597 4,803,510 4,865,573 4,926,992 4,987,719 5,047,468
Difference (no.) 51,797 63,913 62,063 61,419 60,727 59,749
Difference (%) +1.10% +1.35% +1.29% +1.26% +1.23% +1.20%
The projected growth in the Irish population recorded from 2015 to 2021 as per the Central Statistics Office. As
stated, the Irish population is expected to grow by a minimum of 1.10% annually using the M1F1 methodology
from the period 2015 to 2021. With these projected growth models, Figure 10 below outlines the proportional split
by age category.
0-15 years 16-74 years
80.0% 72.0% 72.1% 72.1% 72.2% 72.2%
71.9% 72.0%
70.0%
60.0%
50.0%
40.0%
30.0% 22.7% 22.5% 22.3% 22.1% 21.9% 21.7% 21.4%
20.0%
10.0% 5.5% 5.5% 5.6% 5.8% 5.9% 6.1% 6.3%
0.0%
2015 2016 2017 2018 2019 2020 2021
Figure 10: % proportion of population by age category
In terms of growth rates for the age categories, the 0-15 years old category is projected to grow by a mean of
0.3%, the 16-74 years old category is projected to grow by a mean of 1.3% and the 75+ years old category is
projected to grow by a mean of 3.8% over the recorded period.
ED Attendance Growth
Method - M1F1 2015 2016 2017 2018 2019 2020 2021
ED attendances 1,155,323 1,208,830 1,246,607 1,290,091
Difference (no.) 53,507 37,777 43,484
Difference (%) +4.63% +3.13% +3.49%
National HSE Winter Plan 2019-20 9Projecting Demand for Winter 2019-20
The table above outlines the actual growth in ED presentations recorded from 2015 to 2018. The annual growth
rate in ED attendances outstrips the projected growth rate in the Irish Population by an average of +2.50%
annually over the same period. Figure 11 overleaf outlines the proportion of ED attendances per age category,
noting the increase in the 75+ years old proportion when compared to the proportion for the same cohort in terms
of population at Figure 11.
0-15 years 16-74 years 75+ years
70.0% 63.9% 63.2% 64.1% 64.5%
60.0%
50.0%
40.0%
30.0% 24.2% 25.2% 24.0% 23.3%
20.0%
11.9% 11.6% 12.0% 12.1%
10.0%
0.0%
2015 2016 2017 2018
Figure 11: % proportion of ED attendances by age category
In terms of growth in ED attendances by age category, the 0-15 years old category increased each year by a
mean of 2.7%, the 16-74 years old category increased by a mean of 4.1% and the 75+ years old category
increased by a mean of 4.5% over the recorded period.
Forecasting Model Methodology
2016 2017 2018 2019
Annual growth in Irish population +1.10% +1.35% +1.29% +1.26%
Annual growth in ED attendances +4.63% +3.13% +3.49%
(A) Difference (%) +3.53% +1.78% +2.20%
3 year average (A) +2.50%
Projected growth rate for Winter 2019-20 +3.76%
National HSE Winter Plan 2019-20 10Approach to Winter 2019-20
During the 2018-19 season, the introduction of a The membership of the Winter Oversight Group is
Winter Oversight Group and nine focus site Winter outlined below:
Action Teams (WATs) for an enhanced focus period
• Chief Operations Officer (Chair);
provided the system with a strong grip on operations in
terms of oversight, management and response. The • National Director, Acute Operations;
Winter Oversight Group provided clarity on leadership
• National Director, Community Operations
and governance to assist in delivering sustainable
improvement in unscheduled care (USC) performance • National Clinical Advisor and Group Lead, Acute
across the patient flow continuum for the winter period. Operations;
The WATs ensured a structured project management
• National Director, National Services;
approach and planning across all HGs / CHOs in
assisting to drive and sustain improvement in USC for • Head of the Special Delivery Unit (PMIU);
the focus period. Based on the learning from Winter
• Assistant National Director, Acute Operations
2018-19, it is proposed to implement this process over
(Scheduled Care);
the entire winter period for 2019-20.
• Assistant National Director, Acute Operations
Aims and Objectives for Winter 2019-20
(Unscheduled Care);
The aim is to ensure that service providers are
• Chief Clinical Information Officer;
prepared for the additional external pressures
associated with the winter period. The increased • Assistant National Director, Community Operations
pressures include a prolonged holiday period, severe (Older People);
winter weather, seasonal influenza, the spread of
• Assistant National Director, Community Operations
norovirus and other healthcare associated infections.
(Primary Care);
Winter Plans will provide for the continuous delivery of
timely, safe and appropriate care, in the right setting, • Winter Communication Lead;
and at the right time to patients during the winter
• Assistant National Director, Emergency
months.
Management;
Individual CHOs and Hospital Groups have developed
• Assistant National Director, Public Health;
Integrated Winter Plans that will focus on demand
management and prevention, timely access to the • Director, National Ambulance Service; and
most appropriate care pathway for patients as well as
• Head of Corporate Affairs.
provide appropriate timely egress from acute hospitals.
The Winter Oversight Group will convene weekly from
The local Integrated Winter Plans will be delivered by
November in the Dargan Building in Heuston South
the local WAT that are jointly led by CHOs and
Quarter with more frequent meetings scheduled as
Hospital Groups with support from national functions
required.
and the National Ambulance Service (NAS). Integrated
Winter Plans have supported the development of this All Winter Action Teams will report into the Winter
single overarching strategic level Winter Plan for the Oversight Group at National level and this process will
HSE. be co-ordinated by the National Services Division of
the HSE.
Winter Oversight Group
Winter Action Teams
The Winter Oversight Group has convened fortnightly
since the 8th July 2019 to lead the Winter 2019-20 This winter, there are nine WATs, each aligned to a
Planning Process. The Winter Oversight Group is Community Health Organisation and associated Acute
chaired by the Chief Operations Officer and its Hospitals and Hospital Groups covering the entire
membership consists of senior HSE staff across the population base as outlined overleaf.
relevant divisions. The Chief Operations Officer will be
responsible for Winter 2019-20 with responsibility for
co-ordination of Winter Planning and execution tasked
to the National Services Division.
National HSE Winter Plan 2019-20 11Approach to Winter 2019-20
Winter Action Teams (cont’d)
Winter Action Team 1 The WATs have been in operation since the beginning
of October 2019 and will continue to convene over the
• Saolta Hospital Group: Letterkenny, Sligo
winter period with enhanced oversight and
• RCSI Hospital Group: Cavan management around the Christmas holiday period.
• Community Healthcare Organisation 1 To ensure an integrated and coordinated approach to
this period the membership of each WAT will, comprise
Winter Action Team 2
of the following key stakeholders at a minimum:
• Saolta Hospital Group: Galway University Hospitals,
• CHO Chief Officer – Co‐Chair;
Mayo General, Roscommon, Portiuncula
• HG CEO – Co‐Chair;
• CHO West
• Aligned Hospital CEOs and COOs;
Winter Action Team 3
• Senior decision makers from the local acute and
• UL Hospital Group: Ennis, MWRH Limerick, MWR
community setting; and
Maternity, Nenagh, MRW Orthopaedic Croom, St.
Johns • Senior NAS Manager.
• CHO Midwest Each WAT has prepared an Integrated Winter Plan
and are tasked with the provision of leadership and
Winter Action Team 4
governance within its area. The WATs are responsible
• South/Southwest Hospital Group: CUH, Mercy, for the coordination of a range of integrated hospital
Kerry and community actions on a daily basis as well as the
application of agreed additional surge actions in
• Cork Kerry Community Healthcare
response to escalating demand pressures within the
Winter Action Team 5 local health system.
• South/Southwest Hospital Group: UHW, South It is responsible for the integration of the internal and
Tipperary external communications plan so as to ensure
messaging is fit for purpose.
• Ireland East Hospital Group: St. Luke’s Kilkenny,
Wexford General Each WAT will conduct an evaluation of all the factors
that will help identify the important local considerations
• Southeast Community Healthcare
that need to be addressed to assist in the decision
Winter Action Team 6 making process and the subsequent actions effected
toward a local response.
• Ireland East Hospital Group: SVUH, St. Michael’s,
St. Columcille’s The early use of Data and Business Intelligence is
essential so that relevant information and data can be
• Community Health Organisation 6
accessed and shared in a timely and robust manner in
Winter Action Team 7 respect of the ‘Inflow’, ‘Throughput‘ and ‘Egress’ of
patients across the local health system.
• Dublin Midlands Hospital Group: Tallaght, Naas
General Hospital, St. James’s Expediting and increasing the efficiency of the ‘system’
during the period is a priority but must not come at a
• Community Healthcare Organisation 7
cost to the service user or patient. All WATs will ensure
Winter Action Team 8 focused measures are in place to improve the
experience and welfare of all service users and
• Ireland East hospital Group: MRH Mullingar, Navan
patients.
• RCSI Hospital Group: OLH Drogheda
To support integrated planning, it is essential that all
• Dublin Midlands Hospital Group: Tullamore, MRH elements of the local health system have a knowledge
Portlaoise and visibility of all available and planned capacity as
well as expected and predicted demand. In preparation
• Community Healthcare Organisation 8
for the surge period, all elements of the WAT will have
Winter Action Team 9 engaged in joint planning and preparation activities to
ensure that required escalation and surge actions are
• Ireland East Hospital Group: Mater
implemented as needed.
• RCSI Hospital Group: Connolly, Beaumont
• Community Healthcare Organisation 9
National HSE Winter Plan 2019-20 12Approach to Winter 2019-20
WAT Oversight and Reporting Arrangements Moreover, each Integrated Winter Plan includes
service level metrics for Unscheduled Care
Each WAT will report to the Winter Oversight Group on
performance which have been developed based on
a weekly basis during the Focus Period with enhanced
past experiences, own local knowledge and leveraging
reporting by sites in particular difficulty or at times of
the demand and activity analysis included in the Winter
exceptional pressure. This process will be coordinated
Preparedness Plan. The key metrics to be monitored
by the National Services Division. The Co‐Chairs of
during the winter period are outlined below.
each WAT will be required to detail the current levels of
USC demand, key causal factors, challenges, risks and
Service Level Metrics
the mitigating actions in place to include any external
messaging that is being undertaken at a local level. 24 Hour PET
The Winter Oversight Group may direct alternative 9 Hour PET (75+ years old)
actions based on the known national performance and 8am trolley count
/ or may provide additional resource to supplement
Delayed Transfers of Care
existing actions underway at local level.
CIT approvals
WAT Performance will be monitored by the Winter
Oversight Group on a daily basis via the SBAR portal TCB approvals
and site communications as required and on a weekly HSP approvals
basis via weekly national metrics reports and bespoke
NHSS approvals
BIU data streams.
Moreover a representative of the PMIU will join each NTPF Support for Winter 2019-20
WAT meeting to provide support and escalate any
The National Treatment Purchase Fund (NTPF) will
issues to the National Oversight Group as required.
assist the HSE to deal with the increased demand
The 3 overarching aims of each WAT will be: projected for this winter by providing additional
diagnostics and other hospital treatments for patients.
1. Demand Management - Seek to reduce ED
This support will complement the existing measures
attendances and admissions through the delivery
identified by the HSE. The level and type of support for
of care in the most appropriate setting, i.e. at the
individual hospitals will vary depending on demand and
first point of contact
will provide access to additional diagnostic capacity
2. Operational Flow - Maximise patient flow through both at local hospital level as well as outsourcing to
from community to hospital and appropriate private facilities.
discharge as well as maintaining optimal length of
Seasonal Influenza
stay for all inpatients in both acute and community
settings Ireland has changed from using trivalent vaccine to
using quadrivalent vaccine for the 2019/2020 influenza
3. Egress Management - Optimise integrated
season. Quadrivalent vaccines include a 2nd influenza
working and ensure a joint approach to patient
B virus in addition to the 2 influenza A viruses found in
flow.
trivalent vaccines. The WHO vaccine strain selection
To this end, Key Service Level Metrics developed by committee recommend that quadrivalent vaccines for
each WAT will be monitored weekly during the winter use in the 2019/2020 northern hemisphere influenza
period. season contain the following:
Integrated Winter Plans • an A/Brisbane/02/2018 (H1N1)pdm09-like virus;
• an A/Kansas/14/2017 (H3N2)-like virus;
The Integrated Winter Plans are collaborative whole
• a B/Colorado/06/2017-like virus (B/Victoria/2/87
system business continuity plans developed by the
lineage); and
WATs. They provide a detailed response to
• a B/Phuket/3073/2013-like virus (B/Yamagata/16/88
unscheduled care over the winter to supplement
lineage).
existing year round plans. In the development of the
plans, WATs reflected on the learning from previous The approach for this winter includes:
years and focused on their ability to meet the variation
1. A HSE national flu planning steering group is in
in seasonal demand. Integrated Winter Plans have
place and meets monthly.
been received from each of the WATs as set out in the
table overleaf. 2. Each Hospital Group and CHO has provided a flu
plan as per a template (based on the evidence of
last season’s successes and areas of concern) for
the upcoming season
National HSE Winter Plan 2019-20 13Approach to Winter 2019-20
Seasonal Influenza (cont’d) In line with Winter 2018-19, regular updates will be
provided to press and media throughout the winter
3. A HSE Communications Plan has been developed
from the National Oversight Groups via press
and agreed and the campaign will launch on the
conferences, interviews and updated statements. Local
10th of October 2019.
communications plans will also be put in place by the
4. The weekly flu report will recommence for the flu Winter Action Teams as part of their winter plan.
season and this year flu vaccine uptake rates by
National Ambulance Service
Hospital Group and CHO will be presented.
A key component of this year’s winter planning and
5. A schedule of surveillance reports on influenza
management will be the NAS’s input to the process.
vaccine uptake in healthcare workers, over 65s,
Following on from last year’s, NAS adopted an
long-term care facility residents and those in risk
inclusive systems approach to winter and will be
groups for flu will be issued as data becomes
fundamental to supporting the business intelligence
available.
and decision making capability of the Winter Oversight
6. Influenza vaccine uptake in acute hospital based Group.
HCWs was 53.2% in 2018/19 compared with 44.8%
In this regard, the dynamic reporting dashboard
in 2017/18. There has been a significant increase in
developed by the NAS will support the Winter
uptake in acute hospital based HCWs over the past
Oversight Group meetings by providing regular
three influenza seasons.
updates including inter alia existing levels of service,
7. Influenza vaccine uptake in LTCF based HCWs demand management and inter-facility transfers.
was 42.2% in 2018/19 compared with 33.1% in
Strategic objectives
2017/18. There has been a significant increase in
uptake in LTCF based HCWs over the past three • Protect service and patient care delivery
influenza seasons • Protect the welfare and safety of NAS staff, patients
and other stakeholders.
Communications
• Ensure consistent service delivery
A key objective of the Winter Plan is to encourage • Coordination and Management of all NAS
people to prepare for and stay well during winter. Our resources to deal with core activities in a timely,
pharmacist and GP colleagues are helping us with this effective and above all, safe way.
work and are actively involved in delivering our public • To ensure effective command, control and provision
winter communication campaigns again this year. of ambulance services in the event of a major
incident occurring at any event. This will be
A comprehensive communications plan is being
achieved by initiating the NAS Major Incident Plan.
developed to support delivery of the Winter Plan
2019/20. The plan is focused on providing: NAS will experience challenges in increasing capacity,
capability and resilience in response to the anticipated
• Expert advice and information to the public on
increase in activity, as will the wider HSE. However,
keeping well during the winter.
the focus this will be to maintain delivery of a safe
• Providing timely and accurate public information on
service throughout.
service activity and performance throughout the
winter. NAS will engage with stakeholders within the hospital
• Maximising uptake of flu vaccines, in the public and groups in relation to turnaround and bi-directional flow
among our healthcare teams. challenges. It is envisaged that a heightened level of
• Providing information and advice on common winter awareness and focus will be in operation continuing an
illnesses, self-care and being winter ready enhanced engagement through the local, and
• Using the right services e.g. Injury Units, GP Out of Unscheduled Care Governance Groups.
Hours , local pharmacists etc.
It is intended to use four main channels for winter
campaigns; national and regional radio, press, social
media and digital display or search advertising. These
channels will work together to build general
awareness, and to support people at the time they are
searching or browsing on line (social and search).
National HSE Winter Plan 2019-20 14Winter 2019-20 Funding
HSE Winter Funding 2019 / 2020
The HSE was allocated €26m on 8th October 2019 on a once-off basis to support HSE plans to manage the known
increase in demand that our health service will experience over the winter months. This funding included €5m from
the Department of Health assigned on 14th September 2019. The priorities for additional resources this winter is
outlined as follows:
1. Funding requirements to year end to reduce the additionality in the Delayed Transfers of Care (DTOC)
outturn year to date to a figure of 450 at year end by supporting the NHSS, Transitional Care and Home
Supports.
2. Funding requirements for specific local initiatives to support the Winter Action Teams in managing
unscheduled care performance.
3. Funding for aids and appliances to support older persons.
2019 Winter Funding
a) Funding requirements to year end 2019
Metric € million € million
Egress Initiatives
NHSS - reduce period awaiting funding to four weeks until 31st December
13.000
2019
Transitional care funding required to support egress from Acute Hospitals 4.200
Home Support Packages to support DTOC & Community Waiting List 2.000 19.200
Winter Action Team Initiatives, funding to be distributed based on
6.800
population size
Total funding required to year end 2019 26.000
In terms of the €6.8 million allocated to Winter Action Team Initiatives, each WAT has submitted funding proposals
as part of their Integrated Winter Plans to support Unscheduled Care Performance during the Winter Period. The
funded initiatives are outlined in the next section, “Winter Action Team Initiatives”.
National HSE Winter Plan 2019-20 15Winter Action Team Initiatives
Winter
Funded initiatives
Action Team
Added Medical Registrar for improved medical cover
Rapid flu testing to reduce TAT to 2 hours
Additional cleaning services to improve bed TAT out of hours
1
Reablement programme to decrease presentations and admissions
Additional aids and appliances to facilitate timely discharge
Implement hospital avoidance measures to reduce the number of patients admitted for assessment
Additional portering to assist with ED flow and MRI capacity and evening lists to facilitate discharge
Protect LTC seating initiative funding to reduce length of stay in acute hospital
Provision of required equipment to facilitate rapid discharge
2 Added Registrar On Call on weekends to assist with flow in main hospital
Open weekend capacity to eliminate overcrowding in the ED and assist with patient flow
Additional rapid flu testing kits and local PCR Flu testing to reduce length of stay, facilitate diagnosis and
treatment of Flu patients, reduce isolation demand, and reduce impact of outbreaks.
Additional aids and appliances to facilitate discharge
Additional home support hours to facilitate early hospital to community transfers
Additional aids and appliances to facilitate early hospital discharges and ED avoidance
Mobile doctor service units to manage increase demand for home visits and facilitate ED avoidance
3 Low-level Domiciliary Rehab team in Limerick city to facilitate early discharge and ED avoidance
Added Triage nursing support in Shannondoc to support ED avoidance
Added SHOs and Registrar in UHL to assist in addressing workflow and improve PET times
Added HCA support in UHL to provide staffing at ward level to support additional surge patients
Purchasing of private community and acute beds to facilitate timely discharge and increase bed capacity
Added aids and appliances to assist in timely discharge
Development of frailty area to identify and facilitate early discharge
Added Registrars in EDs to support patient flow, reduce PET, increase rounding frequency and support non-
4 conveyance pathways
Added spend for improved medical cover
FIT Team funding
Discharge coordinator to facilitate patient flow processes
Additional medical, nursing, therapies support, pharmacy and lab staff to improve patient experience time,
improve senior clinical decision making, reduce length of stay, diagnostic time and to facilitate weekend
discharges
Comfort measures for ED Patients to improve PET
5
Additional HSCP input to mobilise patients and reduce length of stay
Purchase of Aids and Appliances to reduce delayed discharges
Provision of Step down beds to aid Patient Flow and reduce delayed discharges
National HSE Winter Plan 2019-20 16Winter Action Team Initiatives
Winter Action
Funded initiatives
Team
Added Senior decision maker in community to facilitate timely discharges
Additional Aids and Appliances to facilitate timely discharge
Additional transport for patients to reduce delayed transfers of care
Additional Cleaning, Phlebotomy, Admin support and Portering to improve PET
‘Transition to Care' bridging funding to reduce delayed transfers of care
6 Implementing Frail Intervention Therapy Team (FITT) for admission avoidance and reduce
admission of patients 75years+
Enhanced Home Support for the Integrated Care Team to reduce delayed transfers of care
Additional Flu testing kits to improve PET
Children's Health Ireland - Contribution to opening of 8 beds and discharge lounge to improve
PET in CHI
Enhanced OPRAH & Integrated Care to improve PET
Purchase of Private Nursing Home Beds to improve patients flow
Operation of Medical Ambulatory Care Suite to improve patient flow
Additional capital equipment to improve patient flow and improve patient egress
Additional staffing to improve patient flow and PET times
7
Enhanced COPD Outreach to improve patient flow and PET times
Access to offsite beds and supports to allow early discharge
Additional Aids and Appliances to improve patient egress
Added communications to facilitate admission avoidance
Additional staffing to improve PET and ensure service delivery
Increase diagnostic capacity (flu/CPE) to improve PET
Opening of surge bed to reduce the number of patients on trolleys
Additional aids and appliances to support rapid discharge, hospital avoidance and support
patient care
8 Implementation of Rapid Assessment Treatment to improve PET
Assistance with discharge team to improve bed turnaround
Discharge planning to facilitate hospital avoidance and timely discharge
Additional Adastra licenses to ensure service delivery
Communication to facilitate hospital avoidance and public health awareness
Improved Access to GPs for Diagnostics to reduce ED attendances
Increase Aids and Appliances to improve patient flow
9
Operation of Short Stay Unit & Discharge Lounge to improve patient flow
Increased access to short stay beds in private and public sectors to improve patient flow
National HSE Winter Plan 2019-20 17Winter Action Team Initiatives Funding Breakdown
Proposed breakdown of Winter Action Team Initiatives¹
WAT Area Population % of total population Allocated Budget
1 391,281 8.2% 558,753.93
2 453,109 9.5% 647,045.05
3 384998 8.1% 549,781.73
4 690,575 14.5% 986,149.33
5 510,333 10.7% 728,761.61
6 393,239 8.3% 561,549.98
7 697,644 14.7% 996,243.95
8 619,281 13.0% 884,340.65
9 621,405 13.0% 887,373.75
Total population 4,761,865 Total Budget 6,800,000.00
WAT Funding Submission to year end 2019
€469,125.82 €540,553.00
€564,545.00
€862,260.00
€548,900.00
€822,748.43
€916,000.00
€561,549.00
€640,921.00
WAT 1 WAT 2 WAT 3 WAT 4 WAT 5 WAT 6 WAT 7 WAT 8 WAT 9
¹ Population figures based on CSO Census 2016
National HSE Winter Plan 2019-20 18Appendix 1
Lessons Learned from Winter 2018-19 Patient Flow at post-admission
The 2018/2019 winter plan focused on nine hospital A range of patient flow strategies were deployed
sites with associated Community Health Organisations across all sites including extending Patient Flow /
(CHO). An integrated Winter Action Team (WAT) was Discharge Planning working hours, some sites
established on each site that reported to the National extending to seven days. Additional staff were
Winter Oversight Group. The key findings and recruited across all sites to assist patient flow (e.g.
recommendations of Winter 2018/2019 are as follows: additional Registrars, Cleaning & Portering Staff).
There was increased bed capacity available in public
Leadership and Governance
and private hospitals as well in the community,
The National Winter Oversight Group provided however there were recruitment challenges
leadership and governance for unscheduled care experienced on some sites to enable opening some of
during the winter period. Local leadership at the nine the funded beds. Some planned inpatient activity was
focus sites was provided by the WAT with site level curtailed to create capacity for emergency demand.
unscheduled care leads who were accountable for There was an integrated approach taken between sites
management of unscheduled care. The and the National Ambulance Service (NAS) to enable
recommendation is to extend this model to include all timely transport of patients from the acute sites.
hospital groups and CHOs involving aligning the WATs
Integrated Hospital and Community Services
with the CHO areas rather than individual sites.
There was good evidence of whole system
The approach taken by WATs should be maintained
engagement to ensure care was delivered in the most
throughout the year with a targeted focus on the full
appropriate setting in a timely manner delivering safe
winter period. Equally, there is a requirement for further
integrated care. Some WATs continued to operate
promotion and use of an agreed set of metrics to
following the completion of the focus period. There was
monitor, manage and evaluate operations across the
a visible presence of community stakeholders on
spectrum throughout this period. Communication
hospital sites. The targeted increase of home supports
channels should be strengthened by providing early
(n=550) was reached by end January 2019. There was
expert advice and information to the public on keeping
€4m allocated for additional aids and appliances which
well during winter and provide timely and accurate
aided timely discharge from hospitals. Further
public information on service activity and performance
development of an integrated approach should
throughout the winter.
consider aligning demand and capacity across the
Patient Flow at pre-admission patient continuum.
There was more timely and appropriate streaming of Using information to measure and monitor
patients at the point of access on acute sites. The performance improvement
introduction of Frailty Assessment Therapy (FIT)
The provision of data from Hospital Groups, Hospital
Teams had a big impact of across sites by using
Sites and CHOs was variable from hospitals and
admission avoidance strategies. Increased access to
limited from CHOs due to the lack of technology
Community Intervention Teams (CITs) was an enabler
capability. WAT updates were included in the daily
in both pre and post admission phases. Sites deployed
Situation Background Analysis Reports (SBAR). A
improved diagnostics access for hospitals and GPs
national dashboard was developed but due to the short
using insourcing, outsourcing strategies as well as
lead in time further work and validation was required.
available community capacity, including extending
Data from the BIU, SBAR, National Ambulance Service
laboratory services from five to seven days on some
(NAS) and Health Protection Surveillance Centre
sites. Additional senior medical decision makers and
(HPSC) was effective, measuring daily, weekly and
Health & Social Care Professionals were deployed to
monthly performance. There is a need to improve the
EDs and AMAUs on some sites which helped improve
availability of performance data to support real-time
patient experience times (PET) as well as admission
decision making and local and national level.
avoidance.
National HSE Winter Plan 2019-20 19You can also read