TEAM SUM NEW WORLD Parametric Insurance - Chin, Yong Herng Alvin Chua, Zhong Zhi Ho, Kai Heng Thomas Tan, Bing Hao Edgar - SOA.org
←
→
Page content transcription
If your browser does not render page correctly, please read the page content below
TEAM SUM
 Chin, Yong Herng Alvin
 Chua, Zhong Zhi
 Ho, Kai Heng Thomas
 Tan, Bing Hao Edgar

 Faculty Advisor:
 Asst Prof Zhu Wenjun

2021 Student Research Case Study Challenge
 NEW·WORLD Parametric Insurance
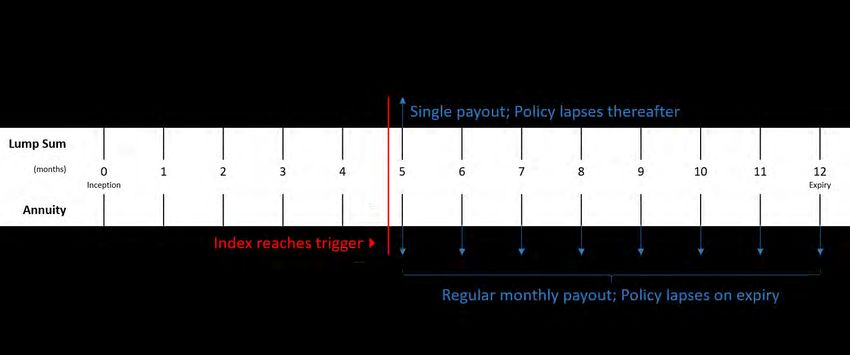
Table of Contents
Executive Summary 3

1. Objectives 4
 1.1 Protection gaps in traditional CI/TPD 4
 1.2 Target Market 4
 1.3 Insurability 4

2. Design Considerations 5
 2.1 Index Measure 5
 2.2 Triggering Event 5
 2.3 Product Design 6

3. Data Limitations and Assumptions 8

4. Implementation Plan 9
 4.1 Pricing model 9
 4.2 Marketing plan 13
 4.3 Implementation Timeline 13

5. Risk and Risk Mitigation Strategies 14

6. Sensitivity Analysis and Data Monitoring 16

7. Conclusion 17

References 18

Appendices 20
 Appendix A: Table illustrating difference between traditional and parametric insurance 20
 Appendix B: Derivation of Maximum Likelihood Estimators for Normal and Lognormal
 Models 22
 Appendix C: Jacque-Bera Test Statistic (Jacque and Bera, 1980) 23
 Appendix D: Items in voucher network scheme (Non-exhaustive) 24
 Appendix E: Assumptions in detail 25
 Appendix F: Simulation of interest rate (CIR model) 29
 Appendix G: Multinational corporations to collaborate with (Non-exhaustive) 30
 Appendix H: Sensitivity Analysis 31
 Appendix I: Timeline of product launch 32

 2

Executive Summary

Global health risks such as respiratory diseases and diabetes are often overlooked and
underinsured. To address these concerns, factors leading to the specified diseases can be
monitored and preemptive measures implemented to prevent their onset, rather than merely
reimbursing their losses. NEW·WORLD’s parametric solution would address economic losses
related to such risks in Ambernϊa and Palȍmϊnϊa.

PAIRM is a cutting-edge invention that would redefine the existing functions of parametric
insurance. It provides a payout if PM2.5 levels hit a predetermined trigger. Benefits provided
through vouchers on a lump sum or annuity basis to policyholders in an extensive network
scheme to purchase measures to reduce the risk of specified diseases.

The key risks that PAIRM faces as well as strategies to mitigate these risks were identified
before conducting a sensitivity analysis to determine the elements to which PAIRM is more
sensitive and hence NEW·WORLD should monitor.

 3

1. Objectives

1.1 Protection gaps in traditional CI/TPD

Traditional Total Permanent Disability (TPD) (Kagan, 2020) and Critical Illness (CI) (Kumok,
2019) policies provide a fixed sum assured payout upon diagnosis (Appendix A). They alleviate
the exorbitant medical expenses borne by policyholders, enabling them to undergo necessary
treatment. Many are inadequately protected financially for CI due to high premiums required,
indicating a protection gap (Heong, 2019). Furthermore, the time lag between diagnosis and payout
hinders its effectiveness as a protective measure.

1.2 Target Market

We believe that prevention is better than cure. Our parametric solution, PAIRM, complements
traditional CI/TPD products and would be sold to individual policyholders’ resident in Palȍmϊnϊa
and Ambernϊa with or intending to obtain CI coverage. By tying benefit payouts to PM2.5 indices
hitting a trigger, PAIRM enables policyholders to receive their payout faster, which allows them
to take swift action in protecting themselves against the onset of specified diseases.

1.3 Insurability

PAIRM has been tailored to ensure economic feasibility by controlling the frequency and severity
of payouts. The trigger level has been set such that any losses incurred are unlikely to be
catastrophic and will be reviewed regularly to account for updated information. The level of payout
has been set to defray the costs incurred by policyholders in mitigating the onset of specified
diseases.

 4

2. Design Considerations

2.1 Index Measure

We selected PM2.5 over PM10 as the former measures the concentration of finer particles, which
are deadlier as they penetrate deeply into the lungs, impairing their function. Studies have shown
significant correlation between fine particle pollutants and respiratory morbidity and mortality
(Xing, Y. F, et al., 2016), and that PM2.5 can induce oxidative stress in lungs, triggering insulin
resistance and increasing the risk of developing type 2 diabetes mellitus (O'Toole, 2017, Long et
al., 2019). The prevalence of respiratory diseases and diabetes increases by 2.07% (Xing, Y. F, et
al., 2016) and 1% (Pearson et al., 2010) respectively for every 10µg/m3 increase in PM2.5.

Thus, it is evident that policyholders would benefit from PAIRM, which enables them to take
actions that would prevent or delay the onset of respiratory diseases and diabetes (herein referred
to as “specified conditions”) when the PM2.5 indices rises beyond a particular limit.

Metrics such as average blood pressure and blood glucose levels are not selected to be index
measures as they reflect the effect of the trigger event (cardio-vascular disease and diabetes
respectively) and cannot be used as an index to predict the probability of occurrence. Other metrics
such as tobacco use and weight distribution are cohort-level trends which do not reflect global
trends.

2.2 Triggering Event

To obtain a distribution for the PM2.5 index, we used the Maximum Likelihood Estimation method
(Appendix B) to fit the PM2.5 indices for various countries (The World Bank, 2017) to Normal and
Log-normal distributions. Log-normal distributions were considered, as had been done in prior
research (Lu HC, et al, 2002), due to the non-negative nature of PM2.5.

As most countries’ indices had a higher likelihood under a Normal model, we opted to model the
PM2.5 indices of Palȍmϊnϊa and Ambernϊa using a Normal model. This choice was validated using
the Jarque–Bera test for normality (Jarque and Bera, 1980; Appendix C) from which we

 5
concluded, at a 5% significance level, that the indices for both countries followed a Normal
distribution.

 Assumption I: PM2.5 levels follows a Normal Distribution

Under these distributions, the trigger levels were chosen by determining the PM2.5 levels which
would have a 5% probability of being exceeded: 28.19µg/m3 and 10.88µg/m3 for Palȍmϊnϊa and
Ambernϊa respectively (Figure 1).

 Figure 1: Determining the trigger levels

2.3 Product Design

PAIRM is a single-premium policy renewable annually, which ensures that NEW·WORLD has
the option to revise the trigger level after at most one year.

Policyholders can choose between the two variations in the schedule of benefits (Figure 2): (1)
lump sum upon PM2.5 reaching the trigger level; and (2) annuity payable for each month during
which PM2.5 is above the trigger. Once the trigger is reached, benefits would be distributed to
policyholders as vouchers for various items to reduce the risk of contracting the specified
conditions (Appendix D).

 6

Figure 2: Schedule of Benefits - Lump Sum vs Annuity

Lump sum payouts can be used for one-off purchases of costlier equipment such as air purifiers
and treadmills, while annuity payouts can be used to purchase inventory items like masks and low-
sugar foods which need to be replenished periodically. Hence, PAIRM is able to cater to
policyholders’ needs and preferences.

The voucher scheme requires the establishment of an extensive network of third-party retailers and
pharmacists from whom policyholders can choose the items they want to purchase should the
trigger be reached. While developing this network, a temporary system of providing cash payouts
can be implemented. The eventual transition from cash to vouchers can be justified through a well-
connected network with a variety of appealing choices for policyholders.

 7
3. Data Limitations and Assumptions

In designing PAIRM, we used the Economic (CPI, Healthcare Spending per Person, and 3-Month
Interest Rates), Trigger (Air Pollution) and NEW·WORLD’s Financial Statements data. The
limitations of these data led to some key assumptions made, as summarised below.

 Data Limitation Impact Assumption (Appendix E)

 I Limited data Having 11 data points stifled our Worldwide PM2.5 index data
 timeframe for PM2.5. ability to obtain an accurate from the World Bank were
 distribution of PM2.5, This would used to approximate the
 affect the setting of trigger level. distributions for Ambernϊa
 and Palȍmϊnϊa.

 II Lack of indication of An accurate projection is GNI per person was
 movements on price required to encapsulate the projected based on a yearly
 index on forecasted relevant conditions during average; CPI taken at 2020
 data. PAIRM launch in Q4 2021. level as movement of
 inflation cannot be
 accurately determined.

 III Lack of updated data Difficulty in establishing the Use of the Cox-Ingersoll-
 for discount rates, discount rate for the pricing of Ross model to project the
 historical data accurate PAIRM. annual short rate for 2021
 as at the end of 2020. and beyond.

 IV The data provided was Incompatible for the pricing of Assumed an annual constant
 generally on an annual PAIRM, which can be triggered discount rate each year.
 basis. and repriced on a monthly basis.

 8
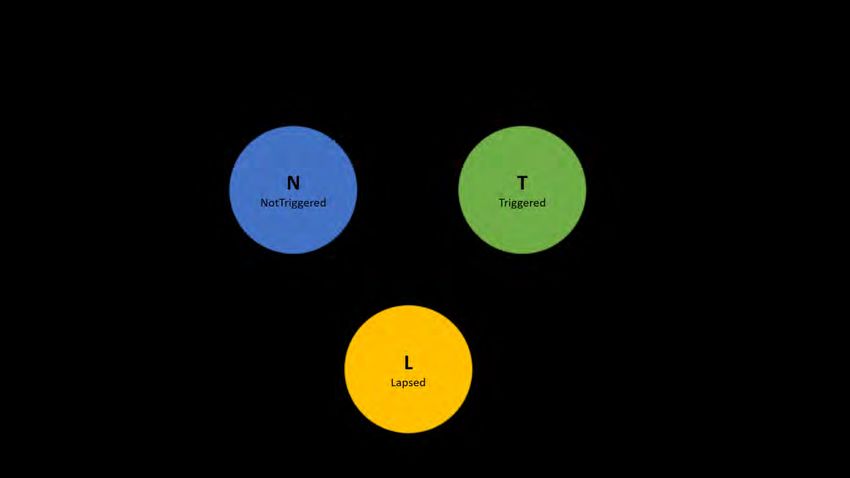
4. Implementation Plan

4.1 Pricing model

We performed a 5-year profit/loss projection for each policy. Our pricing model is a multi-
decrement model consisting of three states, namely NotTriggered, Triggered and Lapsed. Using
the assumption of a 5% probability of the index reaching the trigger level, the transition
probabilities between the states are as reflected in Figures 3 and 4.

 Figure 3: Monthly Transition Probabilities (Annuity Payout)

 9
Figure 4: Monthly Transition Probabilities (Lump Sum Payout)

The 2021 healthcare spending per person was projected by using the inflation-adjusted year-on-
year increase to determine the real healthcare spending. Thereafter, we determined the benefit
amount (Figure 5) through multiplying the 2021 projected healthcare spending by the proportion
of healthcare spending allocated to respiratory conditions in the US in 2013 (Cox, 2017).

 Figure 5: Summary of benefits per policy type

 Assumption II: Inflation rates for projection follow 2020 CPI levels

 10
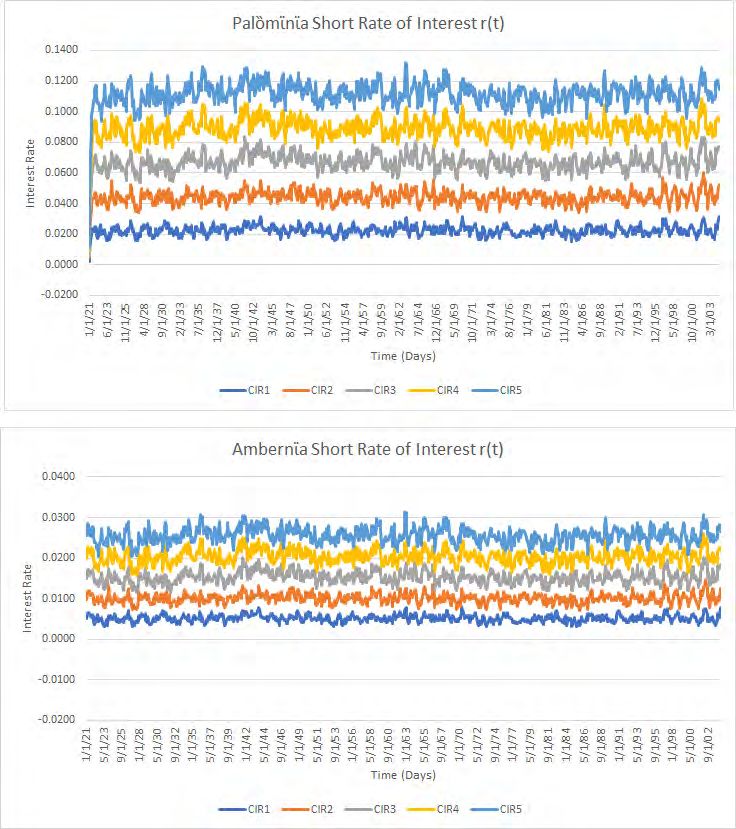
Expenses, valued at 10% of the single premium, were assumed to be uniformly distributed
throughout the year and incurred at the start of every month.

The expected cash-flows per policy in-force were determined as follows:
 ● Expenses = 10% * Premium * In-force policies [Pr(Triggered) + Pr(NotTriggered)]
 ● Benefits = 1000 * Pr(Triggered)

Fixing our profit margin ( ) at 10%, we calculated the single premium by using the

principle of equivalence (Profit = Premium - Expenses - Benefits).

The expected cash flows were discounted to calculate the present value. We determined the interest
rate based on the Cox-Ingersoll-Ross (CIR) short rate model, with mean and variance based on the
past 11 years’ 3-month interest rate, which is the short rate provided with the closest duration to
our yearly-renewable product. The CIR model is desirable due to the non-negativity constraint of
the model. Although negative interest rates were observed in Ambernϊa for the recent few years,
we expect that the rates will eventually revert back to the positive mean interest rate level. By
conducting 5 simulations, then taking the averages of the short rates, we determined the short rate
to be between 1.59% - 2.15% and 0.38% - 0.40% for Palȍmϊnϊa and Ambernϊa respectively
(Figure 6). Details of the CIR simulation are collected in Appendix F.

 Assumption III: CIR model to determine short rate model
 Assumption IV: Constant annual interest rate

 11
Figure 6: Forecasted interest spot rates

The single premium per 1000 payout for each policy type is summarized in Figure 7.

 Figure 7: Summary of premium amount per policy type

 12
The total expenses as a proportion of net assets of NEW·WORLD increased by 12.2%, from
0.2463 in 2019 to 0.2763 in 2020. The projected proportion of expenses/net assets in 2021 is 0.31.
By the principle of equivalence,

 Premiums = Reserves + [Expenses + Benefits + Profit]

Manipulating the equation to obtain the net assets,

 Net Assets = Premiums - Reserves = [Expenses + Benefits + Profit]

Therefore,
 Expenses / Net Assets = Expenses / [Expenses + Benefits + Profit]

All products have a proportion less than the projected proportion of 0.31 and will be suitable
additions to NEW·WORLD’s product mix (Figure 8).

 Figure 8: Summary of proportion of total expenses/net assets

4.2 Marketing plan

PAIRM would be marketed together with an existing base plan, targeting existing and potential
policyholders and alerting them to the potential health benefits of taking preventive measures.
Key partnerships with the national meteorological centres and environmental agencies will
enable NEW·WORLD to obtain real-time updates of PM2.5 indices, allowing policyholders to be
informed in a timely manner when the PM2.5 level hits the trigger. NEW·WORLD can publish a
catalogue of the products available for redemption through vouchers and their functions
(Appendices D and G) through social media.

4.3 Implementation Timeline

The implementation timeline for PAIRM can be found in Appendix I.

 13
5. Risk and Risk Mitigation Strategies

We summarized the risk analysis and the corresponding mitigation strategies in the table below.

 Risk Description Mitigation Strategies

 Basis Risk Majority of Palȍmϊnϊa and Ambernϊa We can collect data on diseases
 populations might have existing typically suffered by Palȍmϊnϊa and
 respiratory-related illnesses. Hence, Ambernϊa. Through this, we can
 PAIRM might not meet their medical understand the true healthcare needs of
 needs, as the index focuses on the population and create an index that
 prevention and not cure. reflects this better.

 Claims Risk Palȍmϊnϊa and Ambernϊa are subjected As external risks are hard to predict, it
 to catastrophic events such as hotspots is preferred to cede the catastrophic risk
 in neighbouring countries, resulting in to a reinsurer. Even though these events
 higher than expected claims. are rare, it can have a severe impact on
 profitability.

 Third Party Delays could be expected in To reduce the risk, we could present
 Risk establishing partnerships with them with statistics on the effectiveness
 pharmacies throughout Palȍmϊnϊa and of masks and air purifiers in reducing
 Ambernϊa, resulting in the misuse of the risk of contracting respiratory
 cash benefits by the policyholders, illnesses.
 where they purchase items unrelated
 prevention, defeating the purpose of
 PAIRM.

 14
Market Risk With the high level of PMI trigger, the Marketing initiatives can inform people
 public might not be incentivized to the benefits of our parametric insurance
 purchase PAIRM if they think payout product, reducing the market risk.
 is unlikely to occur.

 Moreover, a fall in demand for PAIRM
 could occur when the cash benefit is
 replaced with vouchers. This is due to
 the perceived decline in benefits from
 the public.

Risk Risk Severity
Likelihood
 Minor Moderate Major

Unlikely Claims Risk

Possible Basis Risk Market Risk

Likely Third Party Risk

 15
6. Sensitivity Analysis and Data Monitoring

We conducted sensitivity analysis on 4 main assumptions: Expense, Trigger Frequency, Lapse and
Interest Rate (Appendix H).

PAIRM was found to be most sensitive to deviations in trigger frequency, with a 30% higher than
expected trigger frequency resulting in the profit margin plummeting from 10% to -13.5% and -
14.2% for Palȍmϊnϊa and Ambernϊa respectively. This is a major concern for NEW·WORLD as it
increases the severity of insurance risk, the risk of greater-than-expected claims. NEW·WORLD
should hence monitor this closely in the initial phases and adjust the frequency assumptions as
required.

The profit margin of PAIRM is also sensitive to deviation in projected expenses, decreasing from
10% to 8.7% and 8.8% for Palȍmϊnϊa and Ambernϊa respectively if the expense ratio increases
from 10% to 16%. To monitor this, NEW·WORLD should keep track of the number of policies
sold in relation to projections, as well as the costs incurred per policy.

PAIRM is less sensitive to changes in lapse rates and interest rates. This is favourable for
NEW·WORLD and implies that the profit margin is rather insulated from these factors.

As we obtain more data and experience, we will refine our pricing methodology. With a greater
volume of granular data, we can more accurately fit a distribution to the PM2.5 levels and conduct
experience studies to analyse other parametric factors with high correlation with the specified
conditions. Should the experience differ markedly from initial assumptions, revision would be
necessary to maintain profitability and competitiveness, with priority placed on the more sensitive
expense and trigger frequency elements.

 16
7. Conclusion

PAIRM provides policyholders in Palȍmϊnϊa and Ambernϊa with a payout when PM2.5 indices
exceed the trigger. This provides them with the means to purchase preventive equipment such as
masks and air purifiers to mitigate the risk of contracting the specified conditions.

We believe that, by focusing on prevention rather than cure, PAIRM is a novel product that fills
an existing protection gap, and we hope that PAIRM will pave the way for the development of a
series of health-centric parametric insurance products.

 17
References

Cox, C. (2017, May 22). How much does the U.S. spend to treat different diseases? Retrieved
 March 07, 2021, from https://www.healthsystemtracker.org/chart-collection/much-u-s-
 spend-treat-different-diseases/#item-start

 Heong, S. (2019, October 10). 5 reasons why Many Singaporeans have a huge critical
 Illness PROTECTION GAP. Retrieved March 03, 2021, from
 https://dollarsandsense.sg/5-reasons-many-singaporeans-critical-illness-insurance-gap/.

Jarque, C. and Bera, A. (1980) Efficient tests for normality homoscedasticity and serial
 independence of regression residuals, Econometric Letters, 6, 255–259.

Kagan, J. (2020, July 6). Total Permanent Disability (TPD). Retrieved March 04, 2021, from
 https://www.investopedia.com/terms/t/total-permanent-disability-tpd.asp.

Kumok, Z. (2019, June 30). Critical Illness Insurance: What Is It and Who Needs It? Retrieved
 March 04, 2021, from https://www.investopedia.com/articles/personal-
 finance/010416/critical-illness-insurance-who-needs-it.asp.

LIA, (2019). LIA CRITICAL ILLNESS (CI) FRAMEWORK 2019. Retrieved from
 https://www.lia.org.sg/media/2160/mu5819-part-2-of-4-_lia-ci-framework-2019_lia-
 definitions-for-37-cis.pdf

Long, M., Zhang, C., Xu, D., Fu, W., Gan, X., Li, F., . . . Xu, D. (2019, October 08). PM2.5
 aggravates DIABETES via the SYSTEMICALLY activated il-6-mediated
 STAT3/SOCS3 pathway in rats' liver. Retrieved March 04, 2021, from
 https://www.sciencedirect.com/science/article/pii/S0269749119307146.

Lu HC, Fang GC. Estimating the frequency distributions of PM10 and PM2.5 by the statistics of
 wind speed at Sha-Lu, Taiwan. Sci Total Environ. 2002 Oct 21;298(1-3):119-30. doi:
 10.1016/s0048-9697(02)00164-x. PMID: 12449333.

 18
O'Toole, T. (2017). The mechanisms of pm2.5 influence on insulin resistance. Retrieved March
 04, 2021, from https://www.niehs.nih.gov/research/supported/sep/2017/insulin-
 resistance/index.cfm#:~:text=NIEHS%20grantees%20found%20that%20short,in%20the
 %20development%20of%20diabetes.

Pearson, J., Bachireddy, C., Shyamprasad, S., Goldfine, A., & Brownstein, J. (2010, October 01).
 Association between fine particulate matter and diabetes prevalence in the U.S. Retrieved
 March 04, 2021, from https://care.diabetesjournals.org/content/33/10/2196.

The World Bank. (2017). PM2.5 air pollution, mean annual exposure (micrograms per cubic
 meter). Retrieved March 04, 2021, from
 https://data.worldbank.org/indicator/EN.ATM.PM25.MC.M3.

Xing, Y. F., Xu, Y. H., Shi, M. H., & Lian, Y. X. (2016). The impact of PM2.5 on the human
 respiratory system. Journal of thoracic disease, 8(1), E69–E74.
 https://doi.org/10.3978/j.issn.2072-1439.2016.01.19.

 19
Appendices

Appendix A: Table illustrating difference between traditional and parametric insurance

 Predictor of/ Traditional (Prescriptive) Parametric (Preventive)
 Health Risk
 Triggering event(s) Payout Triggering event(s) Payout

 Cardio-vascular Hypertension Rise in hypertension
 disease. (eg. High (Systolic > 140 m prevalence
 blood pressure) Hg, diastolic > 90mm
 Hg)

 Diabetes Rise in blood sugar Critical Illness plan Rise in PM2.5 indices On a lump sum basis (small
 level (> 200 mg/DL) provides lump sum pay- --- OR --- amount sufficient to provide
 out on diagnosis Increase in diabetes for preventive measures)
 prevalence/ blood sugar
 levels

 End Stage Lung Diagnosis of End A lump-sum payout of PM2.5 indices reaching ● PM2.5 indices in
 Disease/Chronic Stage Lung Disease 100% of the sum 28.19 and 10.88 (5% right- Palȍmϊnϊa and Ambernϊa
 obstructive (LIA, (2019)) assured will be made to tail probability) for obtained from population
 pulmonary disease the policyholder Palȍmϊnϊa and Ambernϊa weighted concentration
 respectively.

 20
● On a lump sum basis
 (small amount sufficient
 to provide for preventive
 measures) eg. masks, air
 purifiers.

Lung cancer, ARI Future possible Lung cancer, ARI ● Second hand smoke
(Acute Respiratory consideration: (Acute Respiratory inhaled increases the
Infections) Proportion of Infections) chance of respiratory
 smokers in age group diseases
 ● Triggered when high
 proportion of smokers in
 that age group which may
 indicate health risks

 21
Appendix B: Derivation of Maximum Likelihood Estimators for Normal and Lognormal
Models

Normal Model

Lognormal Model

Summary of Results

 Model with higher log-likelihood Count Percentage

 Normal 161 67.08%

 Lognormal 79 32.92%

 Total 240 100.00%

 22
Appendix C: Jacque-Bera Test Statistic (Jacque and Bera, 1980)

The detailed calculations behind Appendices B and C can be found here: (MLE and JB analysis on
PM2.5.xlsx)

 23
Appendix D: Items in voucher network scheme (Non-exhaustive)

 Preventive Respiratory Disease Diabetes
 measure

 Monitor risk ● Radon test kit ● Weighing scale
 ● Arsenic water test kit ● Step tracker
 ● Thermometer ● Blood pressure monitor
 (Manual/Automatic)
 ● Weight-loss & diet planner

 Reduce/eliminate ● Surgical Masks ● Healthy foods (eg. whole
 risk ● Air purifier and dehumidifier grains, high fiber foods like
 ● Hand sanitisers and wet wipes fruits and vegetables)
 ● Off the counter supplements
 (eg. vitamin D, probiotics)
 ● Exercise equipment (eg.
 treadmill, yoga mat, weights)

 24
Appendix E: Assumptions in detail

 Section Assumption with rationale and analysis

 2.2 Distribution of PM2.5 data
 We assumed that Worldwide PM2.5 data from various countries can be used as a proxy to determine a suitable distribution for
 Palȍmϊnϊa and Ambernϊa. Yet a normal distribution allows for negative values of PM2.5 which is not possible. The geography
 and landscape of these countries may also affect the distribution of PM2.5, and is included as one of the risk factors we
 considered (Section 5). The tail end probability would affect the PM2.5 limit since we set a 5% significance level, a low but not
 improbable event chance of happening. Setting a limit that’s too low could result in higher losses as more than expected claims
 are made (ie probability is actually more than 5%), while a limit that’s too high (ie probability is actually less than 5%) would
 lead to basis risk and dissatisfaction of policyholders. Furthermore, our sensitivity analysis showed that PAIRM was most
 sensitive to changes in trigger frequency, hence this variable needs to be monitored closely.

 A normal distribution was chosen after conducting the MLE estimation and that an overwhelming majority of countries’ data
 follow a normal one. Any unexpected risks have to be mitigated as elaborated in Section 5.

 25
4.1 Profit margin
 We deemed a 10% profit margin to be appropriate as a reasonable benchmark to determine how much to charge. This is to
 ensure sustainability of the product and that it is a profit making product that can be added to the product mix of the company.
 This profit margin was decided based on industry averages of about 9.6% for life insurance companies.

 Trigger frequency
 We assumed a 5% frequency of hitting the index. This tail end probability was deemed to be appropriate because of the severity
 of being able to cause significant respiratory issues and diabetes. It is estimated that 3% of cardiopulmonary and 5% of lung
 cancer deaths are attributable to PM2.5 globally (Xing, Y. F, et al., 2016), and further described in Section 2.1. Since the total
 impact can be estimated by frequency * severity, by factoring a 5% frequency rate could result in a proportionate decrease in the
 total impact caused by PM2.5 .

 Lapse Rate
 We assumed a 10% lapse rate from NonTriggered (NT) to Lapse (L) and 1% lapse rate from Triggered (T) to Lapse (L). This
 includes a) mortality (death), b) withdrawal from the policy and c) contracting an illness before the preventive measure is
 required. It is 10 times higher for NT to L than T to L as those in T state most likely wouldn’t b) withdraw since they are already
 receiving benefits and c) is irrelevant because they are already receiving the benefits. 10% is deemed reasonable as due to
 changes in trigger levels and other unforeseen circumstances, we overestimate the lapse frequency, to provide a conservative
 estimate for the premiums.

 26
Healthcare spending
The proportion of healthcare spending allocated to respiratory disease is an estimate of what people spend on products. There are
perhaps others classified as ‘Others’ or ‘Miscellaneous’ but can be used as a good proxy. Some of these expenses would include
medical expenses which are part of the payout which traditional insurance covers. However, we believe that these two effects
cancel one another, as the over accounted medical bills approximately equals the unaccounted medical equipment.

Interest Rate
We assumed a long term mean reversion based on the past 11 years of data provided and a 0.33 drift term to model the interest
rates based on 5 simulations. It is also affected by inflation rate, and it is accounted for by adjusting the nominal interest rates to
real rates before the simulation. The lack of data could result in an inaccurate long-term mean, affecting interest rates.

Inflation
Inflation for both countries has a generally increasing trend, and we did not want to overcomplicate matters by projecting future
inflation rates as shown in the figure below. It is influenced by factors such as the spare capacity of the economy and the relative
value of its currency which we do not have the data for. We made a simple assumption to take the most recent (2020) inflation
rate to account for all future cash flows within our pricing model, to account for the differences between real and nominal cash
flow values.

 27
Expenses
 We assumed a 10% loading factor for expenses on the premiums. These are variable expenses which include commissions,
 distribution costs, agency fees, etc. These expenses vary based on the number of policies sold.

A detailed model with calculations for the pricing model can be found here: (Pricing Model with Sensitivity Analysis.xlsm)

 28
Appendix F: Simulation of interest rate (CIR model)

 29
Appendix G: Multinational corporations to collaborate with (Non-exhaustive)

 Type Companies

 Pharmaceuticals ● Pfizer
 ● Moderna

 Medical Devices ● Johnson & Johnson
 ● Abbott Laboratories

 Supermarkets/Food retail ● Walmart
 ● Nestle
 ● Unilever
 ● P&G

 Electronics and fitness ● Fitbit
 ● Carrot

 + Local health and wellness companies and pharmaceuticals

 30
Appendix H: Sensitivity Analysis

Palȍmϊnϊa

Ambernϊa

 31
Appendix I: Timeline of product launch

 32
You can also read