Modern Slavery Statement Disclosure Quality - ASX100 Companies Research brief - Monash ...
←
→
Page content transcription
If your browser does not render page correctly, please read the page content below

Research brief

Modern Slavery Statement
Disclosure Quality
ASX100 Companies
MONASH CENTRE FOR FINANCIAL STUDIES

NGA PHAM, PhD, CFA.
BEI CUI, PhD
UMMUL RUTHBAH, PhD                    05 August 2021
                                                   1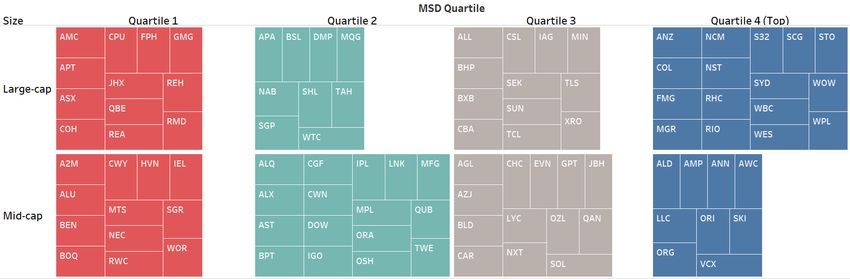
Key findings

                         There is a wide dispersion in terms of the disclosure quality of the Modern Slavery Statements 2020
                         submitted by S&P/ASX100 companies.
                         Companies with the best modern slavery disclosure scores are Woolworths, Fortescue Metals,
                         Wesfarmers, Westpac, and Ansell. Companies with weak disclosure scores include IDP Education,
                         Fisher & Paykel Healthcare, Cleanaway, Resmed and Nine Entertainment.
                         Large companies with large number of employees and big supply spend scored well on modern
                         slavery disclosure quality.
                         Good modern slavery statements showed a history of continued effort in managing modern slavery
                         and other human rights issues.
                         The most common specific modern slavery risks assessed and mentioned by the companies are
                         forced labour, child labour and debt bondage.

                                                                                                             This version is dated
                                                                                                             05 August 2021.

MONASH CENTRE FOR FINANCIAL STUDIES                                                                                              2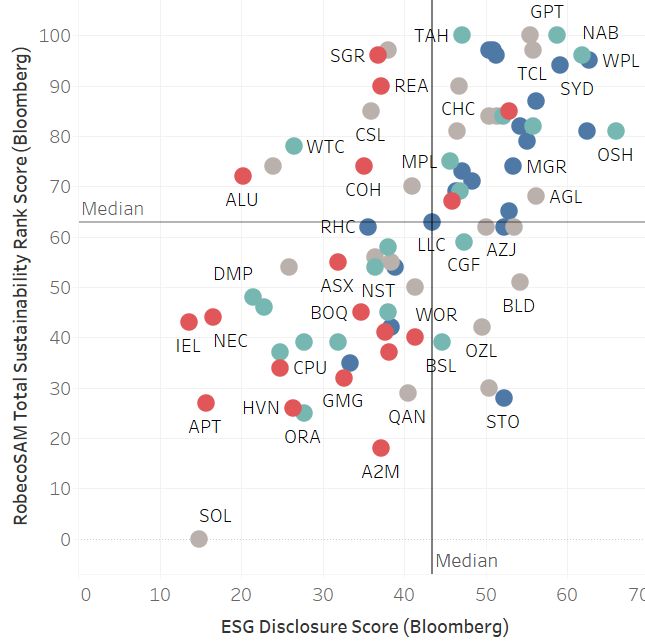
Modern Slavery Disclosure (MSD) scores
         S&P/ASX100 companies
                           Ticker   TOTAL                                   Ticker   TOTAL                                     Ticker TOTAL                                   Ticker TOTAL
Reporting entity name                     RANK   Reporting entity name                      RANK   Reporting entity name                    RANK   Reporting entity name                   RANK
                           (ASX)    SCORE                                   (ASX)    SCORE                                     (ASX) SCORE                                    (ASX) SCORE
WOOLWORTHS                 WOW      85.01   1    TELSTRA                    TLS       65.42  26    MAGELLAN FINANCIAL GROUP MFG       61.36  51    ASX                        ASX    50.59  76
FORTESCUE METALS           FMG      84.96   2    CHARTER HALL               CHC       65.30  27    ORORA                       ORA    61.04  52    BANK OF QUEENSLAND         BOQ    50.32  77
WESFARMERS                 WES      83.48   3    BORAL                      BLD       65.25  28    DOWNER EDI                  DOW    60.94  53    REECE                      REH    50.32  78
WESTPAC BANKING            WBC      83.26   4    QANTAS                     QAN       65.11  29    ATLAS ART                   ALX    60.63  54    METCASH LTD                MTS    50.12  79
ANSELL                     ANN      80.73   5    CARSALES.COM               CAR       65.11  30    NATIONAL AUSTRALIA BANK LTD NAB    60.38  55    ALTIUM                     ALU    49.25  80
NEWCREST MINING            NCM      75.60   6    BHP GROUP                  BHP       64.95  31    WISETECH GLOBAL             WTC    60.05  56    HARVEY NORMAN HOLDINGS LTDHVN     49.05  81
ANZ                        ANZ      73.16   7    JB HI-FI                   JBH       64.86  32    BLUESCOPE STEEL             BSL    60.05  57    JAMES HARDIE               JHX    48.62  82
RIO TINTO                  RIO      71.30   8    XERO                       XRO       64.62  33    DOMINO'S PIZZA ENTERPRISES DMP     59.91  58    GOODMAN                    GMG 46.57     83
LENDLEASE                  LLC      70.95   9    LYNAS RARE EARTHS LTD      LYC       64.22  34    MACQUARIE                   MQG    59.76  59    AMCOR PLC                  AMC    46.42  84
SANTOS                     STO      70.61  10    COMMONWEALTH BANK OF AUSTRALIA
                                                                            CBA       64.16  35    TABCORP                     TAH    59.38  60    STAR ENTERTAINMENT         SGR    46.18  85
RAMSAY HEALTH CARE         RHC      70.35  11    SUNCORP                    SUN       63.97  36    MEDIBANK PRIVATE            MPL    59.12  61    AFTERPAY                   APT    44.53  86
WOODSIDE PETROLEUM         WPL      70.04  12    MINERAL RESOURCES          MIN       63.80  37    IGO                         IGO    58.57  62    BENDIGO AND ADELAIDE BANK BEN     44.51  87
COLES                      COL      69.43  13    CSL                        CSL       63.51  38    APA GROUP                   APA    57.89  63    A2 MILK CO                 A2M    44.16  88
ALUMINA LTD                AWC      68.92  14    ARISTOCRAT                 ALL       63.24  39    INCITEC PIVOT               IPL    57.80  64    RELIANCE WORLDWIDE         RWC    44.11  89
VICINITY CENTRES           VCX      68.75  15    AURIZON HOLDINGS           AZJ       63.16  40    STOCKLAND                   SGP    56.93  65    QBE INSURANCE GROUP        QBE    43.57  90
MIRVAC                     MGR      68.71  16    SEEK                       SEK       62.80  41    CROWN RESORTS               CWN    56.54  66    WORLEY                     WOR 43.06     91
SCENTRE                    SCG      68.54  17    AGL                        AGL       62.58  42    SONIC HEALTHCARE            SHL    55.41  67    COMPUTERSHARE              CPU    41.91  92
AMP                        AMP      67.87  18    NEXTDC                     NXT       62.51  43    TREASURY WINE ESTATES       TWE    54.44  68    REA GROUP                  REA    39.91  93
AMPOL                      ALD      67.82  19    OZ MINERALS                OZL       62.19  44    AUSNET                      AST    54.04  69    COCHLEAR                   COH    30.37  94
SOUTH32                    S32      67.68  20    WASHINGTON H. SOUL PATTINSON
                                                                            SOL       61.98  45    LINK ADMINISTRATION         LNK    53.31  70    NINE ENTERTAINMENT         NEC    22.69  95
ORIGIN ENERGY              ORG      66.78  21    TRANSURBAN                 TCL       61.84  46    BEACH ENERGY                BPT    52.89  71    RESMED                     RMD    21.81  96
SPARK INFRASTRUCTURE GROUP SKI      66.76  22    EVOLUTION MINING           EVN       61.71  47    CHALLENGER                  CGF    52.14  72    CLEANAWAY                  CWY    19.60  97
SYDNEY AIRPORT             SYD      66.48  23    GPT                        GPT       61.57  48    ALS                         ALQ    52.09  73    FISHER & PAYKEL HEALTHCARE FPH    14.74  98
NORTHERN STAR              NST      65.70  24    INSURANCE AUSTRALIA        IAG       61.45  49    QUBE                        QUB    51.92  74    IDP EDUCATION LTD          IEL    10.00  99
ORICA                      ORI      65.64  25    BRAMBLES                   BXB       61.37  50    OIL SEARCH LTD              OSH    50.89  75

         MONASH CENTRE FOR FINANCIAL STUDIES                                                                                                                                         3
Key recommendations
For companies                                    For investors                                       For regulators
• The scoping of risk should be clear and the    •   Investors should engage with the portfolio      •   The government should strengthen the Act
  assessment of modern slavery risk should be        companies in the following areas:                   and harmonise the reporting requirements
  done in respect of specific risks.                                                                     under the Commonwealth Act and the New
                                                        • improving the disclosure quality of
• Exposure to modern slavery risk should be                 Modern Slavery Statement                     South Wales Act.
  assessed based on the demographics of the
  suppliers, economic size of supply spend and          • communicating with companies about         •   Improve the timeliness of the release of the
  the nature of the transactions.                           investors’ concerns of specific areas        statements submitted on the register
• Due diligence and remediation process needs               of modern slavery risks relevant to      •   Despite a clear prescription of seven
  to be strengthened.                                       each company or each sector                  mandatory reporting criteria, reporting
• The reporting entity should describe how it           • enhancing companies’ due diligence             quality of the 2020 statements differs
  assesses the effectiveness of modern slavery              and remediation process, and                 substantially. The regulators need to review
  risk management in terms of who is                                                                     the quality of the Modern Slavery Statements
                                                        • ensuring that the ultimate
  responsible, what to assess, and how/how                                                               submitted and provide more reporting
  often it will be.                                         responsibility to oversee modern
                                                                                                         guidance to ensure consistency.
                                                            slavery and human rights risks belong
• Engagement and education of suppliers is the                                                       •   More guidance is needed for companies to
  key to mitigate risks in the supply chain.                to the Board.
                                                                                                         improve their remediation mechanisms and
• Companies should focus time and resources      •   Investors can recommend best practices of
                                                                                                         process.
  on areas of possible influence rather than         modern slavery disclosure.
  areas of general concerns.                                                                         •   The government should adopt a holistic
                                                 •   Investors should continue to play a proactive
                                                                                                         approach incorporating the reporting
• Case studies or examples help illustrate           role in engaging with regulators to ensure
  specific risks and how the company has                                                                 requirements, compliance monitoring and
                                                     investors’ and companies concerns are
  identified incidences and addressed them.                                                              non-compliance consequences.
                                                     considered.
• Collaboration with peers and engagement                                                            •   The government should continue to engage
  with investors and regulators is encouraged                                                            with companies and investors.
  to leverage possible influence and learning.

MONASH CENTRE FOR FINANCIAL STUDIES                                                                                                             4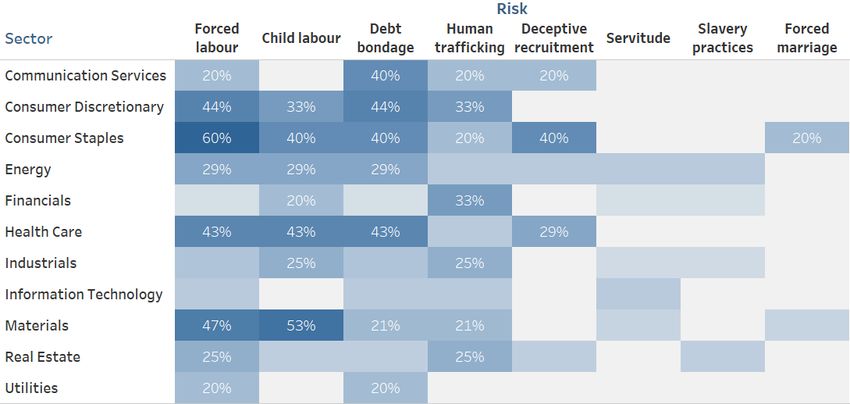
Modern Slavery
Modern slavery is a global phenomenon with 40.3 million       The Australian Act is not the first of its kind. Two notable
victims currently and $354 billion at-risk products           predecessors are the United Kingdom’s Modern Slavery Act
imported by G20 countries, according to the Walkfree          (2015) and the California Transparency in Supply Chains Act
Foundation (2018). It is a problem that also is present       (2010).
within Australia with approximately 1,567 victims             More recent regulatory regimes include the New South
nationally.                                                   Wales’ Modern Slavery Act (2018), the French Corporate
The Commonwealth Modern Slavery Act (2018)                    Duty of Vigilance Law (2017) and the Netherlands’ Child
                                                              Labour Due Diligence Law (2019).
The Australian Government passed the Commonwealth
Modern Slavery Act in 2018 (the Act). The Australian          The Act provides eight types of exploitation that meet the
government defines modern slavery as circumstances            definition of modern slavery. They are:
where “coercion, threats or deception are used to exploit      • trafficking in persons;
victims and undermine or deprive them of their freedom”.       • slavery;
Therefore, modern slavery applies to a situation of greater    • servitude;
severity than mere substandard working conditions or           • forced marriage;
underpayments of workers.                                      • forced labour;
Australia’s Modern Slavery Act (2018) requires entities        • debt bondage;
based, or operating, in Australia, with an annual              • deceptive recruiting for labour or services; and
consolidated revenue of more than A$100 million, to report     • the worst forms of child labour.
on the risks of modern slavery in their operations and        The worst forms of child labour refers to slavery practices
supply chains and actions.                                    or hazardous work involving children.

MONASH CENTRE FOR FINANCIAL STUDIES                                                                                          5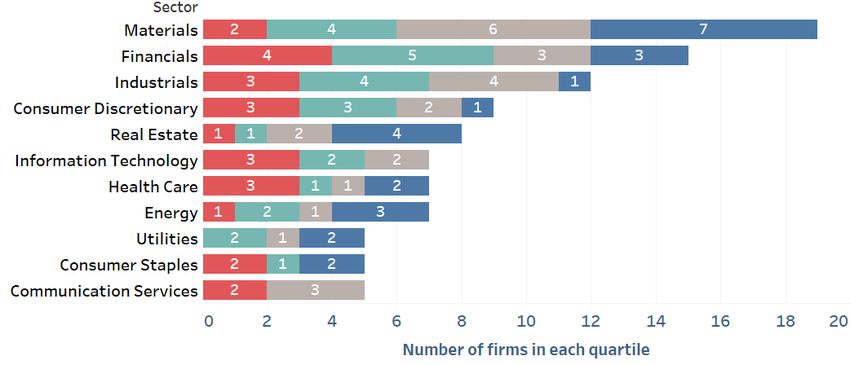
Modern Slavery Act                                              Criterion 1   • Identify the reporting entity

Unlike previous Acts, Australia’s Commonwealth Act
                                                                              • Describe the reporting entity’s structure,
(2018) is more prescriptive in terms the submission             Criterion 2
                                                                                operations and supply chains
process and mandatory reporting criteria.
Specifically, the Commonwealth Act (2018) requires that                       • Describe the risks of modern slavery
all statements be submitted to the Australian Border                            practices in the operations and supply chains
                                                                Criterion 3
                                                                                of the reporting entity and any entities the
Force within six months after the end of the reporting
                                                                                reporting entity owns or controls
period. All submitted statements are uploaded to a public
registry maintained by the Australian Border Force.                           • Describe the actions taken by the reporting
The Act’s guidance document prescribes seven                                    entity and any entities that the reporting entity
                                                                Criterion 4     owns or controls to assess and address these
mandatory reporting criteria for the statements. (See                           risks, including due diligence and remediation
aside)                                                                          processes
The Act’s guidance for the reporting entities provides
                                                                              • Describe how the reporting entity assesses
clear examples and explanations as to why each of these
                                                                Criterion 5     the effectiveness of actions being taken to
criteria is required, and what information to report and                        assess and address modern slavery risks
how to report.
The guidance defines ‘risks of modern slavery practices’                      • Describe the process of consultation with any
                                                                Criterion 6
as “the potential for your entity to cause, contribute to, or                   entities the reporting entity owns or controls
be directly linked to modern slavery through its
operations and supply chains”.
                                                                Criterion 7   • Any other relevant information

MONASH CENTRE FOR FINANCIAL STUDIES                                                                                            6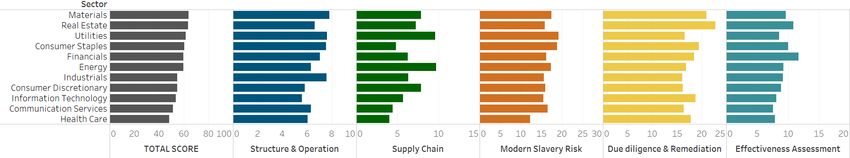
Modern Slavery Disclosure Score
Scoring methodology

                   This research project focuses on the              Statements were collected from the
                   disclosure quality of the modern                  Modern Slavery Register of the Australian
                   slavery statements submitted by the               Border Force.
                   100 largest listed companies on the
                   Australian Stock Exchange - ASX100

    99             companies for the FY2020.                         Statements were read, scored and
                                                                     reviewed according to the scoring
                   The analysis covered 99 statements                template with five sub-scores.
  statements       available by 30th June 2021.
                   Please be advised that this is not an             Statements were ranked by the total MSD
                   assessment of the company’s modern                score.
                   slavery risk.

                                                           Notes:
Please see Appendix 1 for the scoring template.            Among the 100 constituents of S&P/ASX100 as at 30th June 2021,
                                                           Endeavour Group (EDV) was demerged from WoolWorths and
                                                           became listed on 24/06/2021. The 2020 modern slavery statement of
                                                           EDV was the same as Woolworths’ statement.
                                                           For Oil Search Ltd (OSH), the statement was dated 2019 but the
                                                           disclosure note says that the statement was prepared for the
                                                           reporting period ending 31 Dec 2020. OSH has not published any
                                                           other modern slavery statement.
                                                           For Alumina Ltd (AWC), we scored the group’s 2020 statement,
                                                           prepared by Alcoa Australia, as AWC did not submit its statement.
MONASH CENTRE FOR FINANCIAL STUDIES                                                                                            7
Modern Slavery Disclosure Score (cont.) Scoring framework MONASH CENTRE FOR FINANCIAL STUDIES 8
S&P/ASX100 companies in MSD Score Quartiles

Exhibit 1: Statements by quartile

MONASH CENTRE FOR FINANCIAL STUDIES           9
MSD Score Distribution
Panel A - Subscores
                                       Quartile Quartile Quartile Quartile Max possible   • Large firms in terms of number employees
                                              1        2        3 4 (Top)     score         and large supply spend tend to score well
Structure & operation disclosure           5.2      7.0      7.3      8.0      10           on their modern slavery disclosure.
Supply chain disclosure                    3.6      6.3      8.0      9.4      15
                                                                                          • Firms having a big number of suppliers and
Modern slavery risk disclosure            11.4     17.0     17.3     19.7      30
                                                                                            large supply spend appeared to score well
Due diligence & remediation disclosure    13.7     17.5     20.8     21.9      25           on their statements.
Effectiveness assessment                   5.8      9.3     10.0     12.9      20
Total Disclosure Quality Score            39.7     57.1     63.5     71.9      100        • Scores were rewarded for more detailed
                                                                                            assessment of specific risks.
                                                                                          • Scores were also rewarded for disclosing
                                       Quartile Quartile Quartile Quartile
 Panel B - Firm characteristics                                                             policies relevant to governance and modern
                                              1        2        3 4 (Top)                   slavery risks.
 Number of firms                            24       25       25       25
 Market cap ($B)                         14.14    12.87    32.84    30.37
 Number of employees (median)            4,000    4,250    4,534 10,149
 Number of suppliers (median)            2,000    3,000    2,500    4,000                 Please note that unless a median is specified,
 Supply Spend ($B)                        0.55     2.17     2.79     7.28                 values reported are average.
 Number of specific risks disclosed       0.83     1.28      2.2     2.48
                                                                                          Data source: Market cap ($B), extracted from
 Number of policies disclosed             4.33     5.16     5.08     5.28
                                                                                          Bloomberg, as of 30 June 2021.
Exhibit 2: MSD score and firm characteristics by quartile                                 Other data points were extracted from the
                                                                                          companies’ Modern Slavery Statements and
                                                                                          our analysis.
MONASH CENTRE FOR FINANCIAL STUDIES                                                                                                      10
MSD survey
Section 1
Reporting major operation sites 91%
Reporting number of employees 91%
Overall observations Reporting key inputs
Reporting consultation process
62%
71%
Reporting number of suppliers 75%
Section 2
Reporting supply dollar spend
• Most firms reported well on structure, major operational 45%
Reporting suppliers in tier 37%
sites and number of employees.
Reporting number of suppliers by country 25%
• While 75% of statements reported the number of suppliers, Reporting supply spend by country 29%
less than half of them reported the supply spend and less Reporting supply spend spend by major categories 26%
than a third segmented their suppliers or supply spend by Establishing a designated team 77%
country/region/category. Using an independent consultant 36%
Section 3
Describing the overall modern slavery risk 56%
• 77% of firms surveyed mentioned that a designated team Assessing and reporting specific risks 62%
has been established and more than 36% also used an Reporting risks potentially caused by the firm 51%
external consultant or expert for their modern slavery and Reporting risks potentially contributed to by the… 80%
other human rights risk management. Reporting risks potentially related to the firm 67%
Describing due diligence process
• While 56% provided an evaluation whether modern slavery 92%
Section 4
Describing remediation process 68%
risk is not relevant/ low/ medium/ high, only 62% assessed
Describing supplier assessment resources 83%
at least one of the eight specific modern slavery risks. Reporting training conducted 73%
• Most firms described their due diligence process. Assessing effectiveness: "who is responsible" 55%
However, only 68% reported on remediation. Even for Assessing effectiveness: "what to assess/review" 92%
those that did, much improvement is needed.
Section 5
Assessing effectiveness: "how/how often" 51%
Good detail provided on assessment activities 63%
• 73% of firms surveyed reported they had conducted Specific KPIs provided 17%
training for employees and/or suppliers in 2020. Specific examples/case studies provided 39%
• Only 17% provided specific KPIs for effectiveness Collaborating with external bodies 45%
assessment.
MONASH CENTRE FOR FINANCIAL STUDIES Exhibit 3: Selected information from the surveyed statements 11The strong vs. weak statements
What are the best practices? What are the issues?
Best Modern Slavery Statements provided: Common issues of bottom-ranked statements include
• a clear description of the supply chain in terms of the • poor description of the supply chain, leading to unclear
suppliers by number, dollar spent, regions and countries, understanding of the source of exposure to risks,
• clear information about employees and details of number • risk assessment discussing modern slavery risk in
of direct hires, labour hire contracts, and the coverage of general, failing to examine the specific risks that are
Enterprise Agreements, relevant to the firm,
• clear scoping of risk (based on materials/goods/services • unclear description of governance structure to manage
bought, or location of suppliers) and assessment of risk modern slavery risks (oversight body not specified, due
level, diligence inadequately covering screening, selecting,
• substantial discussion of specific modern slavery risks onboarding new suppliers and reviewing existing
that are more relevant to the firm suppliers),
• a systematic approach to assess supplier risks, such as a • unclear description of remediation process (grievance
supplier risk assessment matrix using various mechanisms and guidelines for following up),
demographic and economic criteria related to suppliers as • incomplete picture of how the company assesses its own
well as nature of contract (one off purchase order vs. effectiveness of these actions in respect of who/what/how
multiple-year contract) often and how to assess,
• information of supplier audits done, issues identified, and • no specific KPIs, and
if they are resolved, plan of further audits, and • a lack of understanding of available resources and tools to
• a clear set of KPIs for effectiveness assessment. learn about relevant risks and assess risks.
MONASH CENTRE FOR FINANCIAL STUDIES 12Sectoral analysis of modern slavery risks Exhibit 4: Total score and sub-scores by sector Materials, Real Estate and Utilities were the top three sectors It should be also noted that firms in the Utilities and Consumer in terms of the total MSD score. Staples sectors scored well with the subsection on disclosing Health Care firms ranked the bottom as they scored low in modern slavery risks. describing their supply chain, modern slavery risk and Financial firms like banks and investment companies scored assessment of effectiveness. well on disclosing how they assess their effectiveness of Among the sectors, there was a higher dispersion of the sub- modern slavery risk management. score for Section 2 on supply chain than other sub-scores. MONASH CENTRE FOR FINANCIAL STUDIES 13
Sectoral analysis of modern slavery risks

                                            Being the largest sector in terms
                                            of the number of firms, Materials
                                            is also the sector with the most
                                            firms having their statement in
                                            the top quartile.
                                            More than half of the statements
                                            of firms in Financials, Industrials,
                                            Consumer Discretionary, IT and
                                            Health Care belonged to the
                                            bottom two quartiles.
                                            No Communication Services
                                            firms and IT firms were present
                                            in the top quartile.

Exhibit 5: Number of firms of each sector

MONASH CENTRE FOR FINANCIAL STUDIES                                           14
Specific modern slavery risks counted by sector
Firms are encouraged to Debt Deceptive Forced Forced Human Slavery
No. Child labour Servitude
bondage recruitment labour marriage trafficking practices
assess the specific types of Potential/Low/Medium/High P L M H P L M H P L M H P L M H P L M H P L M H P L M H P L M H
exploitation that may Communication Services 5 1 1 1 1 1
constitute modern slavery, Consumer Discretionary 9 3 4 4 3
including: Consumer Staples 5 2 2 2 3 1 1
Energy 7 2 2 1 1 1 1 1 1
• trafficking in persons;
Financials 15 3 1 1 1 5 1
• slavery; Health Care 7 3 3 2 3 1
• servitude; Industrials 12 3 1 1 1 1 1 3 1
• forced marriage; Information Technology 7 1 1 1 1
• forced labour; Materials 19 7 3 3 1 8 1 2 2 4
Real Estate 8 1 1 1 1 1 1 1 1
• debt bondage; Utilities 5 1 1
• deceptive recruiting for TOTAL COUNT 99 27 23 7 29 3 6 22 4
labour or services; and TOTAL in % 27.3% 23.2% 7.1% 29.3% 3.0% 6.1% 22.2% 4.0%
• child labour.
Exhibit 6: Assessment of specific risks by firms in each sector
Exhibit 6 presents the number S&P/ASX100 companies that assessed and reported each specific modern slavery risk. If the specific
risk was acknowledged without the assessment of it being High (H)/ Medium (M)/ low (L), it would be listed as “Potential” (P).
Based on the count of the number of firms assessing each risk as a proportion of the total number of firms in a sector , we assessed
the prevalence of each specific risk within each sector, presented on the next page.
MONASH CENTRE FOR FINANCIAL STUDIES 15Prevalence of specific risks
Forced labour 29%
Child labour 27%
Debt bondage 23%
Human trafficking 22%
Deceptive
7%
recruitment
Servitude 6%
Slavery practices 4%
Forced marriage 3%
Exhibit 7: Prevalence of specific risks to Exhibit 8: Specific risk scores by sector
all firms surveyed
The prevalence of a specific risk within a The most common specific risks reported by ASX100 companies are forced labour,
sector is reflected by the proportion of child labour and debt bondage.
firms mentioning the risk in the sector.
In Exhibit 8, we only highlighted where the specific risk is mentioned by at least 20%
of the firms in a given sector.
MONASH CENTRE FOR FINANCIAL STUDIES 16MSD and firm policies
Exhibit 9: Relation between total MSD score and
It can also be observed that firms that have more policies relevant to human
firm’s disclosed policies (as reported by
rights and other social risks (as reported by Bloomberg) have better scores.
Bloomberg)
Policies could be an indicator of good governance of risks.
Data source:
Bloomberg, as of 30 June 2021.
MONASH CENTRE FOR FINANCIAL STUDIES 17MSD and other sustainability scores
Modern Slavery Disclosure Quartile Quartile Quartile Quartile
Score Quartile 1 2 3 4 (Top)
Bloomberg Social Disclosure Score 36.34 45.99 47.04 49.49
Bloomberg ESG Disclosure Score 32.14 41.05 43.46 50.18
Sustainalytics' ESG Risk Score (0=lowest risk) 21.5 23.3 23.33 23.6
RobecoSAM Total Sustainability Score 48.96 60.2 63.28 71.71
ISS Quallity Score (1=best, 10=worst) 5.33 4.08 3.56 2.72
Exhibit 11: Other social scores of firms by MSD Score Quartile
Data source: Bloomberg, as of 30 June 2021.
• Our MSD scores are highly correlated with other
disclosure and sustainability scores, sourced
from Bloomberg, as at 30 June 2021.
• This observation suggests that despite the fact
that the Modern Slavery Statement is a new
reporting requirement for many of these firms,
firms that are generally ranked well in
Exhibit 10: Total MSD score vs RobecoSAM Sustainability Rank score sustainability and disclosure also tended to
and Bloomberg ESG Disclosure Score report well on modern slavery risks.
MONASH CENTRE FOR FINANCIAL STUDIES 18Modern slavery risk: an investor perspective
• As the global supply chain nowadays is increasingly complex, companies are exposed to risks of modern slavery practices in
their operation and supply chain. In the investment value chain, asset owners and asset managers as investors are also
exposed to such risks within their own operation and supply chain and via their portfolio companies.
• At the institution level, investors should have a strong governance system in place for modern slavery and other human rights
issues.
• At the investment level, investors need to have robust due diligence work on their portfolio companies. Our MSD scores and
accompanied analysis could be an useful resource for investors. Investors should also proactively engage with companies via
dialogue, exercise their voting responsibly and submit shareholder proposals on issues related to modern slavery risks if
necessary. Responsible divestment should be considered the last resort.
• The following chart presents the toolkit available for investors to manage modern slavery risks of portfolio companies.
At the investment level
Modern slavery Engagement for Shareholder proposals
Responsible divestment
due diligence investment stewardship & proxy voting
Process to assess and • Direct engagement • Modern slavery and • Divestment due to
address modern slavery • Collaborative human rights issues inability to prevent or
and other human rights engagement shareholder proposals mitigate adverse impacts
risks of portfolio • Advocacy activity • Proxy voting guidelines • Conditions for
companies (engaging with policy and monitoring voting reinvestment
•Operations, and makers) decisions • Public disclosure (press
•Supply chain release)
MONASH CENTRE FOR FINANCIAL STUDIES 19Final remarks
Modern slavery disclosure is a critical step in mitigating the risk
associated with modern slavery practices in companies’ operations
and supply chain.
The quality of the disclosure signals the level of commitments and
efforts that the companies have put in managing these risks.
Companies, investors and governments need to proactively work
together to improve the reporting standards of modern slavery
practices and develop a standardised framework for modern slavery
statements.
MONASH CENTRE FOR FINANCIAL STUDIES 20Bibliography • Corporate Human Rights Benchmark (CHRB) Methodology (2020) https://www.corporatebenchmark.org/press-release- investor-statement-weak-performance-2019-benchmark • Investor Alliance for Human Rights (2020) Investor toolkit on Human Rights. • Joint standing committee on Foreign Affairs, Defence and Trade – Inquiry into establishing a Modern Slavery Act - https://www.aph.gov.au/Parliamentary_Business/Committees/Joint/Foreign_Affairs_Defence_and_Trade/ModernSlavery/Final_ report/section?id=committees%2Freportjnt%2F024102%2F25174 • Murphy, L and Elimä, N. (2021). “In Broad Daylight: Uyghur Forced Labour and Global Solar Supply Chains.” Sheffield, UK: Sheffield Hallam University Helena Kennedy Centre for International Justice. • OECD (2013), OECD Due Diligence Guidance for Responsible Supply Chains of Minerals from Conflict-Affected and High-Risk Areas: Second Edition, OECD Publishing. http://dx.doi.org/10.1787/9789264185050-en • OECD (2017) Responsible business conduct for institutional investors: Key considerations for due diligence under the OECD Guidelines for Multinational Enterprises • The Commonwealth Modern Slavery Act 2018: Guidance for Reporting Entities • The California Transparency in Supply Chains Act 2012 • United Nations (2011), Guiding Principles on Business and Human Rights: Implementing the United Nations “Protect, Respect and Remedy” Framework. • Walk Free Foundation (2018) The Global Slavery Index 2018, https://www.globalslaveryindex.org/resources/downloads/#gsi- 2018 MONASH CENTRE FOR FINANCIAL STUDIES 21
Appendix 1
The scoring
template

   MONASH CENTRE FOR FINANCIAL STUDIES   22
Quartile Quartile Quartile Quartile
                                                                                1        2         3     4 (Top)
                                      Number of firms                               24       25       25       25
Appendix 2                            Market Cap ($B)
                                      Tot Assets ($B)
                                                                                14.14
                                                                                12.58
                                                                                         12.87
                                                                                         52.28
                                                                                                   32.84
                                                                                                   60.18
                                                                                                            30.37
                                                                                                            95.19
                                      Tot Equity ($B)                             3.14     6.63     9.34    13.76
                                      Revenue T12M ($B)                           3.65     4.50     7.66    13.57
                                      Number of employees                        9,341    9,040   10,961   30,992
                                      Percentage of employees unionised (%)         34       29       47       42
                                      Employee Turnover (%)                     11.80    17.65     12.31    15.78
                                      P/E                                         41.6     33.6    73.15    20.14
                                      Gross Dividend Yield (%)                     2.7     2.84     4.26     4.67
                                      ROA (%)                                     5.05     3.59     2.96     1.76
                                      ROE (%)                                   14.12      8.92     9.49     9.29
                                      Human Rights Policy                           12       21       22       23
                                      Anti-Child Labour Policy                      13       16       19       20
                                      Supplier's ESG Guideline                      13       19       22       23
                                      Supply Chain Management Policy                14       21       23       24
                                      Business Ethics Policy                        20       22       24       24
Data source:                          Equal Opportunity Policy                      20       22       24       24
Bloomberg, as of 30 June 2021.        Training Policy                               16       21       20       24
Policies data is the number of        Health/Saftey Policy                          20       22       23       24
firms reporting the policy.           Total Return: Y-1 (%)                     44.08    32.66     42.03    15.35
Other values provided are             Total Return: Y-3 (%)                     18.71      6.13     15.9     4.91
average.                              Total Return: Y-5 (%)                     20.08      11.3    18.51     8.67
                                      Total Return: Y-10 (%)                    18.82    13.11     13.54     8.07
MONASH CENTRE FOR FINANCIAL STUDIES                                                                                 23
Appendix 3
Materials Real Utilities Consumer Financials Energy Industrials Consumer Information Communication Health Care
Estate Staples Discretionary Technology Services
Number of firms 19 8 5 5 15 7 12 9 7 5 7
Market cap ($B) 33.91 13.43 6.84 17.62 39.42 9.71 11.17 16.39 12.57 17.86 35.57
Number of employees (median) 5000 1400 3034 60500 7400 2170 6250 12270 3055 4500 20005
Number of suppliers (median) 3722 3800 3500 10500 4000 1900 4530 3477 578 3350 6500
Supply Spend ($B) 3.73 0.87 3.83 29.9 3.96 5.1 4.04 5.33 0.5
Number of specific risks disclosed 2.26 1.75 0.6 2.6 1.07 2.14 1.42 2.22 0.57 1.6 2.29
Number of policies disclosed 5.11 5 4.6 6.2 5.6 4.71 5 4.22 5.43 4.2 3.86
Section 1: Structure & operation disclosure 7.83 6.64 7.63 7.53 7.04 6.32 7.59 5.81 5.6 6.31 6.07
Section 2: Supply chain disclosure 7.89 7.25 9.6 4.8 6.27 9.71 6.33 7.89 5.71 4.4 4
Section 3: Modern slavery risk disclosure 17.51 15.88 19.23 18.86 16.23 17.39 15.6 15.92 15.55 16.54 12.35
Section 4: Due diligence & remediation disclosure 20.99 22.78 16.56 19.44 18.44 16.9 16.11 16.23 18.73 16.33 17.86
Section 5: Effectiveness assessment 9.68 10.88 8.6 10 11.73 9.29 9.17 8.89 8.14 7.6 7.86
Total Disclosure Quality Score 63.92 63.42 61.61 60.63 59.71 59.61 54.8 54.74 53.74 51.18 48.13
Data source:
Market cap ($B), extracted from Bloomberg, as of 30 June 2021.
Other data points were extracted from the companies’ Modern
Slavery Statements and our analysis.
MONASH CENTRE FOR FINANCIAL STUDIES 24MCFS research team
Bei Cui, PhD Ummul Ruthbah, PhD
Bei Cui had a PhD degree in Finance from Ummul Ruthbah holds a PhD degree in
the University of Hong Kong. Her primary Economics from the Massachusetts
areas of research include the market Institute of Technology (MIT), where she
microstructure, market efficiency and was an IMF Scholar. Ummul’s industry
sustainable investments. experience includes five years of
consulting to the World Bank. Early in
her career, she worked at the
Nga Pham, PhD, CFA. International Monetary Fund. Her current
Nga Pham has MBA and PhD degrees from research interests include issues related
La Trobe University and is a Chartered to sustainable finance and retirement
Financial Analyst. Nga works on issues planning.
related to pensions and shareholder
activism. Nga’s industry experience includes We are thankful to Professor Deep Kapur
working for the International Finance for his guidance.
Corporation (a member of the World Bank We acknowledge the support of our
Group) in corporate governance and research assistants, Huy Nguyen and Sid
emerging market equity analysis. Nga is Shrestha, and interns, George
also a member of the Disclosure and Couroyannis, Katrina Le, Andrew Moore,
Transparency Committee of the Kathaleeya Ros, and Kevin Tat for the
International Corporate Governance project.
Network (ICGN).
MONASH CENTRE FOR FINANCIAL STUDIES 25CONNECT WITH MCFS >>> monash.edu/mcfs If you are interested in our research, please get in touch with us: Dr. Nga Pham. CFA Research Fellow Monash Centre for Financial Studies Email: nga.pham@monash.edu Disclaimer: This research brief is not intended as legal, financial or investment advice. MONASH CENTRE FOR FINANCIAL STUDIES 26
You can also read