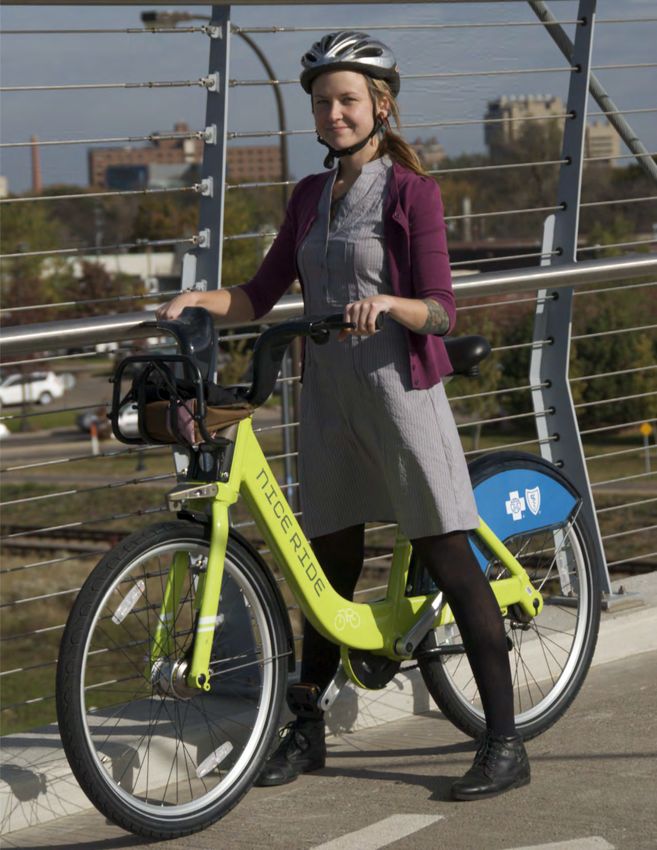
RISKS AND BENEFITS OF BIKE SHARE - Photo Credit: Nice Ride MN - City of Wilmington
←
→
Page content transcription
If your browser does not render page correctly, please read the page content below
CHAPTER 3

RISKS AND BENEFITS OF
BIKE SHARE

                Photo Credit: Nice Ride MN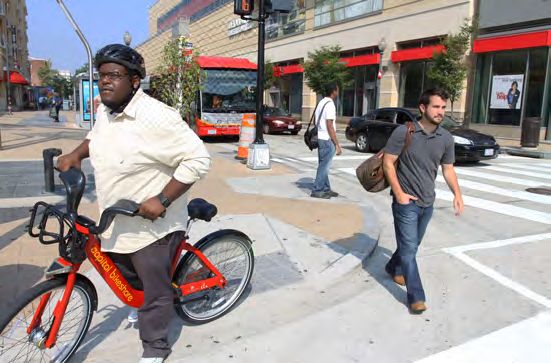
THIS PAGE LEFT INTENTIONALLY BLANK
Bike share systems are inexpensive and quick-to-
implement transportation options and based on other
cities’ experience can deliver a variety of transportation
and mobility, economic, health, safety, and quality of
life benefits. As has been seen in U.S. cities with existing
programs, bike share can provide a fundamental shift
in the way people move about and make decisions on
transportation.
This section summarizes some of the potential benefits and
risks associated with implementing a bike share program in
Wilmington. The section provides a summary of risks and
benefits related to mobility and transportation, economic                         Figure 6: Capital Bikeshare. Washington, DC
and financial performance, health, environment, and safety.
                                                                       that at least one of their bike share trips in the previous
As in other programs in the past it will be important to
                                                                       month had started or ended at a Metrorail station and
consider and compare the potential benefits and risks so
                                                                       about a quarter (23 percent) of respondents used bike share
that an informed decision on the feasibility of implementing
                                                                       to access the bus in the previous month.7 Furthermore, Salt
a bike share system in Wilmington can be made.
                                                                       Lake’s Greenbike also made it easier for people to use their
MOBILITY AND TRANSPORTATION                                            existing public transportation infrastructure by providing
                                                                       first and last mile connections to UTA riders. In fact, 51 percent
Bike share has helped increase mobility and connectivity
                                                                       of survey respondents said that they were more likely to use
in various communities across the U.S. by adding
                                                                       other forms of public transportation like Frontrunner, Trax or
transportation options. As bike share trips are typically
                                                                       buses because of the Greenbike system.8
short (between 15 to 35 minutes and one-to-three miles
long)5 they provide an easy and accessible mobility                    Bike share has also been effective at introducing new
option for trips that are too short to wait for transit, or too        riders and re-introducing former cyclists to bicycling as a
far to walk. Bike share users have reported combining their            form of transportation. A survey of Hubway members in
bike share trips with transit, car-share, walking, and even            Boston found that 12% bicycled less than once per year
their own single occupancy vehicle trips when bike share               prior to joining Hubway and a further 16 percent bicycled
is available.6 Bike share has been known to provide transit,           less than once per month prior to joining.9 Bike share has
active transportation and community-building benefits.                 been able to reduce the common barriers to entry for
                                                                       new bicyclists including owning, storing and maintaining a
Bike share can leverage investment in and serve as a
                                                                       bicycle of their own. In Minneapolis for example, 33 percent
complement to existing transit services by offering a first-
                                                                       of new members surveyed in 2010 by Nice Ride Minnesota
and last-mile option. It can also help extend the reach of
                                                                       had ridden less than once per month before joining.10
existing fixed-route bus and rail services. Furthermore,
bike share can help connect transit lines that do not cross            7   LDA Consulting (2013). 2013 Capital Bikeshare Member Survey
                                                                          Report. Accessed online at http://capitalbikeshare.com/assets/pdf/
and can help alleviate capacity on some already congested                 CABI-2013SurveyReport.pdf on December 13, 2013.
transit routes.                                                        8 GreenBike SLC Non-Profit Bike Share 2014 Annual Report.
                                                                          Accessed from https://configuringgreenbike.bcycle.com/docs/
For example, in Washington D.C. over half (54 percent) of                 librariesprovider32/default-document-library/2014-annual-report.
                                                                          pdf?sfvrsn=2 on July 2015.
respondents to Capital Bikeshare’s member survey stated                9 Presentation titled The Hubway Influence on New Riders given
5 Bike Sharing in the United States: State of the Practice and Guide      by Nicole Freedman, 2013. Accessed from: http://baystateroads.
  to Implementation. Federal Highway Administration. United States        eot.state.ma.us/movingtogether/docs/Freedman-Moving%20
  Department of Transportation. September 2012.                           Together%202013.ppt.pdf on August 2015.
6 LDA Consulting (2013). 2013 Capital Bikeshare Member Survey          10 Two-thirds of members also said they had increased their amount
  Report. Accessed online at http://capitalbikeshare.com/assets/pdf/      of bicycling since joining Nice Ride. Figures taken from Nice Ride
  CABI-2013SurveyReport.pdf on December 13, 2013.                         2010 Annual Report.

                                                             City of Wilmington - Bike Share Feasibility Analysis                      21
RISK
As noted by a recent National League of Cities report, 20-
40 percent of bike share trips have replaced short single
occupancy vehicle trips.12 While the some of the trips
remaining have been defined as new trips taken by users,
a good proportion of those trips have detracted from
other public transit or active transportation trips, therefore
incrementally reducing the number of public transportation
trips, and consequentially their farebox recovery.13,14
However, on an order-of-magnitude basis, the number of
public transportation trips replaced by bike share has been
de minimis.
ECONOMIC
There are a number of economic benefits that bike share
Figure 7: Increase in On-Street Bikeways in Boston with the offers at an individual, community, and business level.
Launch of Hubway At a community level, bike share continues to be
As Wilmington has a nascent bicycling community, the recognized by many cities as a means for attracting
addition of more bicyclists in the form of bike share users, or retaining residents, students, and workforce talent.
could provide the impetus for further investment in Many communities have used it as a companion to other
bicycle-friendly facilities. This could in turn help the City initiatives to help (re)vitalize and redevelop some of their
advance from a bronze level bicycle friendly community more depressed areas. Others have used it to promote their
(as recognized by the League of American Bicyclists) to image as a forward thinking, bicycle friendly community.
a more advance category. This was the example of the Bike share embraces new technology, social media,
City of Boston, which increased its on-street bikeways in and is part of the new sharing economy, all of which are
conjunction with the implementation and launch of its bike
share program (see Figure 7).
As it has become evident that bike share can serve as
a complementary service to traditional transit options,
the Federal Transit Administration (FTA) and the Federal
Highway Administration (FHWA) have both provided
funding for several systems including in Boston,
Chattanooga, Chicago and more recently Birmingham,
Alabama. To be eligible for FTA and FHWA funding stations
must be within a 3 mile radius of transit and funds can
be used towards bike share docks, equipment and other
capital costs (the cost of the bikes and operating costs are
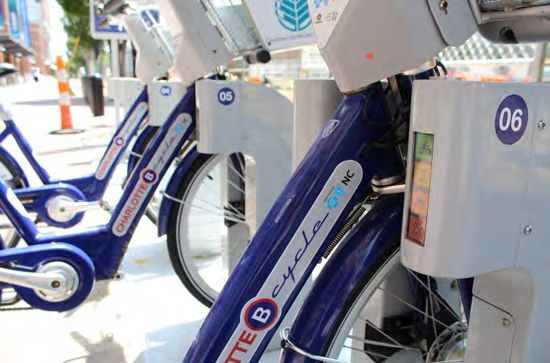
Figure 8: Charlotte B-cycle. Charlotte, NC
not eligible). 11
12 National League of Cities (2011) Integrating Bike Share Programs
into a Sustainable Transportation System.
11 Federal Transit Administration’s Frequently Asked Questions and 13 Nice Ride Minnesota (October 2011) Presentation about Nice Ride
Answers Concerning Bike Sharing Relative to the United States Minnesota.
Department of Transportation. Accessed online at http://www.fta. 14 2014 Capital Bikeshare Member Survey Report. Obtained
dot.gov/documents/Informal_Q_and_As_Final_6-14-12.pdf on from http://www.capitalbikeshare.com/assets/pdf/cabi-
August 2015. 2014surveyreport-execsummary.pdf on July 2015.
22 City of Wilmington - Bike Share Feasibility Analysis
attractive characteristics to younger demographics and                  Bike share embraces new technology, social media,
professionals.                                                          and is part of the new sharing economy, all of which are
The economic benefits of bike share for individuals come in             attractive characteristics to younger demographics and
various shapes and forms. For example, bike share members               professionals. Bike share also serves visitors and is a unique
have experienced reduced household expenditures on                      way to experience a city, helping attract their spending
transportation and health care (which combined make up                  power. The amount of national and international press
over 22 percent of annual average household expenditures                coverage generated by a bike share system would serve to
in the United States).15 Furthermore, when compared to                  emphasize the city to visitors, businesses, and employers.
the cost of owning and operating a car (the median cost                 For example, the launch of Charlotte B-cycle in North
of annual car ownership is approximately $9,100),16 a bike              Carolina received exposure in 18 newspapers including the
share membership and use is relatively inexpensive with                 New York Times.18
most programs costing between $60 and $150 per year                     There have been several studies into whether businesses
and usage fees between $2 to $4 per additional hour. Users              located near bike share stations have seen an economic
also save money on public transportation while being able               benefit. A recent study of annual members of the Nice
to access parts of the city that were not reachable by transit          Ride system in Minneapolis / St. Paul found that annual
before: 87 percent of annual members in Washington D.C.                 members made a number of commercial trips that they
said they saved money on weekly travel costs by using                   would otherwise not have made because of bike share.
Capital Bikeshare. This resulted in an average of $800 per              Based on the average amount that respondents’ spent
year saving on personal transportation costs for each of                for these trip types, the researchers calculated that Nice
the more than 15,000 members.17                                         Ride annual members created an additional $150,000 in
At a community level, bike share continues to be                        economic activity at local businesses over the course of
recognized by many cities as an as a means for attracting               one bike share seasons. Further, in a study of five Capital
or retaining residents, students, and workforce talent.                 Bikeshare stations in 2013, a positive economic impact
Many communities have used it as a companion to other                   was found in those commercial areas surrounding each
initiatives to help (re)vitalize and redevelop some of their            of the respective bike share stations.19 In this instance, a
more depressed areas. Others have used it to promote their              large number of riders travelling to these stations spent
image as a forward thinking, bicycle friendly community.                money within a four block area and planned to return
                                                                        to the neighborhood on a regular basis.20 Other surveys
                                                                        indicated that approximately 20 percent of bike share
                                                                        riders would not have made the trip if not for bike share,
                                                                        suggesting that bike share generated new spending trips
                                                                        to these commercial areas.21
                                                                        Bike share has also brought benefits for local employers
                                                                        and businesses. Many have seen bike share as an addition
                                                                        to a company’s health and wellness program or have
                                                                        included it in their travel demand management program.
                                                                        18 From the Sponsor’s Perspective (2013). Accessed online at www.
         Figure 9: Transportation modes cost comparison                    bikeshare.com on December 12, 2013.
                                                                        19 Economic Impact & Opperational Efficiency for Bikeshare Systems.
                                                                           Anderson, Ryan et al. Accessed from: http://ralphbu.files.wordpress.
15 U.S. Department of Labor, Bureau of Labor Statistics, Consumer          com/2014/01/virginia-tech-capital-bikeshare-studio-report-2013-
   Expenditure Survey, 2010.                                               final.pdf on July 2015
16 www.consumerreports.org accessed on July 2015.                       20 2013 Capital Bikeshare Member Survey Report. Obtained
17 LDA Consulting (2013). 2013 Capital Bikeshare Member Survey             from http://www.capitalbikeshare.com/assets/pdf/CABI-
   Report. Accessed online at http://capitalbikeshare.com/assets/pdf/      2013SurveyReport.pdf on July 2015
   CABI-2013SurveyReport.pdf on July 2015.                              21 Ibid

                                                              City of Wilmington - Bike Share Feasibility Analysis                        23
To serve this sector, bike share programs around the                  BENEFITS
U.S. offer corporate or company membership packages                   Bike share can have an impact on reducing greenhouse
which offer discounted rates for employees.22 For local               gas emissions by replacing trips taken previously by
businesses, bike share represents a way to get their name             automobile. These impacts can be multiplied when bike
out there through the use of promotions for members. In               share is used in combination with transit and other modes
the Washington DC area for example, various businesses                to reduce dependence on automobile use, change travel
offer special discounts to Capital Bikeshare members and              patterns and increase environmental consciousness.
this has helped generate traffic to their businesses.23
                                                                      In communities where bike share is available, surveys have
RISKS
                                                                      shown that approximately 20 to 40 percent of annual
Only a few bike share systems are economically self-                  member bike share trips replace what would have been
sustaining on system revenues alone (i.e. operating                   an automobile trip. For example, 70 percent of GreenBike
costs are greater than system revenues). Therefore, the               users (Salt Lake City) reported that they made fewer trips
organization responsible for the program (city, public                in their personal vehicles as the program inspired them to
agency, non-profit, or private company) must ensure that              walk more, take transit or car pool, even after they had left
enough funding is available to support all expenditures               downtown and returned home.24 Furthermore, a survey
related to the implementation of a bike share program                 of Capital Bikeshare members in Washington D.C. in 2011
(capital purchases, expansion, and ongoing operations).               showed that bike share trips had replaced approximately 4.4
Furthermore, funding the day-to-day operations of a bike              million vehicle miles, representing a four percent decrease
share system can also be complicated as bike share is not             in the city’s annual driving mileage.25
eligible to access federal dollars for operations. Therefore,         In its 2014 survey of users, GreenBike reported that 80
if membership and ridership are not as significant enough             percent of survey respondents had become more aware of
to cover those costs, these will need to be recaptured                the need to improve air quality in Salt Lake City after using
through other funding sources including private donations,            the program. Additionally, in 2014 GreenBike’s 46,242 trips
sponsorships and advertising.                                         directly removed 103,224 vehicle miles from the road. Those
Although there are several examples in North America                  direct trip reductions in the number of vehicle miles traveled
where the initial business model was not successful (e.g.,            prevented over 130,000 lbs. of carbon dioxide from entering
Montreal, Ottawa, Toronto, New York, San Antonio), all                the atmosphere.26 Another City that saw reductions in
systems to date have identified adjustments to their                  greenhouse gas emissions was Denver through its Denver
business and/or ownership model which have allowed                    B-Cycle system. A survey of members showed that over 40
them to continue operating.                                           percent of trips replaced a vehicle trip, resulting in almost a
Based on stakeholder conversations, there are likely various          16,000 gallon saving in gasoline consumption and avoiding
potential sponsors for a bike share system in Wilmington. It          over 300,000 pounds of greenhouse gas emissions.27
is likely that the system owner will need to employ a multi-          24 GreenBike SLC Non-Profit Bike Share 2014 Annual Report.
pronged strategy towards sponsorship, which includes title               Accessed from https://configuringgreenbike.bcycle.com/docs/
                                                                         librariesprovider32/default-document-library/2014-annual-report.
and/or presenting sponsorship as well as station, bike and               pdf?sfvrsn=2 on July 2015.
other types of smaller sponsorships (such as in Philadelphia’s        25 Federal Highway Administration, Highway Statistics 2011:
                                                                         Urbanized Areas – 2010 Miles and Daily Vehicle – Miles Traveled.
system).                                                                 Accessed online at http://www.fhwa.dot.gov/policyinformation/
                                                                         statistics/2011/hm71.cfm on July 2015.
ENVIRONMENTAL                                                         26 GreenBike SLC Non-Profit Bike Share 2014 Annual Report.
                                                                         Accessed from https://configuringgreenbike.bcycle.com/docs/
22 Corporate memberships. Pronto Bike Share. Obtained from https://      librariesprovider32/default-document-library/2014-annual-report.
   www.prontocycleshare.com/pricing/corporate-memberships on             pdf?sfvrsn=2 on July 2015.
   July 2015.                                                         27 GreenBike SLC Non-Profit Bike Share 2014 Annual Report.
23 Member Benefits. Obtained from https://www.capitalbikeshare.          Accessed from https://configuringgreenbike.bcycle.com/docs/
   com/member-benefits on July 2015.                                     librariesprovider32/default-document-library/2014-annual-report.

 24                    City of Wilmington - Bike Share Feasibility Analysis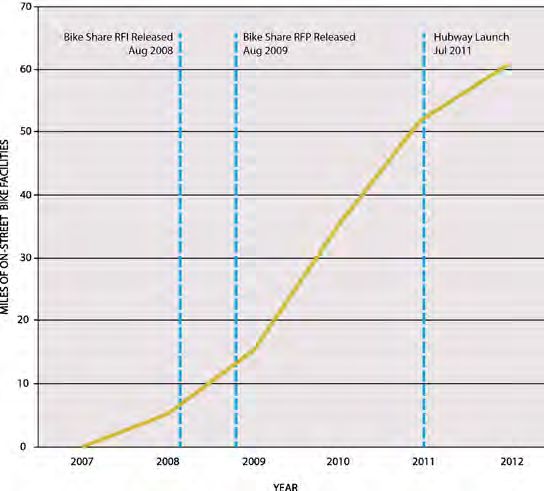
minutes a day, (in the form of using bike share to go to and
                                                                           from work each day), can reduce the risk of heart disease
                                                                           by 82 percent29and reduce the risk of diabetes by up to 58
                                                                           percent.30 Furthermore, in a recent study of the impacts of
                                                                           bike share on physical activity, 30 percent of respondents
                                                                           indicated they lost weight as a result of using bike share.31
                                                                           The health benefits of bike share are recognized by
                                                                           the health care industry and the federal government
                                                                           alike. For example, the Centers for Disease Control and
                                                                           Prevention (CDC), has funded several different systems
                                                                           including in Boston and Nashville. The private sector is
      Figure 10: Redistribution Trailer Used in Charlotte, NC.             also represented with many bike share systems in the
                                                                           United States supported by health care providers such as
RISKS                                                                      Blue Cross Blue Shield in several different cities including
A major part of operating a bike share system is the                       Birmingham, Chicago, Minneapolis, and Philadelphia, and
rebalancing process (i.e., moving bikes around from full                   Kaiser Permanente (Denver B-Cycle) through partnerships
stations to empty stations to ensure the availability of                   and sponsorships.
bicycles and empty docks). Typically, in larger systems this               Bike share can also have a positive impact on mental health.
operation is undertaken by cargo vans. Because of the                      This can be evidenced by users in other cities who have
relatively high cost and low availability of non-greenhouse                expressed that bike share has positively contributed to
gas options for rebalancing vehicles, there are only few                   an improved outlook, increased recreation, and improved
operations that utilize electric or other environmentally                  sociability. In fact in a recent study of Capital Bikeshare users
friendly vehicles such as the cargo bike in Figure 10. While               31.5 percent of respondents reported stress reduction. 32
there has not been a conclusive and extensive study on the
                                                                           RISKS
impact of these vehicles on the overall GHG’s emissions,
this negative impact should be noted. Furthermore, the                     Some informal studies have shown that the rate of helmet
frequency of use of rebalancing vehicles will have a direct                usage in bike share systems is lower than in normal
relation with the placement of stations, the number of                     bicycling. While bicycling without a helmet constitutes
stations, and how large the bike share program is.                         the biggest risk to the health of users, the safety record
                                                                           for bike share systems has been impressive as the rates of
HEALTH                                                                     accidents and fatalities have been much lower than those
BENEFITS                                                                   using conventional bicycles.33 This will be further described
                                                                           in the Safety section below.
The health benefits of bicycling are well known in helping to
                                                                           29 British Medical Association (1992). Cycling Towards Health and
address preventable diseases such as obesity, heart disease,                  Safety. Oxford University Press.
and diabetes.28 Bike share can have a positive impact on                   30 Lindström, J. et al. The Finnish Diabetes Prevention Study: Lifestyle
                                                                              intervention and 3-year results on diet and physical activity.
both physical and mental health.                                              Diabetes Care, December 2002, vol. 26 no. 12 3230-3236. Accessed
                                                                              online at http://care.diabetesjournals.org/content/26/12/3230.full
Bike share represents an opportunity for people to
                                                                              on July 205
incorporate active transportation into their daily lives                   31 Ricci, Miriam. Bike sharing: A review of evidence on impacts and
                                                                              processes of implementation and operation. Managing the Business
and lower medical and health care costs. Bicycling for 30
                                                                              of Cycling. Research in Transportation Business & Management
   pdf?sfvrsn=2 on July 2015.                                              32 Ricci, Miriam. Bike sharing: A review of evidence on impacts and
28 Lindström, J. et al. The Finnish Diabetes Prevention Study: Lifestyle      processes of implementation and operation. Managing the Business
   intervention and 3-year results on diet and physical activity.             of Cycling. Research in Transportation Business & Management
   Diabetes Care, December 2002, vol. 26 no. 12 3230-3236. Accessed        33 Bike Sharing in the United States: State of the Practice and Guide
   online at http://care.diabetesjournals.org/content/26/12/3230.full         to Implementation. Federal Highway Administration. United States
   on July 2015.                                                              Department of Transportation. September 2012.

                                                                 City of Wilmington - Bike Share Feasibility Analysis                       25
PRIVATE BICYCLING
                                               14.61

ALL U.S. BIKE SHARE
                                     11.46

CAPITAL BIKESHARE
                                                            21.21
      CITI BIKE             5.67

     NICE RIDE
                                   9.92

                      0
                             5
                                          10
                                                       15
                                                            20
                                                                    25

                      Figure 11: Injury Rate Comparison                     Figure 12: Walking and Bicycling Risk in 68 California Cities in
                                                                                                         2000
SAFETY                                                                    Along with the high visibility of stations, the high volume
Because the safety of bicycling is a significant concern to               of riders results in greater awareness of bicyclists by
jurisdictions considering the implementation of bike share,               drivers. In fact, the “safety in numbers effect” is well
it is important to understand the safety record of existing               established. A study published in Injury Prevention in
bike share systems. Although bike share is a relatively new               2003 showed that the “likelihood of a person walking or
transportation option in the US (the oldest systems are just              bicycling being struck by a motorist varies inversely with
completing their fifth year of operations), its safety record             the amount of walking and bicycling”.36 Figure 12 shows
is impressive. To date, no system in the United States has                how the injury rate (referred to as “relative risk index”)
recorded a fatality, and the rates of injury crashes have                 reduces exponentially with the number of cyclists using
been typically lower than private bicycling, as presented                 the road system (in this case using journey to work mode
on Figure 11.34,35                                                        share as a proxy for the overall amount of bicycling).37
Bike share’s safety record can be condensed into three
                                                                          EXPOSURE TO BICYCLE EDUCATION AND RULES OF
major categories:                                                         THE ROAD COMPONENTS
      •      Safety in numbers                                            Bike share systems have also provided a new medium
      •      Exposure to bicycle education and rules of the               to communicate with residents and bicyclists in general
             road components                                              about how to the bicyclists rules of the road, and has
      •      Bike share bicycles’ safety features                         provided an avenue for safety hints.
SAFETY IN NUMBERS                                                         Many systems have included tips on their handle bars
Millions of bike share trips have been taken in over 50                   about how to behave on the roads. These include:
cities with existing programs, significantly increasing                       •     Not riding on sidewalks.
the number of trips and bicycle modeshare in each city.                       •     Riding with traffic.
For example, in 2013 New York, there were an additional                       •     Looking out for car doors.
40,000 bike trips per day due to Citi Bike and bike share                     •     Encouraging the use of helmets when riding
trips made up approximately 29 percent of the 113,000                         •     Riding in a predictable manner
daily bicycle trips made within the bike share service area.

34 Only Capital Bikeshare has a higher injury crash rate than private
   bicycling. It is uncertain why the injury crash rate is higher in      36 Jacobsen, P.L. (2003). Safety in Numbers: More Walkers and
   Capital Bikeshare than in other systems and higher than the               Bicyclists, Safer Walking and Bicycling. Injury Prevention
   private bicycling rate.                                                   2003;9:205-209.
35 Injury rates for private bicycling obtained from: Beck, L. et al.      37 Jacobsen, P.L. (2003). Safety in Numbers: More Walkers and
   (2007). Motor Vehicle Crash Injury Rates by Mode of Travel, United        Bicyclists, Safer Walking and Bicycling. Injury Prevention
   States. Published in the American Journal of Epidemiology.                2003;9:205-209.

26                           City of Wilmington - Bike Share Feasibility Analysis
Front and rear lights improve
Adjustable seats allow visibility during day and night
quick sizing Basket for purse or bags
Multiple gears allow users to
adjust effort for a variety of
terrain and traffic conditions
Step-through frame provides Sturdy tires and wheels Step-through frame provides
durability and a universal fit for urban riding durability and a universal fit
Figure 14: Bike Share Safety Features
All bike share systems have included safety messaging in • An upright position of the rider; and
their websites and social media campaigns. Figure 13 shows • Heavier bicycle (typically between 40 to 45 lbs.)
a screen shot of some of the safety tips included in Indego’s with a wide center of gravity which generally
website. keep slow speeds and do not allow for the rider to
BICYCLES’ SAFETY FEATURES38 weave through traffic.
The safe, comfortable and upright design of bike share Another important characteristic adding to the safety
bicycles have also impacted the safety of bike share. The record of bike share systems, includes the safety inspections
safety features are shown on Figure 14 and include: and regular maintenance that every bicycle in each fleet
undergoes. Many US cities have added safety provisions
• Built-in rechargeable front and back lights, brakes,
to their contracts with their vendors that regulate the
and reflectors;
safety inspections and maintenance of their systems. For
example, Arlington County in its contract with its operator
requires that the contractor inspect all drive chains for
proper functioning and lubrication, inspect handlebars,
tires, brakes and saddles for proper functionality on a
monthly basis.39
RISKS
Because bike share is a relatively new transportation
option, prior to implementation, many communities have
had strong concerns about the safety of a bike share
program. Some of the major safety issues found include:
• Existing infrastructure in the city does not provide a
Figure 13: Safety Page. Indego. complete network of safe and comfortable facilities.
39 Arlington County Virginia. Office of the Purchassing Agent.
38 Atlanta Bicycle Coalition (2013). Atlanta – Decatur Bike Share Ammendment NO 2. Alta Bicycle Share Contract. Accessed from
Feasibility Study. Accessed from: http://issuu.com/atlantabike/ http://egov.arlingtonva.us/purchasing/pdf/contracts/270-11A2.pdf
docs/atl-dec_bikeshare_book_lowres# on August 2015. on August 2015.
City of Wilmington - Bike Share Feasibility Analysis 27• The introduction of new or inexperienced riders
might create more conflicts between people
walking, bicycling or driving.
• Low helmet usage40
Although the safety risks are real, cities have mitigated them
in different ways. Some cities have begun working with
local bicycling advocacy organizations to offer education
classes.41 Others have provided helmet vending machines
to increase access to helmets for bike share users.42 Bike
share has also become a catalyst to implementing new
and more comfortable facilities (as seen in the Mobility
and Transportation benefits section above). Furthermore,
evidence suggest that none of these considerations
have proven to be a significant deterrent for any existing
systems.
40 Fischer, C.M. et al. (2012). Prevalence of Bicycle Helmet Use by
Users of Public Bikeshare Programs. Published in the Annals of
Emergency Medicine, Vol. 60, Issue 2, pp. 228-231.
41 Washington Area Bicyclist Association. Adult education. Accessed
from http://www.waba.org/adult-education/ on August 2015.
42 Seattle bike share’s surprisingly simple solution to a mandatory
helmet law. People For Bikes. Accessed from http://www.
seattlebikeblog.com/2014/09/24/pronto-starts-installing-station-
docks-helmet-vending-machines-wont-be-ready-for-launch/ on
August 2015.
28 City of Wilmington - Bike Share Feasibility AnalysisYou can also read