EURONEXT CAPITAL MARKETS UPDATE - WEEK 14 - FROM 30 MARCH TO 3 APRIL 2020 8 APRIL 2020
←
→
Page content transcription
If your browser does not render page correctly, please read the page content below

EURONEXT CAPITAL MARKETS UPDATE
WEEK 14 – FROM 30 MARCH TO 3 APRIL 2020

                                          8 APRIL 2020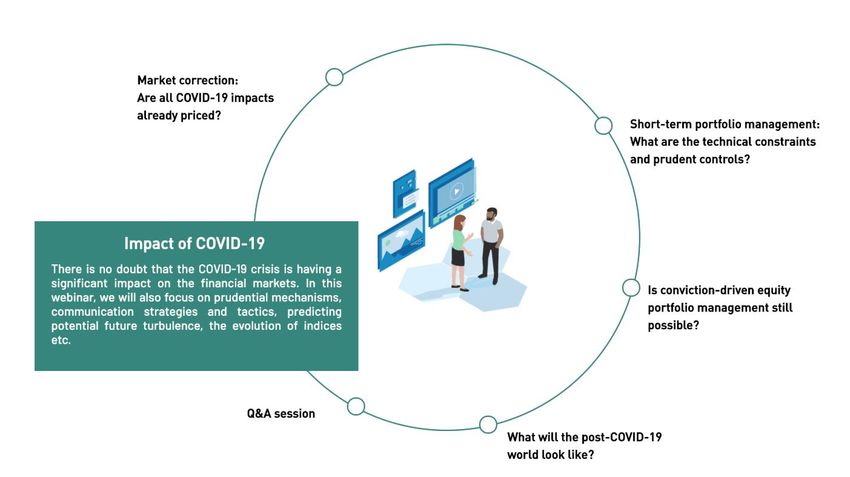
EXECUTIVE SUMMARY
Weekly update for issuers and market members
                                                MOST RECENT REGULATORY UPDATES – DIVIDEND POLICIES AND FINANCIAL REPORTING DEADLINE
Euronext published new guidelines on dividend policy and AGM changes to prevent the impact on derivatives. Euronext also adjusted its policy on financial communications on Euronext Growth
and Euronext Access following ESMA’s statement*. For companies with a fiscal year ending 31 December 2019, the publication on their website must be effective no later than 30 April 2020.
However, the sending of warnings to issuers unable to publish on time will be delayed of two months beyond the normal deadline.

                                                EQUITY PERFORMANCE IN EUROPE – MAIN INDICES BOUNCED BACK BY FIRST INFLOWS LAST WEEK
Since February 2020, the impact of COVID-19 can be seen across selected Euronext indices with an average decrease of 27.12%. Small and Midcaps issuers performances have been in line with the
evolution of Blue Chips indices demonstrated by the respective -29.96% and -29.60% decrease of CAC Mid & Small and AMX. In parallel, volatility has increased with the daily average in March 2020
reaching 57.57% and a daily highest peak of 85.62%. However, over the last week volatility fell below the monthly average to 50.23%. Regarding the performance by sector of activity, issuers
operating in the Utilities and Healthcare industries have performed the strongest year to date, whilst Oil & Gas as well as Industrials have struggled the most.

                                        EURONEXT BLUE CHIPS PERFORMANCE – SIGNIFICANTLY POSITIVE PERFORMANCES WITH A RECOVERING MARKET
Issuers from across Euronext’s Blue Chips indices have ended the previous week with significantly positive performances compared to their month-to-date and year-to-date figures, as the market
continues to recover. Issuers within the Oil & Gas and the Consumer Staples industries specifically saw the biggest price performances across all major indices. In comparison, issuers from the
Financials sector struggled the most on average, which is primarily due to many financial firms electing suspend dividend payments due to COVID-19.

                                    EURONEXT TRADING VALUES AND VOLUMES – VOLATILITY REMAINS HIGH BUT DECREASED BELOW ONE-MONTH AVERAGE
The increased volatility caused by uncertainty of COVID-19 has resulted in a daily average turnover over March 2020 to increase to €16.09bn, this being more than 2 times the daily average
turnover of the year 2019. Additional liquidity has been primarily seen in Blue Chips, especially through the total turnover in March 2020 which has almost doubled the trading volumes of January
2020. However the trading value across all Euronext locations fell by 22.97% compared to the previous week to a total of €48.33bn. Midcap issuers listed on Compartment B had slightly higher
trading volumes with a peak of €5.33bn in March 2020 whilst small cap issuers listed on Compartment C and Euronext Growth have come back to levels slightly higher than January 2020.

                                              FUNDS FLOWS IN EUROPE – FIRST INFLOWS ON EQUITIES WHILE OUTFLOWS FOR OTHER ASSET CLASSES
With respect to inflows and outflows in Europe by asset class, last week has seen an overall outflow in all asset classes, except for equities. Indeed, the latter have benefitted from a net inflow
amounting to €7.87bn, an improvement compared to the previous week-end. The categories Mixed Assets and Bonds experienced an outflow of €1.25bn and €3.87bn respectively, lower compared
to the previous week-end figures. Looking at Euronext markets more specifically, monthly figures for March 2020 indicate that Financials, Technology and Consumer Discretionary shares are
experiencing the largest outflows. In contrast, the sectors Healthcare, Consumer Staples and Energy have benefitted from a net inflow.

                                  │ ESMA published a statement on publication deadlines on 27 March 2020:
                                  │ https://www.esma.europa.eu/sites/default/files/library/esma31-67-742_public_statement_on_publication_deadlines_under_the_td.pdf                                    │2
EQUITY PERFORMANCE IN EUROPE
  Market impact due to COVID-19
                                              INDEX EVOLUTION                                                                                               INDEX HISTORICAL PERFORMANCE
Price perf.                                                            Volatility
Rebased                                                                                      Vstoxx *                                                                                      Since
                                                                                                                          Price Perf. (%)               10Y               5Y                               MTD                YTD
120                                                                         90%                                                                                                           Feb-20
                                                                                             AEX
                                                                            80%                                           AEX©                         34.15            -4.25             -20.02           2.66              -22.02
110                                                                                          Bel20
                                                                            70%                                           Bel20©                        6.58           -24.28             -26.88           3.55              -27.78
                                                                                             CAC40
100                                                                         60%                                           CAC40©                        2.98           -18.12             -28.45           1.75              -30.50
                                                                                             ISEQ
                                                                            50%                                           ISEQ©                        47.44           -20.59             -31.63           -1.35             -33.39
 90                                                                                          Oslo OBX
                                                                            40%                                           Oslo   OBX©                  35.23           -11.49             -28.34           -0.83             -32.72
 80                                                                         30%              PSI20                        PSI20©                       -51.46          -34.18             -24.36           -0.23             -23.81
                                                                            20%              CAC Mid&Small                                             37.51           -16.92             -29.96           1.78              -31.67
 70                                                                                                                       CAC Mid &     Small©
                                                                            10%              AMX                          AMX©                         11.96           -15.05             -29.60           2.05              -29.58
 60                                                                        0%                EuroStoxx 600                Stoxx600©                    22.16           -17.28             -19.88           5.88              -20.87
 12/31/19                1/29/20               2/26/20              3/25/20
                OVER PERFORMING INDUSTRIES ON EURONEXT REGULATED MARKETS                                                           UNDER PERFORMING INDUSTRIES ON EURONEXT REGULATED MARKETS
                                                                                                                                                          MARKET YTD
                           Average Ytd. Performance          Average Mtd. Performance                                                            Average Ytd. Performance          Average Mtd. Performance

      -8,51%                        -7,00%
                          -10,11%                                                                                                                                                                     -13,95%                -14,52%
               -14,98%                          -17,18% -16,39%                                                                                            -20,37%              -20,12%
                                                                                -18,54%              -17,70%                                                                                -22,11%                -21,68%
                                                                      -21,26%              -21,29%                                                                    -27,37%
                                                                                                                                                 -28,92%
                                                                                                                                    -37,18%
                                                                                                                          -47,59%

         Utilities          Health Care          Basic Materials         Financials           Technology                      Oil & Gas            Industrials       Consumer Services          Telecom            Consumer Goods

                                             │ Source: Factset, Euronext, as of 3 April 2020
                                             │ *The Vstoxx indices are based on Euro Stoxx 50 real-time options prices and are designed to reflect the market expectations of near-term up to long-term volatility by                  │3
                                               measuring the square root of the implied variance across all options of a given time to expiration.
EURONEXT BLUE CHIPS PERFORMANCE
Major indices constituents’ over and under performers
INDEX OVER AND UNDER PERFORMERS
WEEKLY OVER PERFORMERS WEEKLY UNDER PERFORMERS WEEKLY OVER PERFORMERS WEEKLY UNDER PERFORMERS
Last Volume Last Volume Last Volume Last Volume
YTD MTD WTD YTD MTD WTD YTD MTD WTD YTD MTD WTD
Company Name Price 1W/ 3M Company Name Price 1W/ 3M Company Name Price 1W/ 3M Company Name Price 1W/ 3M
Perf. Perf. Perf. Perf. Perf. Perf. Perf. Perf. Perf. Perf. Perf. Perf.
€ Average (x) € Average (x) € Average (x) € Average (x)
BEL20 INDEX
ROYAL DUTCH
AEX INDEX
16.7 -34.18% 3.66% 11.97% 1.08 TELENET GROUP 30.8 -23.12% 12.24% 8.07% 0.91 ING GROEP N.V. 4.6 -56.77% -3.38% -7.46% 1.43
SHELLA ADYEN 691.2 -5.44% -10.30% -11.81% 1.09
UMICORE 33.0 -23.89% 3.61% 7.46% 0.63 GBL 67.4 -28.22% -5.84% -4.04% 0.98
TAKEAWAY 72.6 -11.70% 5.65% 6.42% 0.58 AEGON 2.1 -48.61% -9.68% -10.53% 0.99
UCB 80.1 12.98% 1.39% 6.06% 0.85 BPOST 6.2 -39.71% -3.42% -3.78% 0.52
UNIBAIL-
AHOLD DEL 22.4 0.65% 5.43% 4.44% 1.08 AHOLD DEL 22.4 0.65% 5.43% 4.44% 1.08 ELIA 92.8 17.32% 4.15% -3.53% 0.80
RODAMCO-WE 45.2 -67.85% -12.30% -7.83% 1.20
UNILEVER DR 44.3 -13.62% -1.24% 1.14% 0.96 ING GROEP N.V. 4.6 -56.77% -3.38% -7.46% 1.43 ACKERMANS
COLRUYT 50.6 8.95% 2.78% 3.14% 1.24 V.HAAREN 114.7 -17.90% -3.37% -2.80% 0.73
DSM KON 104.3 -10.16% 0.77% 0.48% 0.71 RANDSTAD NV 28.9 -46.86% -10.07% -6.92% 1.09
WEEKLY OVER PERFORMERS WEEKLY UNDER PERFORMERS WEEKLY OVER PERFORMERS WEEKLY UNDER PERFORMERS
Last Volume Last Volume Last Volume Last Volume
YTD MTD WTD YTD MTD WTD YTD MTD WTD YTD MTD WTD
Company Name Price 1W/ 3M Company Name Price 1W/ 3M Company Name Price 1W/ 3M Company Name Price 1W/ 3M
Perf. Perf. Perf. Perf. Perf. Perf. Perf. Perf. Perf. Perf. Perf. Perf.
€ Average (x) € Average (x) € Average (x) € Average (x)
CAC40 INDEX
ORIGIN ENT. PLC 2.4 -35.71% 19.37% 21.93% 0.70 GLANBIA PLC 7.7 -24.81% -21.83% -18.36% 1.98
ISEQ INDEX
PUBLICIS
27.2 -32.71% 3.98% 16.42% 1.22 SAFRAN 63.0 -54.23% -21.39% -25.80% 1.24
GROUPE SA DALATA HOTEL
2.6 -49.90% 4.45% 17.81% 0.98 IRISH RES. PROP. 1.1 -32.83% -12.46% -13.59% 1.89
VIVENDI 19.4 -24.86% -0.64% 6.71% 1.03 AIRBUS 49.5 -62.06% -16.57% -18.75% 1.60 GP.
SOCIETE APPLEGREEN PLC 2.4 -56.79% 11.01% 16.35% 3.93 AIB GROUP PLC 0.9 -71.22% -12.52% -11.57% 1.14
CARREFOUR 15.1 0.94% 4.68% 6.19% 0.75 12.8 -58.73% -16.60% -17.08% 1.34 TOTAL PRODUCE BANK OF
GENERALE 0.9 -37.06% 5.88% 6.51% 2.97 1.6 -67.12% -6.90% -10.49% 1.48
PLC IRELAND GP
AIR LIQUIDE 115.2 -8.72% -1.24% 2.31% 0.91 CAPGEMINI 67.5 -38.00% -12.31% -13.44% 0.78
FLUTTER KERRY GROUP
MICHELIN 77.9 -28.62% -3.92% 1.83% 0.95 VINCI 63.8 -35.52% -15.33% -12.55% 1.06 79.4 -24.18% -4.03% 6.35% 1.54 92.5 -16.79% -12.12% -10.07% 1.25
ENTERTAIN PLC
WEEKLY OVER PERFORMERS WEEKLY UNDER PERFORMERS WEEKLY OVER PERFORMERS WEEKLY UNDER PERFORMERS
Last Volume Last Volume Last Volume Last Volume
YTD MTD WTD YTD MTD WTD YTD MTD WTD YTD MTD WTD
Company Name Price 1W/ 3M Company Name Price 1W/ 3M Company Name Price 1W/ 3M Company Name Price 1W/ 3M
Perf. Perf. Perf. Perf. Perf. Perf. Perf. Perf. Perf. Perf. Perf. Perf.
OSLO OBX INDEX
€ Average (x) € Average (x) € Average (x) € Average (x)
PSI20 INDEX
B.COM.PORTUG DNO 0.4 -58.25% 65.58% 80.54% 2.53 FRONTLINE 7.3 -38.65% -17.90% -23.54% 2.68
SONAE CAPITAL 0.4 -43.56% 5.99% 8.70% 1.71 0.1 -56.07% -13.07% -15.30% 1.58
UES
BW OFFSHORE NORWEGIAN
SEMAPA 8.0 -42.06% 2.58% 4.74% 1.04 NOVABASE,SGPS 2.5 -1.55% -4.87% -9.29% 1.20 2.0 -61.08% 27.85% 52.97% 1.45 0.7 -78.01% -8.19% -8.10% 0.83
LIMITED AIR SHUTTLE
SONAE 0.6 -33.85% 2.12% 4.42% 1.17 PHAROL 0.1 -36.35% -7.04% -7.85% 1.40 AKER BP 13.6 -46.13% 17.01% 33.41% 1.96 BW LPG 2.6 -60.27% -7.15% -5.14% 1.04
GALP ENERGIA- TGS-NOPEC
10.4 -30.47% -0.34% 3.81% 1.23 IBERSOL,SGPS 4.6 -42.50% -3.36% -6.31% 2.43
NOM GEOPHYSICAL 12.2 -47.96% 19.01% 28.10% 1.23 NORSK HYDRO 1.8 -36.83% -8.84% -4.65% 0.91
CTT CORREIOS COMPANY
ALTRI SGPS 3.6 -35.81% 0.66% 3.29% 0.67 2.2 -30.72% -3.24% -3.16% 1.17
PORT TOMRA
SUBSEA 7 5.0 -45.69% 15.06% 25.33% 1.25 24.9 1.72% -2.81% -1.22% 0.73
SYSTEMS
│ Source: Factset, Euronext, as of 3 April 2020 │4
EURONEXT TRADING VALUES AND VOLUMES
      In the past week lower levels of volatility resulted in lower turnover
                                TRADED VALUE 2019 FY TO 2020 YTD                                                                                  TRADED VALUE ACROSS EURONEXT MARKETS*
                                                                                                                       Traded Value in billions EUR                    Traded Value in millions EUR
                                                                                                                       25                                                600
Traded value in billions EUR                    Traded value in billions EUR
30                                               30                                                                                                                      500
                                                                             9-Mar; 23.6bn    20-Mar; 24.7bn           20
25                                               25                                                                                                                      400
                                                                    28-Feb; 24.1bn                                     15
20                                               20                                                                                                                      300
             2019 average;                                                                                             10
15                                               15                                                                                                                      200
             7.8bn
10                                               10                                                                      5                                               100

5                                                 5                                                                     -                                                 -
                                                                                                                        2019-01- 2019-05- 2019-09- 2020-01-               2019-01- 2019-05- 2019-09- 2020-01-
 -                                                 -                                                                       02       13       16       23                     02          13        16      23
  Jan-19     May-19    Sep-19       Jan-20             2-Jan         1-Feb            2-Mar               1-Apr
                                                                                                                                     Compartment A                       Euronext Growth    Compartment C Compartment B

                   TRADED VALUE RECENT EVOLUTION BY EURONEXT LOCATION                                                                             TRADED VALUE ACROSS EURONEXT MARKETS*
     Traded value in billions EUR                                                                                                             Comp. C and Euronext
                                                                                                   Paris                Period                                                 Comp. B (€bn)          Comp. A (€bn)
     120                                                                                                                                         Growth (€bn)
     100                                                                                           Oslo                 Week 14                      0.52                            0.67                43.60
      80
                                                                                                                        Week 13                      0.38                            0.87                55.12
      60                                                                                           Lisbon
      40                                                                                                                Mar-20                       1.64                            5.33                311.18
      20                                                                                           Dublin               Feb-20                       1.94                            3.97                198.44
      -                                                                                                                 Jan-20                       1.28                            3.00                153.48
                                                                                                   Brussels
           Week Week Week Week Week Week Week Week Week Week Week Week Week Week
                                                                                                                        Q1 2020                      4.60                           11.99                644.95
            1    2    3    4    5    6    7    8    9    10 11 12 13 14                            Amsterdam
           2020 2020 2020 2020 2020 2020 2020 2020 2020 2020 2020 2020 2020 2020                                        Q1 2019                      2.37                            7.48                423.71

                                             │ Source: Euronext Optiq data (Amsterdam, Brussels, Dublin, Lisbon and Paris) & Oslo Bors Millennium data for Oslo markets, as of 3 April 2020
                                             │ *Figures exclude trading volumes from Oslo markets
                                                                                                                                                                                                                          │5
DCM ACTIVITY ON EURONEXT MARKETS
Euronext fixed-income listing activity
EXAMPLES OF CORPORATE BONDS ISSUANCES 2020 YTD NUMBER OF CORPORATE BONDS ISSUANCES BY EURONEXT LOCATION
Date of Amount Issued
Issuer Name Market Location
Issuance (€m)
31/03/20 Euronext Access Lisbon 25 14
SALVADOR CAETANO AUTO SGPS SA
NORGES GRUPPEN ASA 30/03/20 Oslo Bors Oslo 29
27/03/20 Euronext Paris 1000 12
ENGIE
MMB SCF 25/03/20 Euronext Paris 120
Paris
UNILEVER N.V. 25/03/20 Euronext Amsterdam 1000
5 Olso
Oslo
DANONE 17/03/20 Euronext Paris 800
10
SCHNEIDER ELECTRIC SE 11/03/20 Euronext Paris 800 Lisbon
KORIAN 10/03/20 Euronext Access Paris 400 Dublin
TEREGA SAS 27/02/20 Euronext Paris 400 Amsterdam
CRH-CSE DE REFINANCT HABITAT 07/02/20 Euronext Paris 1250
4
THALES 29/01/20 Euronext Paris 500
3
NEOPOST S.A. 23/01/20 Euronext Paris 325 1
TURKIYE IS BANKASI AS 22/01/2020 Euronext Dublin 679 1
2
SFL CORPORATION LTD 21/01/2020 Oslo Bors Oslo 59 3
2
ARKEMA 21/01/20 Euronext Paris 300 1
AIR FRANCE KLM 16/01/20 Euronext Paris 750 JAN
Jan-20 FEB
Feb-20 MAR
Mar-20
MOTA-ENGIL SGPS S.A 15/01/20 Euronext Access Lisbon 50
SECIL-COMPANHIA GERAL DE CAL E
15/01/20 Euronext Access Lisbon 60
CIMENTO S.A.
│ Source: Euronext, as of 3 April 2020 │6
│ Corporate bond issuances 2020 YTD excluding listings from financial and public issuersFUNDS FLOWS IN EUROPE
Inflows and outflows on European equities
INFLOWS AND OUTFLOWS* EVOLUTION IN EU-27 ZONE BY ASSET CLASS FLOWS* ON EURONEXT EQUITIES** BY INDUSTRIES
Equity Mixed Assets Other Money Market Bond Funds Flows in billions EUR
1,5
Flows 1W
(in €B) 1,0
0,5
Flows 1M
(in €B)
0,0
Flows 1Y
(in €B)
-0,5
-200,00 -150,00 -100,00 -50,00 0,00 50,00 100,00 150,00 200,00 250,00 300,00
-1,0
Asset Class Flows 1Y (€bn) Flows 1M (€bn) Flows 1W (€bn)
Bond 260.07 -135.31 -3.87
-1,5
Money Market 50.94 -109.75 -77.24
Other -20.34 -17.92 -2.66
Mixed Assets -37.37 -36.91 -1.25
12M YTD 1M
Equity -77.94 -51.21 7.87
│ Source: Thomson Reuters, Lipper, with 1-month figures until 31 March 2020 and 1-week figures until 1 April 2020
│ *Includes Mutual Funds and ETFs │7
│ **All equities listed on Euronext markets including Oslo equitiesCORPORATE ACTIONS AND FINANCIAL REPORTING
Euronext is committed to ensure business continuity
CORPORATE ACTIONS FINANCIAL REPORTING
During the confinement period, will Euronext be able to manage corporate events? Does Euronext intend or do the regulators intend to extend the deadline for publishing
Euronext’s teams are fully mobilised to ensure the continuity of market activities under the accounts (Growth and Access)?
best possible conditions. Most of Euronext’s teams are working remotely whilst operating a In accordance with Chapter 4 of the Euronext Growth Market Rules, companies admitted on
fully functional infrastructure. Currently all corporate events are proceeding normally. Access (Paris, Brussels, Lisbon) and Growth (Paris and Lisbon) are required to publish an
annual report including audited annual financial statements and consolidated financial
What if my company has already announced a cash distribution and needs to cancel it? statements, if applicable, and an annual management report. This publication must be made
For any corporate event (creation, update, cancellation), please contact Euronext's Corporate within four months of the end of your financial year.
Actions Department (corporateactionsfr@euronext.com) and your main contact at Euronext
as soon as possible, and no later than two trading days prior to the corporate event.
For companies with a fiscal year ending 31 December 2019, the publication (on the company
A cash distribution has already been announced but I need to move the payment date to a website) must be effective no later than 30 April 2020.
later date? What is the procedure?
The payment date is not covered by Euronext’s rules. As a market operator, Euronext does not Euronext will monitor the communications made (publication of financial statements or
play any particular role but has to be informed and inform the market no later than two announcement of postponement) after the 30 April 2020 deadline. As part of its controls,
trading days prior to the event. You can contact your paying agent and CSD that will assist you Euronext will follow the recommendations of ESMA and the national regulators (e.g. FSMA,
on this matter. AMF): the reminder to non-compliant issuers will be postponed for a period of two months
beyond the deadline for annual financial reports for a financial year ending between 31
Does Euronext have in place a plan or strategy for pandemic planning, and has it been December and 31 March.
reviewed in the context of COVID-19?
Yes, Euronext has a pandemic plan in place. The pandemic plan and business continuity plans
have been leveraged with respect to COVID-19. Reinforced actions include daily monitoring of What if my company is unable to publish its annual financial accounts by end of April due to
government guidance to enable agile decision-making. Euronext’s federal and decentralised COVID-19?
model supports the arrangements put in place and avoids high concentration of any of its In the current exceptional circumstances and in anticipation of the difficulties encountered by
critical departments to preempt as much as possible risks in any one of its locations. some companies, issuers that are unable to publish their financial reports within the deadlines
must notify Euronext (for Euronext Access and Euronext Growth) or the competent regulator
(for the regulated markets and Euronext Growth Brussels) and inform the market (in advance)
by indicating the reasons for the delay and an expected publication date.
│ More information can be found at the following link: www.euronext.com/en/for-investors/market-quality/resilience-during-volatility
│ ESMA published a statement on publication deadlines on 27 March 2020:
│ https://www.esma.europa.eu/sites/default/files/library/esma31-67-742_public_statement_on_publication_deadlines_under_the_td.pdf │8DIVIDEND POLICIES AND EQUITY DERIVATIVES (1/6)
Understand the impact of dividends on derivatives
KEY TAKEAWAYS ON DIVIDEND POLICIES EXPIRY DATES AND EXTRAORDINARY DIVIDENDS
How the postponement of AGMs and dividend policies can impact the pricing of your What are the expiry dates for options in 2020?
derivatives? Options expire several times a year. The standard expiry date is the third Friday of the expiry
Derivatives classes may have been introduced on your company’s shares. A derivative listing month (calendar month) unless the third Friday is a public holiday and the exchange is closed,
on Euronext involves a number of benefits, including but not limited to, enhancing interest in which case it is the third Thursday. List of all upcoming expiry dates for year 2020:
and liquidity in a company’s share and, as various studies have shown, a possible stabilising
effect on the underlying share price during the day. April 17/04/2020
May 15/05/2020
In the unprecedented context brought on by COVID-19, several European national competent June 19/06/2020
authorities are considering exceptional measures, such as allowing the postponement of July 17/07/2020
AGMs for issuers or reviewing public funding in light of dividend policies. These measures can August 21/08/2020
impact your dividend policy, and subsequently the pricing of your derivatives. You can read September 18/09/2020
the best practices to maximise the smooth pricing of derivatives on: October 16/10/2020
https://connect.euronext.com/en/support/derivatives-markets. November 20/11/2020
December 18/12/2020
To protect investors, it is important that you avoid announcing any high impact corporate Ordinary of extraordinary? Wording matters
actions with price-sensitive consequences on or just before an expiry Friday. Nor it is It is important that issuers use the right terminology when qualifying their dividends in their
preferable to change a dividend date so that it moves from before a certain expiry Friday to communications. The wordings “Special, Extra or Extraordinary” should only be used when
after that expiry Friday. This has an immediate impact on the pricing of the derivatives appropriate as only non-ordinary dividends lead to a derivatives contract adjustment by
because dividends are an important part of the formation of option prices. The price of a Euronext. An ordinary dividend for the year 2019 should not be requalified as Extraordinary
derivative (options and futures) is based on the following: if in current environment:
• Its payment is postponed later in 2020;
• Underlying share price • It is reduced;
• Volatility • It is paid out from reserves and not results.
• Interest rate
• Dividend In doubt, do not hesitate to liaise with Euronext as individual cases may be more specific.
• Lifetime of the contract
│9DIVIDEND POLICIES AND EQUITY DERIVATIVES (2/6)
Understand the impact of dividends on derivatives
HOW DO YOU PRICE AN OPTION?
How is the price of an option calculated?
Market Makers are the lubricant of our options markets, they have agreed to a contract to
share price
continuous put prices into the market at which others may trade with them, in this way
providing liquidity to our markets. When doing so, Market Makers (MMs) generally do not do
this based on a directional view of the market but based on a risk neutral pricing model.
In other words: the Market Maker calculates the prices of the options based on a pricing model
(for Equity Options that would normally be the Cox, Ross & Rubinstein model or a variant there time
of). A number of parameters are used to calculate option prices in such models, including:
▪ Current price of the underlying shares Dividend
▪ Current interest rates
▪ Expected volatility during the lifetime of the option
▪ Expected dividend payments during the lifetime of the option What is the impact on option holders around dividend?
In this document we concentrate on the impact of the last one: the expected dividends Dividends are paid to shareholders, not to option holders!
Why are dividends important for the price of an option? What happens to the option when a dividend is paid on the underlying shares?
If a share pays out a dividend, the share price will at that point in time drop by the dividend The answer is not necessarily the same for all options but let’s look at a put option first. If there
amount. The date on which the share trades ex-dividend is the crucial moment there. If a share is an option like this one: the right to sell the underlying shares at €75 (e.g. an August 75 Put
trades at €70 on a certain day (day 1) and the next day (day 2) the share trades ex-dividend, with option). And the example is the same as above. According to the pricing model, there will be a
the dividend amount being €1.50, the model assumes the share price on the ex-dividend date drop in the share price on the ex-date of €1.50 and if the share price was €70 before the ex-
will be €68.50. Reasoning behind this: if I can buy a share at €70 on day 1, on day 2 I will receive date, it will (theoretically) be €68.50 on the ex-date. The option, which gives the holder the right
€1.50 dividend, so effectively my share will be worth only €68.50 on day 2. to sell the shares at €75 has now become more valuable: if I have the right to sell the shares at
€75 with the share price at €68.50, the option has an intrinsic value of €6.50 (75 – 68.50), where
So the pricing model anticipates a theoretical drop in the share price on the ex-dividend date, it had an intrinsic value of €5.00 the day before (75 – 70).
equal to the dividend amount.
So for put options there is a pricing effect around dividends.
│ 10DIVIDEND POLICIES AND EQUITY DERIVATIVES (3/6)
Understand the impact of dividends on derivatives
HOW DO YOU PRICE AN OPTION?
And for call options? Both of these are basically unknown to everyone, yet they should be assessed in order to
properly price an option. In general, when looking at ex-dividend dates, we know that basically
If there was a call option that gives the right to buy the shares at €65 (e.g. an August 65 call),
the ex-dividend date will be the day after the AGM. And most companies have a steady policy
and the same dividend event happens as before, this is the picture: before the ex-date, with a
for the dates of their AGMs. So predicting the AGM date and therefore predicting the ex-
share price of €70, the option will have an intrinsic value of €5 (70-65). In other words: the
dividend dates is generally not overly complex.
option will be worth at least €5. Reasoning if I would be able to get (buy) the option for €0.00
and exercise it immediately (getting the shares for €65) and sell those shares again in the For the dividend amounts it is a bit harder.
market for the market price (€70) I would have an instant profit of €5.00. This determines that There are three sources of information that help the MM to anticipate forthcoming dividends:
in this case the price of the option would be at least €5.00. Next to that the price of the option
may contain time value. ▪ The past (what are the dividends paid out in past years)
If now the share trades ex-dividend of €1.50 on the next day, the pricing model assumes the ▪ The present (what is the current situation of the company)
share price will drop to €68.50. There will be impact on the intrinsic value of the August 65 Call ▪ The future (what dividends are forecasted by independent forecasters)
option. The intrinsic value will in that situation only be €3.50 (68.50 – 65). So due to the fact that
the shares trade ex-dividend of €1.50, the price of the option drops €1.50 in value. So for call
options, just as for put options, there is a pricing effect around dividend. Based on all of that, the MM needs to predict the dividends. And as we have options in our
markets with lifetimes up to 5 years, Market Makers need predict all dividends for the next 5
(In real life, someone owning such a call option prior to the ex-dividend may want to exercise
years.
his option before the ex-dividend data. This way he will collect the dividend).
The dividends that impact the pricing of options the most are the dividends that are closest to
How does this impact the pricing of options?
the current date. In the next slide, we will share some examples of the pricing of options with
Anyone calculating the price of an option, including MMs, needs to take into account dividends, dividends that are within a few months away of the current date.
as stipulated above.
There are 2 dimensions of dividends that are important when pricing options:
▪ The ex-dividend date
▪ The dividend amount
│ 11DIVIDEND POLICIES AND EQUITY DERIVATIVES (4/6)
Understand the impact of dividends on derivatives
CASE STUDY
Example 1: prices with no dividend involved Example 3: prices with dividend of €1.50
The share price now is €70 and we are looking The share price now is €70 and we are looking
Div = €0.00 at two options which expire in 4 months time. Div = €1.50 at two options which expire in 4 months time.
August 65 Call August 65 Call
August 65 Put
August 65 Put
There are no dividends foreseen during the time
time lifetime of the option (between now and now A dividend of €1.50 is anticipated during the
now expiry
expiry august), the prices of the options are (with lifetime of the option, 3 month from now, the
given interest rates and volatilities): prices of the options are (with given interest
August 65 Call €6.91 rates and volatilities):
August 65 Put €1.89 August 65 Call €6.56
August 65 Put €2.36
Example 2: prices with dividend of €1.50 Example 4: prices with dividend of €0.50
The share price now is €70 and we are looking at The share price now is €70 and we are looking
two options which expire in 4 months time. Div = €0.50 at two options which expire in 4 months time.
Div = €1.50
August 65 Call August 65 Call
August 65 Put
August 65 Put
A dividend of €1.50 is anticipated during the lifetime time
time of the option, 1 month from now, the prices of the A dividend of €0.50 is anticipated during the
now expiry options are (with given interest rates and
now expiry
lifetime of the option, 3 month from now, the
volatilities): prices of the options are (with given interest
August 65 Call €6.12 rates and volatilities):
August 65 Put €2.36 August 65 Call €6.75
August 65 Put €2.04
│ 12DIVIDEND POLICIES AND EQUITY DERIVATIVES (5/6)
Understand the impact of dividends on derivatives
COVID-19 AND DERIVATIVES
A summary of the option prices from the above scenarios: Similarly it would impact he pricing of other options, in particular the options with a relatively
short time to expiry as demonstrated in the earlier examples. If the dividend in the examples
was predicted to be €1.50 in one month time, the 4-month call option would have a price of
Call price Dividend amount Dividend date Put €6.12 (ex.2). If then the AGM was moved several months away to end up after the expiry of the
Example 1 €6.91 -- -- €1.89 option, the price of the option would be €6.91 (ex.1).
Example 2 €6.12 €1.50 1 month away €2.36
Example 3 €6.56 €1.50 3 months away €2.36 Market Makers quote options in the market based on the theoretical prices they calculate and
Example 4 €6.75 €0.50 3 months away €2.04 with a certain spread. There are maximum spreads which the MM must live up to. If in this
example the maximum spread would be €0.50, that would create the following markets for
these examples:
The largest pricing effect is seen in the call options.
Where are we today? Call price Bid price Ask price Dividend amount Dividend date
As explained before, MMs use the predictable AGM dates as forecasted ex-dividend dates. Example 1 €6.91 €6.66 €7.16 -- --
Generally speaking, a lot of companies have their AGMs planned for the time frame “March Example 2 €6.12 €5.87 €6.37 €1.50 1 month away
until June”. With options basically expiring on the third Fridays of April and May and June, the
exact timing of the AGM becomes pretty important for pricing options.
If an AGM was planned to take place in April, before the April expiry (third Friday) and would As demonstrated above, the bid and ask prices under the different scenarios are such that the
move into the first week of May, that would have large impact on the pricing of April options. bid price of ex.1 is higher than the ask price of ex.2.
MMs would have priced in the dividend into April options but with the mover of the AGM to In general one could argue that the proper predictions of dividend amounts and dividend dates
after the April expiry, there would no longer be a dividend during the lifetime of the April are part of the daily business of Market Makers. However if there is general uncertainty in the
options. market in relation to AGM dates and dividends, especially if such uncertainties would be coming
from rules or laws, these additional uncertainties would unduly impair the proper functioning of
the market. Basically uncertainty creates additional risk and/or may cause Market Makers to be
no longer able to provide prices which in turn would impair the proper functioning of the
markets.
│ 13DIVIDEND POLICIES AND EQUITY DERIVATIVES (6/6)
Understand the impact of dividends on derivatives
ORDINARY VS EXTRAORDINARY DIVIDENDS
Special dividends and option pricing Could such corporate actions adjustments be made to cater for postponing of AGMs?
When companies pay out special dividends, these are generally unpredictable (e.g. related to Apart from what our corporate actions policy says: a corporate actions adjustment needs an
special financial results in the company). Euronext (like other trading venues) has special rules event. The “not paying out of a dividend” is not an event so it would not be very straight
and procedures in place to cater for such special dividends (and other corporate actions that are forward to make such adjustments. And if the AGM was postponed and a dividend would be
not in line with every day operation of the underlying company). paid out say in 4 months’ time (instead of in 3 weeks’ time), how would we want/need to look at
In such cases trading venues make adjustments to the specifications of the options in order to that dividend in the light of predictability and adjustments?
compensate for such unpredictable events. It is important that issuers use the right terminology when qualifying their dividends in their
Suppose a company pays out a normal dividend every year of about €1.50 in early June. These communications. The wordings “Special, Extra or Extraordinary” should only be used when
dividends, as explained before, are included in the calculation of option prices. And as appropriate as only non-ordinary dividends lead to a derivatives contract adjustment by
demonstrated above, they will impact the resulting prices of options. If now at the AGM the Euronext. An ordinary dividend for the year 2019 should not be requalified as Extraordinary if
company decides to pay out an additional special dividend of say €2.50 per share, this will in current environment:
impact the prices of options. As there was no way anyone could have anticipated this, Euronext • Its payment is postponed later in 2020;
compensates for such unpredictable events.
• It is reduced;
Compensations are made by slightly adjusting the contract specifications (strike price and • It is paid out from reserves and not results.
contract size of the options) in such a way that the economic value of the options before the
special dividend and after the special dividend are identical. From an options-economic In doubt, do not hesitate to liaise with Euronext as individual cases may be more specific.
perspective special dividends have no impact at all on holders of options. They are economic
non-events.
│ 14TRADING SAFEGUARDS ON EURONEXT MARKETS
Euronext’s market protection and detection mechanisms
Euronext’s general philosophy is not to halt trading except in extreme circumstances. To achieve this, Euronext does not rely on circuit-breakers alone, but on a full set of trading safeguards.
Over the years, Euronext has developed a complete set of mechanisms that go beyond market protection and are designed to prevent situations of disorderly markets and detect unusual events.
All the market protection mechanisms are discussed and validated with local regulators, ensuring that Euronext is constantly improving the safety net across all its regulated markets.
EURONEXT MARKET SURVEILLANCE METHODOLOGY EURONEXT DYNAMIC AND STATIC COLLARS
Prevention Dynamic collars
DYNAMIC STATIC
Market protection mechanisms include: Are based on the dynamic reference PRODUCT
COLLARS COLLARS
• the capacity to reject aberrant orders (unusually large in size or in units/price) before price, which is taken from the last
they enter the market; traded price and is amended with each
• the capacity to halt instruments subject to single orders that might disrupt the market; new trade throughout the trading day. All AEX, BEL
20, CAC 40,
• the capacity to prevent significant price variations (dynamic or static collars). This safeguard threshold automatically
Thresholds ISEQ 20 and +/- 3% +/- 8%
halts trading on a stock if its price PSI 20
Detection reaches +/−5% price variation (or +/-3% constituents
A comprehensive set of algorithm-powered alerts that are triggered by Euronext’s if the stock is part of a flagship index)
monitoring systems and handled in near real-time by analysts from the Cash Market team on the dynamic collar reference price. Other
Thresholds +/- 5% +/- 10%
ensures fair and orderly markets as well as investigation and resolution where needed. Equities
Static collars
Reservation periods Are based on the static reference price, All securities
which is taken from the opening price Minimum that are
Dynamic and static collars constitute the first and second layers of Euronext’s circuit-breaker
Trading Halt traded on a 3 minutes 3 minutes
mechanism, respectively. The reference price is used to calculate both collars. The reference of the security if it has traded on the duration continuous
price changes throughout the trading day after each trade, with the last traded price same day, or the last reference price basis
becoming the new reference. from the previous trading day. This
Reservation periods limit the impact of any unexpected sharp price movements whilst giving safeguard threshold automatically halts Minimum
the market ample time to review orders and investment decisions before trading resumes. trading on a stock if its price reaches Trading Halt All AEX, BEL
+/−10% price variation (or +/-8% if the duration: 20, CAC 40,
stock is part of a flagship index) on the consecutive ISEQ 20 and 3 minutes 10 minutes
static collar reference price. trading halt PSI 20
in same constituents
direction
│ More information can be found at the following link: www.euronext.com/en/news/trading-safeguards-euronext-markets │ 15MOST RECENT LEGAL AND REGULATORY MEASURES
Update from governments and regulators in the context of COVID -19
ANNUAL GENERAL MEETINGS ANNUAL ACCOUNTS SHORT SELLING
• Law: soften the proxy form modalities and remote voting
procedure; authorize companies to postpone AGMs by 4 • Approval: extension of the deadline for approving
months or have AGMs by webcast (ongoing discussions); accounts by 4 months; • On 17/03, the FSMA announced a short selling ban
BELGIUM • Regulator: the FSMA published a statement on 26/03 • Publication: extension of the deadline for for one month (17/03 – 17/04).
indicating that a new legislation allowing companies to publishing annual accounts by 4 months.
postpone or broadcast their AGMs is currently in progress.
• Law: ordinance published on 26/03 allowing closed session
• Approval: deadline for approving accounts
and virtual AGMs and extending deadline by 3 months
extended by 3 months (ordinance from 26/03); • On 17/03, the AMF announced a short selling ban
FRANCE until 30/06 for the organization of AGMs;
• Publication: deadline for publishing annual for one month (18/03 – 16/04).
• Regulator: the AMF encourages issuers to broadcast
accounts remains unchanged (30/04).
AGMs in real time.
• Law: no specific measure but as under The Companies Act
No specific measure for the Regulated Markets but
in Ireland, companies have to hold their AGMs 15 months
IRELAND after the previous one;
planning to align Euronext Growth Dublin with AIM No specific measure.
London for an extension by 3 months.
• Regulator: no specific recommendation from CBI.
In line with the ESMA statement, the AFM decided to
• Law: no specific measure, only in-person AGMs allowed;
THE NETHERLANDS • Regulator: no specific recommendation from the AFM.
follow the recommendation and apply the deadline less No specific measure.
strictly for issuers*.
• Law: exemption given by the government on 27/03 to
In line with the ESMA recommendation, Oslo Bors
facilitate proxy voting and to authorize companies to have
NORWAY AGMs by webcast until the end of the Corona Act (27/04);
informed companies listed on regulated markets about No specific measure.
deadlines for financial reporting**.
• Regulator: no specific recommendation from the FSA.
• Law: ordinance published on 13/03 allowing AGMs to be
postponed until 30/06; No specific measure but the CMVM has adopted the
PORTUGAL • Regulator: the CMVM encourages issuers to consider both
No specific measure.
position of ESMA to increase reporting.
electronic vote and webcasting.
│ This update is provided by Euronext based on local evolutions and changes, as of 3 April 2020
│ More information and the most recent updates can be found on the websites of local governments and regulators
│ * https://www.afm.nl/en/professionals/nieuws/2020/mrt/esma-wil-soepele-regels-verslaggeving-2019 │ 16
│ ** https://www.oslobors.no/ob_eng/Oslo-Boers/Regulations/Information-and-news/Information-regarding-publication-of-the-annual-report-for-the-fiscal-year-2019WEBINAR FOR ISSUERS ON PORTFOLIO MANAGEMENT
How portfolio managers operate in response to COVID -19
English
15 April 2020 – 3pm
REGISTER
│ 17EURONEXT CORPORATE SERVICES
Access a full set of solutions OUR EXPERTISE
Managing digital communication, e-governance and investor relations in difficult times, all while remaining compliant, are
just some of the challenges brought about by the current circumstances.
Listed companies
Euronext Corporate Services has a suite of solutions which can help you address these challenges and help you navigate already working
this adverse environment digitally and efficiently.
600+ with Euronext
Corporate Services
totalling 2,500+
clients
COMPLIANCE GOVERNANCE
Secure and optimise your Professionals to
Automate insider lists and
governance digitally help listed
ensure MAR compliance
80 companies make
the most out of
capital markets
INVESTOR RELATIONS Number of
Better understand and countries where
engage with investors at the
right time
15+ Euronext
Corporate Services
serves clients
COMMUNICATION
Improve your
visibility and
communication CONTACT US
corporateservices@euronext.com
corporateservices.euronext.com
│ 18
│ More information can be found at the following link: corporateservices.euronext.comEMBRACE EFFICIENCY IN TIMES OF CHANGE
Manage operational efficiency during COVID -19
COMPLIANCE
GOVERNANCE
Automate the management of inside information and insider lists.
The board portal to organise and run board meetings more efficiently.
In light of the recent development with COVID-19, ESMA has issued new guidelines
Enhance collaboration and streamline decision-making processes, even remotely.
for market disclosure and financial reporting. Ensure that you remain compliant
Schedule meetings and share agendas or documents in a secured environment. On
with the European “Market Abuse Regulation” (MAR) and save time with our fully
any device, anywhere.
automated platform.
COMMUNICATION
INVESTOR RELATIONS
Market leader in webinars and webcasts services for financials results,
internal communication, marketing and external communication. Optimise your investor relations team workflow and efficiently
manage relationships with institutional investors.
Host your company’s AGM virtually, from anywhere, and communicate with all
investors and stakeholders simultaneously in an engaging and transparent way. Get ahead of the curve and prepare for a post-COVID-19 world with
our Advisory and IR Solutions.
Our Post-Listing Advisory team can provide market intelligence and
decision-making analytics and support with crafting an effective
equity story.
Shareholder Analysis helps to identify and monitor your shareholder
base and benchmark with your industry.
IR.Manager is an intuitive investor CRM and targeting platform.
│ 19
│ More information can be found at the following link: corporateservices.euronext.comCONTACT DETAILS
Your main contacts at Euronext
You can reach your dedicated representative for any question You can reach specific teams for any question related to your
related to the particular situation in your country: daily activity and corporate actions:
BELGIUM THE NETHERLANDS EXPERTLINE
Benoît van den Hove Rene van Vlerken myquestion@euronext.com
Head of Listing Belgium Head of Listing Netherlands
bvandenhove@euronext.com rvanvlerken@euronext.com
FRANCE NORWAY CORPORATE ACTIONS
Camille Leca Eirik Høiby Ausland corporateactionsfr@euronext.com
Head of Listing France Head of Listing Norway
cleca@euronext.com eirikhoiby.ausland@oslobors.no
Alain Baetens
Head of Large Caps France PORTUGAL
abaetens@euronext.com
Filipa Franco
Guillaume Morelli Head of Listing Portugal
Head of SMEs France ffranco@euronext.com
gmorelli@euronext.com
IRELAND
Orla O’Gorman
Head of Listing Ireland
oogorman@euronext.com
This presentation is for information purposes only and is not a recommendation to engage in investment activities. The information and materials contained in this presentation are provided
‘as is’ and Euronext does not warrant the accuracy, adequacy or completeness of the information and materials and expressly disclaims liability for any errors or omissions. This presentation is
not intended to be, and shall not constitute in any way a binding or legal agreement, or impose any legal obligation on Euronext. This presentation and any contents thereof, as well as any
prior or subsequent information exchanged with Euronext in relation to the subject matter of this presentation, are confidential and are for the sole attention of the intended recipient. All
proprietary rights and interest in or connected with this publication shall vest in Euronext. No part of it may be redistributed or reproduced without the prior written permission of Euronext.
Euronext refers to Euronext N.V. and its affiliates. Information regarding trademarks and intellectual property rights of Euronext is located at https://www.euronext.com/terms-use.
© 2020, Euronext N.V. – All rights reserved.
│ 20You can also read