Prototype Spatio-temporal Predictive System of pest development of the codling moth, Cydia pomonella, in Kazakhstan
←
→
Page content transcription
If your browser does not render page correctly, please read the page content below
Hellenic Plant Protection Journal 13: 1-12, 2020
                                                                                      DOI 10.2478/hppj-2020-0001

Prototype Spatio-temporal Predictive System of pest
development of the codling moth, Cydia pomonella,
in Kazakhstan

A. Afonin1,*, B. Kopzhassarov2, E. Milyutina1, E. Kazakov3,4, A. Sarbassova2
and A. Seisenova2

Summary A prototype for pest development stages forecasting is developed in Kazakhstan exploit-
ing data from the geoinformation technologies and using codling moth as a model pest in apples. The
basic methodology involved operational thermal map retrieving based on MODIS land surface tem-
perature products and weather stations data, their recalculation into accumulated degree days maps
and then into maps of the phases of the codling moth population dynamics. The validation of the pre-
dicted dates of the development stages according to the in-situ data gathered in the apple orchards
showed a good predictivity of the forecast maps. Predictivity of the prototype can be improved by us-
ing daily satellite sensor datasets and their calibration with data received from a network of weather
stations installed in the orchards.
Additional keywords: Codling Moth, day degrees, meteorological stations, land surface temperature, plant
protection, remote sensing

Introduction                                                   oped over the past century (Zlatanova and
                                                               Pastukhova, 1975; Riedl et al., 1976; Zlatano-
According to the data of the Ministry of Agri-                 va, 1978; Welch et al., 1978; Boldyrev, 1981;
culture of the Republic of Kazakhstan (MoA                     Boldyrev, 1991; Knight, 2007; Jones et al.,
RK), inadequate implementation of plant                        2013; Drozda and Sagitov, 2017). The usual
protection measures leads to an increase                       pest development forecast is based on the
in infestation of agricultural lands by pests,                 data of the closest meteorological stations
diseases and weeds, resulting in gross har-                    or according to the interpolated data of me-
vest losses of 2.2 million tons or 191 million                 teorological stations which are extremely
U.S. dollars annually in 80% of the acreage                    sparse (the average distance between the
areas (The Ministry of Agriculture, 2017). Ac-                 nearest meteorological stations in the Re-
curate forecasts allow to conduct the most                     public of Kazakhstan (RK) is more than 100
effective actions during the phases of the                     km). In this regard, farms that are remote
greatest vulnerability of pests.                               from meteorological stations often receive
    Pest forecasting models linking the dy-                    distorted weather information and errone-
namics of the pest development stages with                     ous forecasts since at a complex terrain the
agro-climatic factors (e.g. accumulated tem-                   meteorological conditions in the area be-
perature, precipitation) have been devel-                      tween weather stations can differ largely -
                                                               for example, the average daily temperatures
                                                               can vary up to tens of degrees.
1
                                                                   Today, remote sensing data (land surface
  St. Petersburg State University, St. Petersburg, 7/9
  Universitetskaya nab., St. Petersburg, 199034 Russia.
                                                               temperature – LST – from satellite sensors)
2
  Kazakh Research Institute for Plant Protection and           can supplement meteorological data in the
  Quarantine named after Zhazken Zhiembayev, Kaza-             intervals between weather stations and
  khstan, Almaty, Kazbek-bi, 1.
3
  Russian State Hydrological Institute, V.O. Line 2, 23, St.   make the forecast more precise in space.
4
  Petersburg, 199034 Russia.                                       However, due to the fact that previous-
  LLC «NextGIS», Vavilova, 41, office 2, Moscow, 117312
  Russia.                                                      ly developed methods of agro-climatic fore-
* Corresponding author: afonin-biogis@yandex.ru                casts for pest development are based on

© Benaki Phytopathological Institute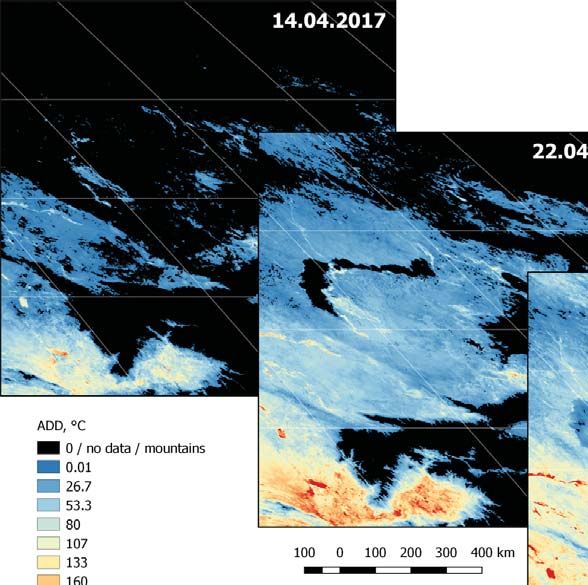
2                                            Afonin et al.

meteorological data, it is necessary to con-         in the East Mediterranean and claimed LST
vert the LST data to match the data from             data to be more accurate than data gathered
weather stations (2 m above the ground).             from meteorological stations and improve
Conversion of such data is widely discussed          the monitoring of the olive fruit fly (Bactro-
in the scientific literature, but a uniform ap-      cera oleae) (Diptera: Tephritidae).
proach has not been developed. The ma-                    Blum et al. (2018) compared MODIS LST
jority of studies discuss regional problems          data and weather stations data in terms of
of modelling temperatures of surface layer           computing thermal thresholds for cotton
of the atmosphere from space thermal im-             bollworm (Helicoverpa armigera), taking also
agery data, focusing on the features of local        into account parameters such as migration
landscapes (Fu et al., 2011; Benali et al., 2012;    patterns and pesticide use. Yones et al. (2012)
Williamson et al, 2014), while in other works        used the thermograph and NOAA satellite
algorithms, usually less successful, for recal-      imagery data in calculating the expected
culations in continental scales (Vancutsem           stages of the cotton leafworm Spodoptera
et al., 2010; Shen and Leptoukh, 2011; Meyer         littoralis (Boisd.), which were further com-
et al., 2016) are proposed.                          pared with in-situ data results and produced
     Land surface temperature (LST) is used          correction factors to improve the predict-
in studies on argoclimatology and Integrat-          ability of their model. Blum et al. (2013) built
ed Pest management (IPM). Sepulcre-Canto             a correction function for LST based on mean
et al. (2007) demonstrated the applicability         differences between LST and in-situ temper-
of LST, derived from Airborne Hyperspectral          atures, included in Fourier series. For areas
Scanner (AHS) and ASTER satellite, in olive          where in-situ measurements were not avail-
and peach orchards parameters indicating             able, these parameters were estimated with
quality. Sona et al. (2012) applied MODIS LST        the use of NDVI data.
data in order to calculate temperature vege-              Thus, despite the fact that the use of raw
tation dryness index (TVDI) in the Lower Me-         LST data shows good forecasting results,
kong Basin. Raw LST data in this study was           conversion of LST to meteorological data is
used along with Normalized Difference Veg-           still relevant to the present discussion, be-
etation Index (NDVI). As already noted, LST is       cause the majority of models for forecasting
also used in monitoring the risks in agricultur-     pest development stages are based on me-
al production such as pest’s infestation. Len-       teorological data. The purpose of this study
sky, I.M. and U. Dayan (2011) outlined the ad-       was the development of a prototype Nation-
vantage of MODIS LST data in providing more          al pest forecasting system in the Republic of
precise predictions about the timing of Helio-       Kazakhstan based on exploitation of both LST
this spp. population expansion in compara-           and meteorological data. In accordance with
sion to weather stations data. LST was used in       the intended aim, codling moth IPM forecast-
defining the spatial differences of sweet corn       ing models were adopted in a spatial mod-
growth and in order to demonstrate the in-           eling system using remote sensing temper-
fluence of topoclimate on the estimating the         ature data, which should improve the spatial
dates of the emergence of adult pest from its        accuracy of the forecasts. The work was con-
eclosion. Marques da Silva et al. (2015) stud-       ducted within the framework of the Project
ied temporal and spatial distribution of South       «GIS forecasting technology for the develop-
American tomato moth, Tuta absoluta (Lepi-           ment of codling moth and apple scab in the
doptera: Gelechiidae) in Portugal comparing          southeast of Kazakhstan» during 2015-2017.
LST MSG satellite data and in-situ meteoro-
logical data. And revealed a linear regression
between Accumulated Degree-Days (ADD)                Materials and methods
calculated from in-situ and LST data. Blum et
al. (2013; 2015) compared MODIS LST data and         Our predictive system was designed to de-
weather stations data for olive grove canopy         fine the spatio-temporal development of

                                                                  © Benaki Phytopathological Institute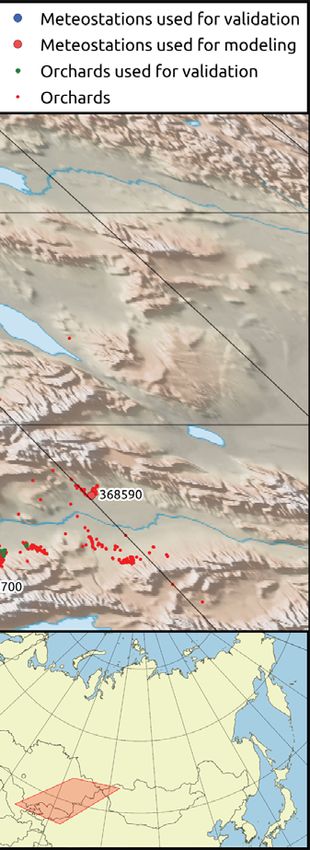
Prototype Spatio-temporal Predictive System for codling moth                               3

vulnerable stages of the codling moth (Cyd-                 from Modis/Terra satellite (MODIS/Terra
ia pomonella L.). This prototype system uses                Land Surface Temperature (LST), 2017). Tem-
average meteorological data from stations                   peratures from the archive of seven meteo-
and data from the MODIS/Terra sensor of                     rological stations with known coordinates
the satellite product MOD11A2.                              were used for calibration and approxima-
                                                            tion of the remote sensing data to the sta-
Study area: The study area is the territory of              tions’ data (Bulygina et al., 2018). The MO-
Southeastern Kazakhstan including more                      D11A2 satellite provides an average 8-day,
than 600 apple orchards (Figure 1).                         per-pixel, LST data in a 1200 x 1200 kilome-
                                                            ter grid, spatial resolution 1 km (Wan et al.,
Data collection and temperature maps: Tem-                  2015).
perature maps were made with the use of
weather stations’ data and data derived                     Phenological model used for ADD calculation:

Figure 1. Southeastern territory of Kazakhstan (sinusoidal projection). Numbers on the map show World Meteorological
Organization IDs of the stations.

© Benaki Phytopathological Institute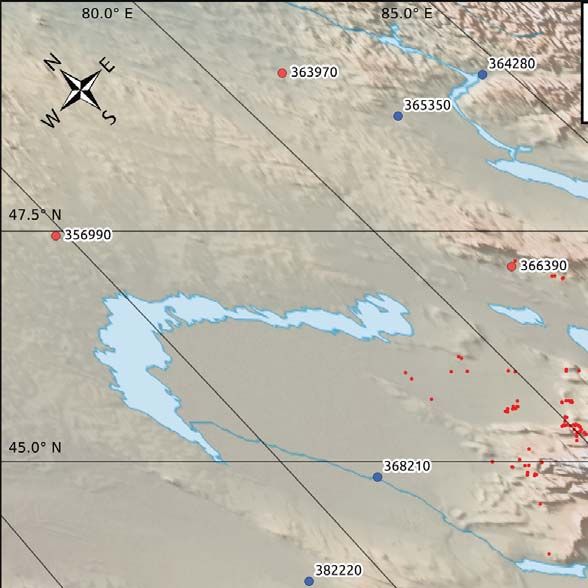
4                                          Afonin et al.

Calculation of ADD and phenological pa-            ment for night and daytime images (LSTday;
rameters of codling moth were based on the         LSTnight). The LST values were taken from the
bioclimatic model by Pralya (2013) (Table 1),      LST maps from the raster cells where seven
in which the lower developmental threshold         meteorological stations are located. A gen-
of the pest is 10°C. Designed for the orchards     eralized regression model for converting
of the European territory of Russia, the mod-      LST into weather stations’ data was calculat-
el of Pralya (2013) predicts the stages of the     ed in the Statistica program (Hill and Lewicki,
South Kazakhstan population of the cod-            2007). Then ADD maps were produced with
ling moth quite well. Nevertheless, the ADD        the cumulative total (Figure 2) and ADD maps
values for the beginning of flight can vary        were recalculated into maps of phenological
widely for different geographic popula-            dates. The modified Pralya model was used
tions of the codling moth (Jones et al., 2013).    to transfer the ADD to phenological dates.
Our observation makes it possible to make              According to the modified Pralya mod-
an assumption about some displacement              el we have determined the fact that the cod-
of flight start date in the orchards of South      ling moth’s flight start date occurs on the
Kazakhstan in comparison with the com-             date of transition through the threshold
mon Pralya model. Therefore, at this stage         of 140 ADD. The final map of phenological
of the study, 140 ADD (above 10°C) was used        dates was created with the use of raster re-
as flight start date ADD. In Kazakhstan or-        calculation. Fifteen 8-day period ADD maps
chards pheromone traps are not consistent-         were used as input data. On each of fifteen
ly used, so we used dates of transition over       8-day period ADD maps we identified pix-
140 ADD as flight start date for the entire        els, where transition through the threshold
territory of the study. These ADD in accor-        of 140 ADD occured for the first time during
dance with the data of the model were used         the relevant 8-day periods. These pixels are
to calculate other dates of the most vulnera-      highlighted in green in the lower four maps
ble stages of the codling moth and to build        of Figure 3. During the reclassification, the
maps of phenological dates. The ADDs ma-           values of Julian dates of the relevant 8-day
trix was calculated using an image calculator      period, in which the transition through 140
module in Idrisi software (Eastman, 2012).         ADD occurs, were assigned to these pixels.
                                                   Such operation of reclassification was ap-
Temperature maps and ADD calculation: Since        plied to all 15 layers, then these layers were
the average 8-day remote sensing LST data          summed up. Thus, after summing the re-
were used, the weather stations’ mean dai-         classification results, a single raster was ob-
ly temperatures were also previously recal-        tained, where each pixel contains a date of
culated to the average temperatures for fif-       transition over 140 ADD. This map is pre-
teen 8-day periods (from 14 March until 11         sented in Figure 3 (upper map).
July 2017). The average 8-day LST was cal-
culated as the mean temperature measure-           Model validation: A two-stage verification of

Table 1. The dependence of the codling moth number dynamic phases from Accumulated
Degree Days (ADD) above 10° C according to Pralya (2013).

                          Codling moth first                                      ADD
Stage                                        Larva hatching, %
                               flight, %                         1st generation     2nd generation
Emergence                         5                  0               75-120              600-620
Rise in number                   25                 1-2             170-190              680-700
Peak period                      50                25-30            260-270              960-980
Decline in number                75                45-50            370-380             1140-1160
End of development               95                70-75            480-520             1300-1350

                                                                 © Benaki Phytopathological Institute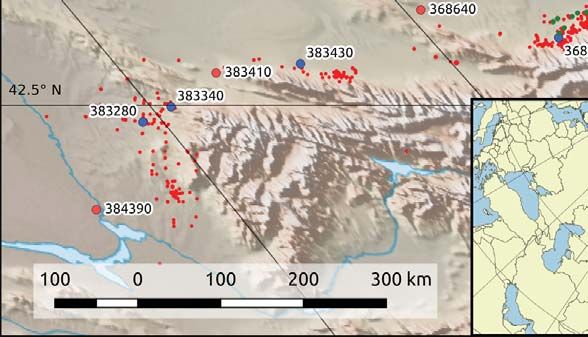
Prototype Spatio-temporal Predictive System for codling moth 5
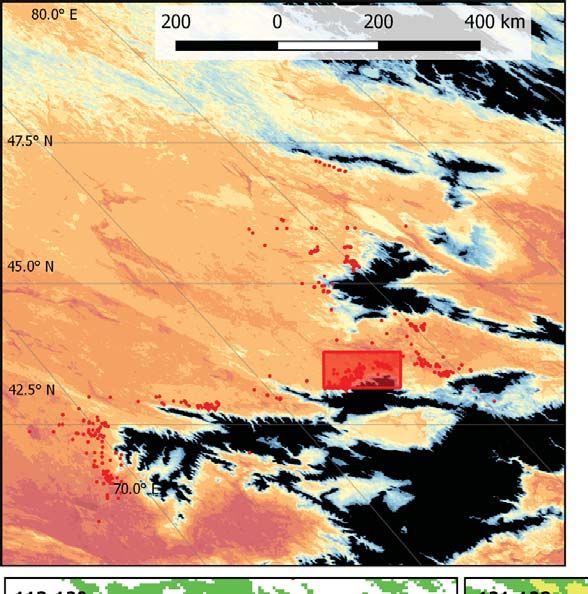
Figure 2. Accumulated degree days above 10°C for specific days in 2017 in the region of Southeastern Kazakhstan.
the accuracy of the created maps was car- dates of the development stages of the ap-
ried out. The accuracy of the temperature ple trees as well as the codling moth was
recalculation of the LST values into meteo- calculated from temperature data of the
rological temperature values was checked weather stations and LST received from sat-
using data from eight weather stations, oth- ellite sensors.
er than the seven weather stations where The difference in average temperatures,
the original data came from. From LST maps and therefore the ADD, calculated from me-
and maps of conversion of LST data to me- teorological and remote sensing data is
teorological stations data (LSTmeteo), temper- quite significant. However, the correlation
ature values were extracted from the ras- between the temperature values is very
ter cells corresponding to the locations of high (r=0.98-0.99), which makes it possible
weather stations. Temperature values for to convert the LST to the values received
similar 8-day periods, calculated from mete- from weather stations with a high degree of
orological data (Tmeteo) were taken as the ref- accuracy (Figure 4). In Table 2 for each 8-day
erence values. To validate the model, phe- period, temperature values averaged across
nological data which were obtained from the data of the seven weather stations are
apple orchards with pheromone traps were presented in 3 variants: 1) average values for
also used. meteorological data (Tmeteo); 2) average val-
ues for LST data (raw LST data); 3) average
values for LST converted by using a regres-
Results and Discussion sion model (LSTmeteo).
The following generalized regression
The relation between temperature and the formula was derived: LSTmeteo = 4.6 + 0.056
© Benaki Phytopathological Institute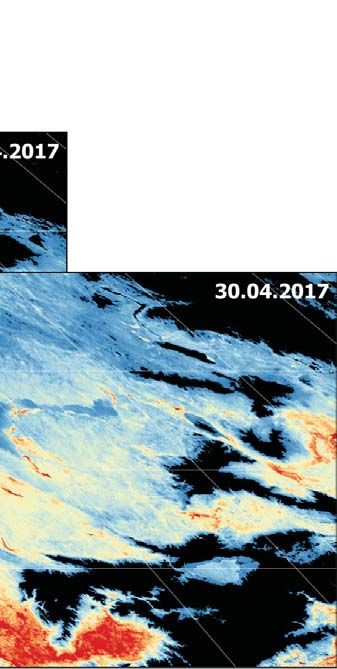
6                                                    Afonin et al.

Figure 3. Dates of transition over 140 ADD (above 10oC) (Julian dates in 2017) in Southeastern Kazakhstan and the variant
of presentation of codling moth first fligh 8-day prediction. Red dots show the apple orchards location.

* LSTday + 0.982 * LSTnight. Figure 4a shows a                the regression formula (LSTmeteo). The aver-
comparison between the mean 8-day tem-                        age 8-day temperatures were recalculated
peratures on the meteorological data (Tme-                    into ADD with a threshold value of 10°C (Fig-
teo), raw LST data and values calculated by                   ure 4b).

                                                                               © Benaki Phytopathological Institute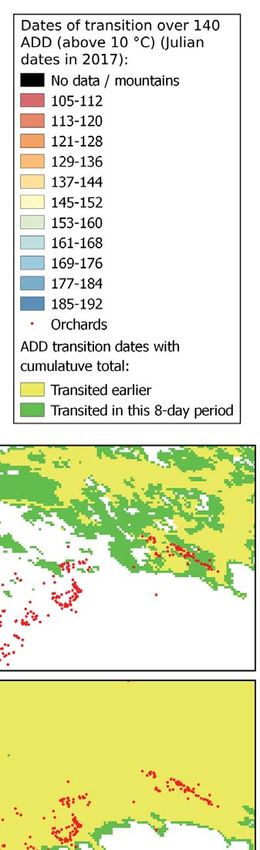
Prototype Spatio-temporal Predictive System for codling moth                                  7

Figure 4. The dynamics of the average temperatures (a) and the ADD (b) calculated from the meteorological data (Tmeteo),
raw LST data and by using regressiom formula (LSTmeteo) for meteorological station Zharkent (368590).

Table 2. Temperature data, based on meteorological, LST and regression data averaged
across the data of seven model weather stations.
                  Average temperatures calcu- Average temperatures calcu- Average temperatures cal-
Date
                   lated according to weather lated according to MODIS LST culated by using regression
(Julian)
                     stations data (Tmeteo), (°C) data (raw LST data), (°C)   models (LSTmeteo), (°C)
2017_073-80                    -2.25                              -0.85                              -1.98
2017_081-88                     5.57                               6.49                              5.49
2017_089-96                     4.37                               6.94                              4.84
2017_097-104                    9.83                              11.82                              8.79
2017_105-112                   14.45                              16.16                             13.55
2017_113-120                   14.30                              19.77                             16.00
2017_121-128                   14.96                              18.39                             14.59
2017_129-136                   21.80                              24.73                             21.84
2017_137-144                   18.70                              22.56                             19.05
2017_145-152                   20.43                              23.94                             19.93
2017_153-160                   20.74                              25.27                             20.80
2017_161-168                   24.12                              27.58                             23.99
2017_169-176                   26.37                              29.15                             26.12
2017_177-184                   23.94                              27.71                             24.81
2017_185-192                   27.88                              30.91                             27.48
RMSE                                                              3.24*                             0.66**
 * Root Mean Square Error (RMSE) of average temperatures calculated according to weather stations data and
   average temperatures calculated according to MODIS LST data comparison.
** Root Mean Square Error (RMSE) of average temperatures calculated according to weather stations data and
   average temperatures calculated by using regression models comparison.

© Benaki Phytopathological Institute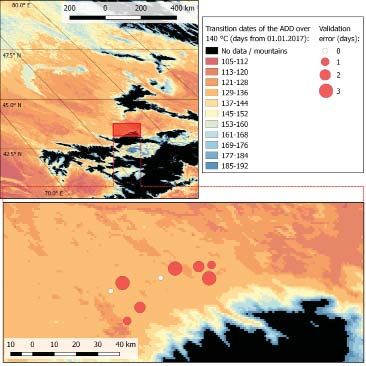
8                                              Afonin et al.

     For each weather station, the differences           LST data is 3.5°C.
between Tmeteo and raw LST data; Tmeteo and                  Conversion of temperature maps based
LSTmeteo were calculated for the fifteen 8-day           on remote sensing data into maps of weath-
periods. For each variant out of 15 differenc-           er stations temperature values allowed car-
es, RSME (Root Mean Square Error) was cal-               tographic forecasts with previously devel-
culated. For example, for Kokpekty weath-                oped methods using weather station data.
er station RMSE by raw LST was 4.69, and                     The map of the Julian dates of transition
by LSTmeteo was 1.20. The average values of              through the threshold of 140 ADD, corre-
RMSE were: 3.46 for the Tmeteo approxima-                sponding to the expected dates at the be-
tion variant by raw LST data, 1.62 by LSTme-             ginning of the spring flight of the codling
teo for model stations, and 1.65 for validating          moth in July 2017 is presented in Figure 3.
stations (Table 3).                                      Phenological maps, in contrast to phero-
     Thus, the use of the regression model in            mone traps, allow us to forecast the dates
the weather temperature maps made it pos-                of essential pesticide treatment not only for
sible to improve the accuracy of the mete-               separate orchards, but for each site (pixel)
orological temperature approximation sig-                of the region. This is especially relevant for
nificantly in comparasion to raw LST data.               Kazakhstan due to the fact that monitoring
The mean values of Root Mean Square Er-                  traps are installed only in few orchards.
rors (calculated by using regression model                   In the second stage of validation, actu-
to validate stations) are quite equal, allow-            al dates of the first spring flight of codling
ing the assumption that the recalculation                moth, obtained from pheromone traps in
error of conversion LST to Tmeteo is approxi-            9 orchards in the Almaty region were com-
mately 1.7°C, while the error of using raw               pared with dates of transition over 140 ADD

Table 3. Accuracy of meteorological temperatures approximation by model and validating
stations data.
Name of the station                    Accuracy of meteorological temperatures approximation (RMSE)
(WMO ID)                                  By LSTmeteo*          By LSTmeteo **       By raw LST data ***
Bektauata (356990)                            1.10                     –                    2.24
Zhangiztobe (363970)                          1.63                     –                    5.50
Bolshe Narymskoe (364280)                       –                    1.51                   2.84
Kokpekty (365350)                               –                    1.20                   4.69
Urdzhar (366390)                              1.10                     –                    3.63
Bakanas (368210)                                –                    1.96                   2.94
Zharkent (368590)                             1.64                     –                    4.22
Otar (368640)                                 1.33                     –                    4.11
Almaty (368700)                                 –                    2.52                   3.89
Tole bi (382220)                                –                    0.89                   3.18
Shymkent (383280)                               –                    1.99                   2.19
Aul Turara Ryskulov (383340)                    –                    1.43                   3.10
Taraz (383410)                                1.78                     –                    3.69
Koolan (383430)                                 –                    1.68                   3.42
Cardara (384390)                              2.76                     –                    2.32
Mean Values                                   1.62                   1.65                   3.46
  * Root Mean Square Error of average temperatures calculated according to weather stations data and average
    temperatures calculated by using regression model comparison (for model stations).
 ** Root Mean Square Error of average temperatures calculated according to weather stations data and average
    temperatures calculated by using regression model comparison (for validating stations).
*** Root Mean Square Error of average temperatures calculated according to weather stations data and average
    temperatures calculated according to MODIS LST data comparison.

                                                                      © Benaki Phytopathological Institute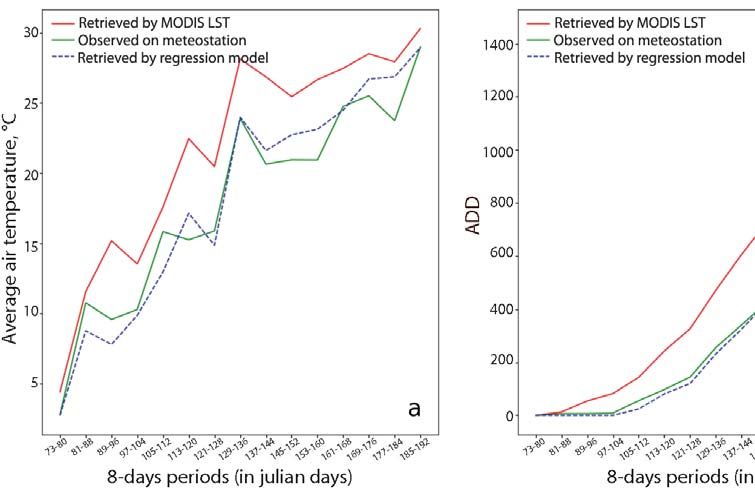
Prototype Spatio-temporal Predictive System for codling moth                          9

(above 10°C) at the locations of the orchards                    dates calculated by LSTmeteo (Table 4). Table 4
on the produced maps. Since our pheno-                           is devoted to the results of the dates of tran-
logical maps were 8-day, daily details were                      sition over 140 ADD validation for meteoro-
achieved by interpolation of the values                          logical stations. It was calculated similarly to
of the forecasted transition dates into the                      validation of actual dates of the first spring
8-day interval. The differences between the                      flight of codling moth, obtained from pher-
actual and calculated dates were for differ-                     omone traps in 9 orchards in the Almaty re-
ent orchards from 0 to 3 days, while the av-                     gion. The difference is that in this case data
erage difference for 9 orchards was 1.7 days                     of meteorological stations was used to cal-
(Figure 5).                                                      culate the 140 ADD transition dates and was
    The validation of the calculated dates of                    taken as the reference data. The differences
transition over 140 ADD (above 10°C) was                         between meteorological and LST transition
also carried out by comparing the dates cal-                     dates were in average 3.98 days for model
culated for 15 studied stations by Tmeteo, the                   stations (seven stations used for building
dates calculated by raw LST data and the                         the regression formula) and 4.11 days – for

Figure 5. Validation of the expected dates of codling moth first flight by actual data.

© Benaki Phytopathological Institute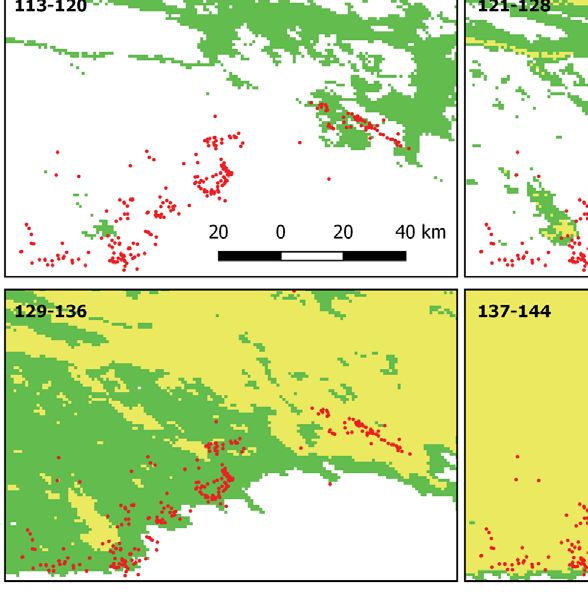
10                                           Afonin et al.

Table 4. Validation of the expected dates of codling moth flight beginning by meteorolo-
gical data.

                                Accuracy of approximation of dates of transition over 140 ADD (above
Name of the station               10°C) calculated according to weather stations data (error in days)
(WMO ID)                                                  By LSTmeteo data           By LSTmeteo data
                                By raw LST data
                                                       (for model stations)     (for validating stations)
Bektauata (356990)                     3                        2                           –
Zhangiztobe (363970)                  18                        4                           –
Bolshe Narymskoe (364280)             16                        –                          -2
Kokpekty (365350)                     17                        –                          -2
Urdzhar (366390)                      12                       -3                           –
Bakanas (368210)                      10                        –                          -3
Zharkent (368590)                     16                       -2                           –
Otar (368640)                         13                        2                           –
Almaty (368700)                       18                        –                          10
Tole bi (382220)                      14                        –                          2
Shymkent (383280)                     10                        –                          -3
Aul Turara Ryskulov (383340)           8                        –                           1
Taraz (383410)                        16                        7                           –
Koolan (383430)                       17                        –                           2
Cardara (384390)                       9                        5                           –
RMSE                                 13.80                    3.98                        4.11
RMSE: Root Mean Square Error.

validating stations (eight stations used for         be updated on a daily basis. The information
validating the model).                               to the orchards located in these zones will
    It should be noted that the accumulation         be transmitted by the sms-communication
of degree days in the orchards lags behind           system and through the web GIS interface
the accumulation on the arid non-irrigated           1-2 days before the expected starting date
territory, which occupies a significant part of      of the codling moth’s flight. Web GIS inter-
the area of 1 pixel (spatial resolution 1x1 km)      face has already been worked out by Afo-
in the southeast of Kazakhstan. Therefore, in        nin et al. (2016) - http://app.o-gis.org/o-gis/
the future, to enable the use of the develo-         web/app.php/editor/composition/88.
pled model in the Kazakhstan National sys-
tem for pest development forecasting in
real time, layers of average air temperatures        Conclusions
of 1km spatial resolution will be created at
one day interval. The temperature data re-           The study has shown that remote sensing
ceived from the temperature sensors of the           data can be used as a prospective tool in
Modis/Terra will be recalculated into the            plant protection by producing phenologi-
weather stations’ data using the current es-         cal maps for forecasting pest development
tablished calibration regression models. The         stages. In particular, monitoring of ADD val-
study territory will be devided into meteo-          ues calculated by Modis data makes possible
rological zones, where each pixel will refer         to predict with sufficient accuracy the tim-
to the area of one weather station and each          ing of the codling moth vulnerable develop-
zone will have its own conversion formula.           mental stages and to define optimal dates
The layers will be summed up and map of              for farmers to implement pesticide treat-
the ADD with a threshold value of + 10°C will        ment in apple orchards. Further precision

                                                                     © Benaki Phytopathological Institute
Prototype Spatio-temporal Predictive System for codling moth 11
of forecasts may relate to the refinement peratures and precipitation at meteorological
of agro-ecological maps e.g. medium res- stations of Russia and neighboring countries.
http://meteo.ru/data/162-temperature-precip-
olution satellite images (e.g. Landsat TIRS), itation
forecasts can result in a spatial resolution of Drozda, V.F., Sagitov, A.O. 2017. Evaluation of tech-
30 m; a meteorological zoning technology nologies for protection of apple trees from cod-
and a technology for refined interpolation ling moth. Plant Protection and Quarantine, 5: 17-
of under-cloudy data using the original cli- 27.
che method and separate regression formu- Eastman, J.R. 2012. IDRISI Selva Tutorial, Manual Ver-
sion 17.0, Clark University. http://uhulag.men-
las for each zone would also significantly im- delu.cz/files/pagesdata/eng/gis/idrisi_selva_
prove the methodological precision of maps tutorial.pdf
(Afonin et al., unpublished). Fu, G., Shen, Z., Zhang, X., Shi, P., Zhang, Y. and Wu,
J. 2011. Estimating air temperature of an alpine
meadow on the Northern Tibetan Plateau using
MODIS land surface temperature. Acta Ecologica
The reported study was funded by RFBR ac- Sinica, 31(1): 8-13.
cording to the research project №19-05-00610 Hill, T. and Lewicki, P. 2007. STATISTICS: Methods and
and Ministry of Education and Science of the Applications. StatSoft,Tusla, OK, 719 p.
Republic of Kazakhstan. Jones, V.P., Hilton, R., Brunner, J.F., Bentley, W.J., Al-
ston, D.G., Barrett, B. et al. 2013. Predicting the
emergence of the codling moth, Cydia pomo-
nella (Lepidoptera: Tortricidae), on a degree-
Literature Cited day scale in North America. Pest Management
Science, 69: 1393-1398.
Afonin, A.N., Kazakov, E.E, Milyutina, E.A. unpub-
Knight, A.L. 2007. Adjusting the phenology mod-
lished.
el of codling moth (Lepidoptera: Tortricidae) in
Afonin, A.N., Sevryukov, S.Yu., Soloviev, P.A., Luneva, Washington state apple orchards. Environmen-
N.N. 2016. Web-GIS for the solution of ecolog- tal Entomology, 36: 1485-1493.
ical-geographical analysis and modeling tasks:
Lensky, I.M. and Dayan, U. 2011. Detection of fines-
new opportunities. Vestnik of Saint Petersburg
cale climatic features from satellites and impli-
University, Geography and geology, 7(4): 97-111.
cations for agricultural planning. Bull. Am. Mete-
Benali, A., Carvalho, A. C., Nunes, J. P., Carvalhais, N. orol. Soc., 92: 1131-1136.
and Santos, A. 2012. Estimating air surface tem-
Marques da Silva, J.R., Damásio, C.V., Sousa, A.M.O.,
perature in Portugal using MODIS LST data. Re-
Bugalho, L., Pessanha, L., Quaresma P. 2015. Ag-
mote Sensing of Environment, 124: 108-121.
riculture pest and disease risk maps considering
Blum M., Lensky, I.M., Nestel, D. 2013. Estimation of MSG satellite data and land surface tempera-
olive grove canopy temperature from MODIS ture. International Journal of Applied Earth Ob-
thermal imagery is more accurate than interpo- servation and Geoinformation, 38: 40 -50.
lation from meteorological stations. Agricultural
Meyer, H., Katurji, M., Appelhans, T., Müller, M.U.,
and Forest Meteorology, 176: 90-93.
Nauss, T., Roudier, P. and Zawar-Reza, P. 2016.
Blum, M., Lensky, I.M., Rempoulakis, P., Nestel, D. Mapping daily air temperature for Antarctica
2015. Modeling insect population fluctuations based on MODIS LST. Remote Sensing, 8(9), 732.
with satellite land surface temperature. Ecologi-
MODIS/Terra Land Surface Temperature/Emissiv-
cal Modelling, 311: 39–47.
ity 8-Day L3 Global 1km SIN Grid V006. 2017.
Blum, M., Nestel, D., Cohen, Y., Goldshtein, E., Hel- https://lpdaac.usgs.gov/dataset_discovery
man, D., Lensky, I.M. 2018. Predicting Heliothis
Pralya, I.I. 2013. Protection of the apple orchard.
(Helicoverpa armigera) pest population dynam-
AMA-Press, Moscow, 91 p.
ics with an age-structured insect population
model driven by satellite data. Ecological Mod- Riedl, H., Croft, B.A. and Howitt., A.J. 1976. Forecast-
elling, 369: 1–12. ing codling moth phenology based on phero-
mone trap catches and physiological-time mod-
Boldyrev, M.I. 1981. Short-term forecasting of the
els. Canadian Entomologist, 108: 449-460.
development of codling moths. Plant protecti-
on, 5: 38-39. Sepulcre-Canto´, G., Zarco-Tejada, P.J., Jime´nez-
Mun oz, J.C., Sobrino, J.A., Soriano, M.A., Fer-
Boldyrev, M.I. 1991. Optimal timing and measures to
eres, E., Vega, V., Pastor, M. 2007. Monitoring
combat the codling moth. Gardening and viticul-
yield and fruit quality parameters in open-can-
ture, 6: 13-15.
opy tree crops under water stress. Implications
Bulygina, O.N., Razuvaev, V.N., Aleksandrova, T.M. for ASTER. Remote Sensing of Environment, 107:
2018. Description of the data of air daily tem- 455–470.
© Benaki Phytopathological Institute12 Afonin et al.
Shen, S. and Leptoukh, G.G. 2011. Estimation of sur- 494.
face air temperature over central and eastern Williamson, S.N., Hik, D.S., Gamon, J.A., Kavanaugh,
Eurasia from MODIS land surface temperature. J.L. and Flowers, G.E. 2014. Estimating temper-
Environmental Research Letters, 6(4) 045206. ature fields from MODIS land surface tempera-
Sona, N.T., Chena, C.F., Chenb, C.R., Changa L.Y., ture and air temperature observations in a sub-
Minh V.Q. 2012. Monitoring agricultural drought arctic alpine environment. Remote Sensing, 6(2):
in the Lower Mekong Basin using MODIS NDVI 946-963.
and land surface temperature data. Interna- Yones, M.S., Arafat, S., Hadid, A.A., Elrahman H.A.
tional Journal of Applied Earth Observation and and Dahi, H.F. 2012. Determination of the best
Geoinformation, 18: 417–427. timing for control application against cotton
The Ministry of Agriculture of the Republic of Ka- leaf worm using remote sensing and geograph-
zakhstan. 2017. http://mgov.kz/en/napravleni- ical information techniques. The Egyptian Jour-
ya-razvitiya/fitosanitarnaya-bezopasnost/ nal of Remote Sensing and Space Sciences, 15:
Vancutsem, C., Ceccato, P., Dinku, T. and Connor, S.J. 151-160.
2010. Evaluation of MODIS land surface temper- Zlatanova, A.A. 1978. Forecast of the emergence
ature data to estimate air temperature in differ- of individual phases in codling moth develop-
ent ecosystems over Africa. Remote Sensing of ment. Proceedings of the Kazakh RIPPQ, 14: 30-
Environment, 114(2): 449-465. 36.
Wan, Z., Hook, S., Hulley, G. 2015. MOD11A2 MODIS/ Zlatanova, A.A., Pastukhova, N.P. 1975. Influence of
Terra Land Surface Temperature/Emissivity the photoperiod and temperature on codling
8-Day L3 Global 1km SIN Grid V006 [Data set]. moth and microdus development during reac-
NASA EOSDIS LP DAAC. doi: 10.5067/MODIS/ tivation. Ekologiya, 5: 82-83.
MOD11A2.006
Welch, S., Croft, B.A. Brunner, J.F. and Michels, M.
1978. PETE: An extension phenology modeling
system for management of multi-species pest
complex. Environmental Entomology, 7: 487- Received: 27 December 2017; Accepted: 20 June 2019
Πρωτότυπο σύστημα χωρο-χρονικής πρόγνωσης της
ανάπτυξης της καρπόκαψας της μηλιάς, Cydia pomonella,
στο Καζακστάν
A. Afonin, B. Kopzhassarov, E. Milyutina, E. Kazakov, A. Sarbassova και A. Seisenova
Περίληψη Η εργασία αφορά στην ανάπτυξη ενός πρωτότυπου συστήματος πρόγνωσης εμφάνισης
των βιολογικών σταδίων εντομολογικών εχθρών στο Καζακστάν με τη χρήση γεωχωρικών δεδομένων
και οργανισμό – μοντέλο την καρπόκαψα της μηλιάς, Cydia pomonella. Η βασική μεθοδολογία περιε-
λάμβανε την επιχειρησιακή ανάκτηση δεδομένων θερμοκρασίας στην επιφάνεια της γης από θερμι-
κούς χάρτες του συστήματος MODIS και δεδομένων από μετεωρολογικούς σταθμούς, τον επανυπο-
λογισμό και την απεικόνισή τους σε χάρτες ημεροβαθμών και τελικά σε χάρτες δυναμικής του πληθυ-
σμού της καρπόκαψας. Η επαλήθευση των προβλεπόμενων ημερομηνιών εμφάνισης των βιολογικών
σταδίων του εντόμου βάσει επιτόπιων δεδομένων από μηλεώνες έδειξε καλή πρόβλεψη. Η ακρίβεια
πρόγνωσης είναι δυνατόν να βελτιωθεί περαιτέρω με τη χρήση ημερήσιων δεδομένων θερμοκρασίας
από δορυφορικούς δέκτες και με τη βαθμονόμησή τους με δεδομένα από ένα δίκτυο μετεωρολογικών
σταθμών εγκατεστημένων στους οπωρώνες.
Hellenic Plant Protection Journal 13: 1-12, 2020
© Benaki Phytopathological InstituteYou can also read