2016 BETTER TOGETHER IN ACHIEVEMENTS - UTZ
←
→
Page content transcription
If your browser does not render page correctly, please read the page content below
BETTER
TOGETHER
 2016
 IN ACHIEVEMENTS
BETTER TOGETHER
Big problems need big solutions. And let’s not kid ourselves; the problems
are big.
Too many of the world’s farmers and workers struggle to earn a living.
Climate change is bad news for all of us, and farmers are already feeling
the effects of higher temperatures and erratic rainfall. Women still face
systematic exclusion and discrimination. These issues also pose a real threat to the supply
of ingredients like cocoa, coffee and tea.
Now is the time to take action for more responsible production, and 2016 showed that
great things become possible when we work together. The stories on these pages show
how certification acts as a catalyst for change in farming communities, throughout supply
chains, and across sectors. It brings people together and lays the foundations for innovation.
We look forward to even bigger and better things in the year to come but first, let’s take a
look back at what we achieved together in 2016.
Han de Groot, Executive Director
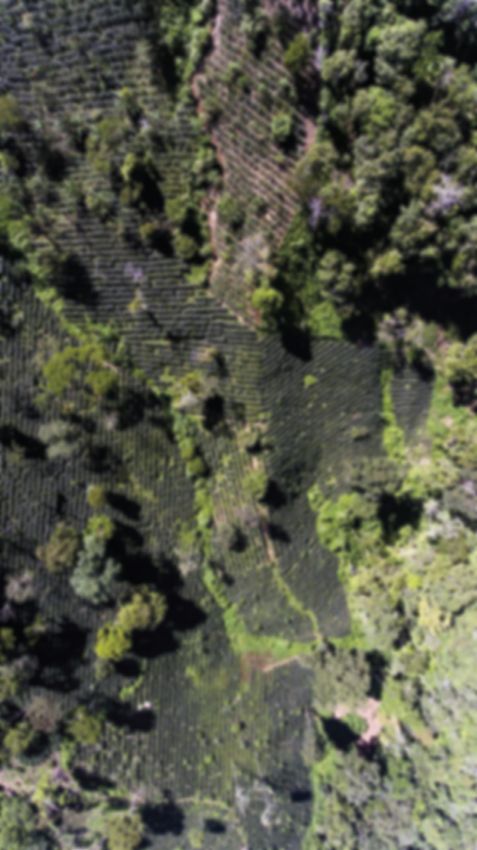
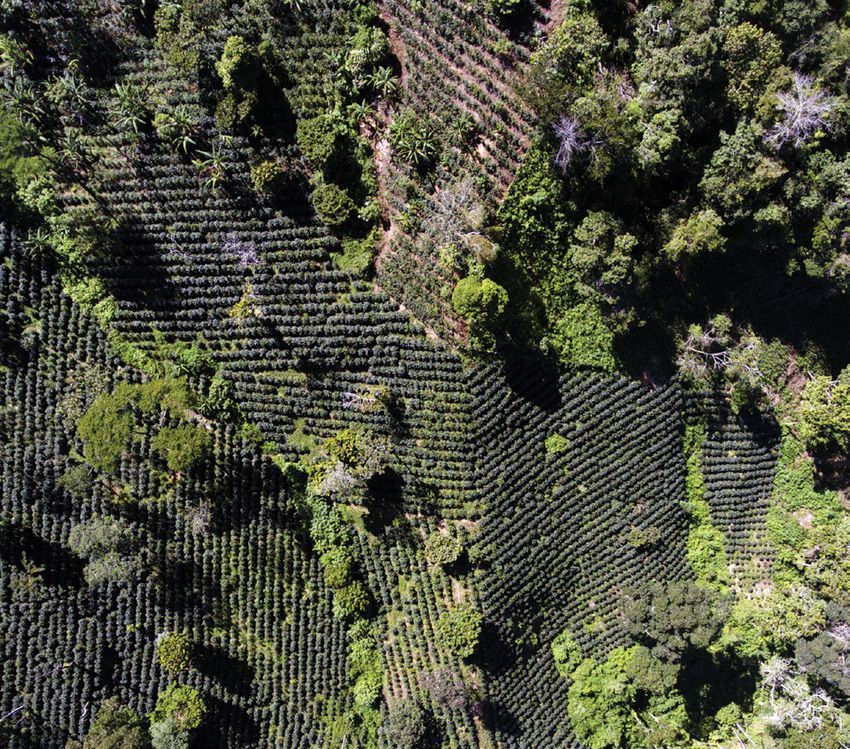
A DIFFERENT PERSPECTIVE: UTZ FROM THE AIR
The photographs in this report show some of the spectacular landscapes that are home
to UTZ certified farms in different areas of the world. But they are more than just beautiful
images.
In 2016, we invested in developing a global
database of expertise on sustainable farming
practices. Farmers, workers and agricultural
experts were filmed demonstrating how to put
the UTZ requirements into practice in different
contexts, and a drone was used to gain unique
insights into the farm and the relationship with
the surrounding environment. These photos and
videos are accessible to all our stakeholders via A clear difference: this photo from Côte D’Ivoire shows an UTZ certified
our online training platform, the UTZ Academy farm on the left side of the road, and a non-certified farm on the right.
Use of shade trees and other good farming practices made the
Online. certified farm more resilient against drought.
All photos by Giuseppe Cipriani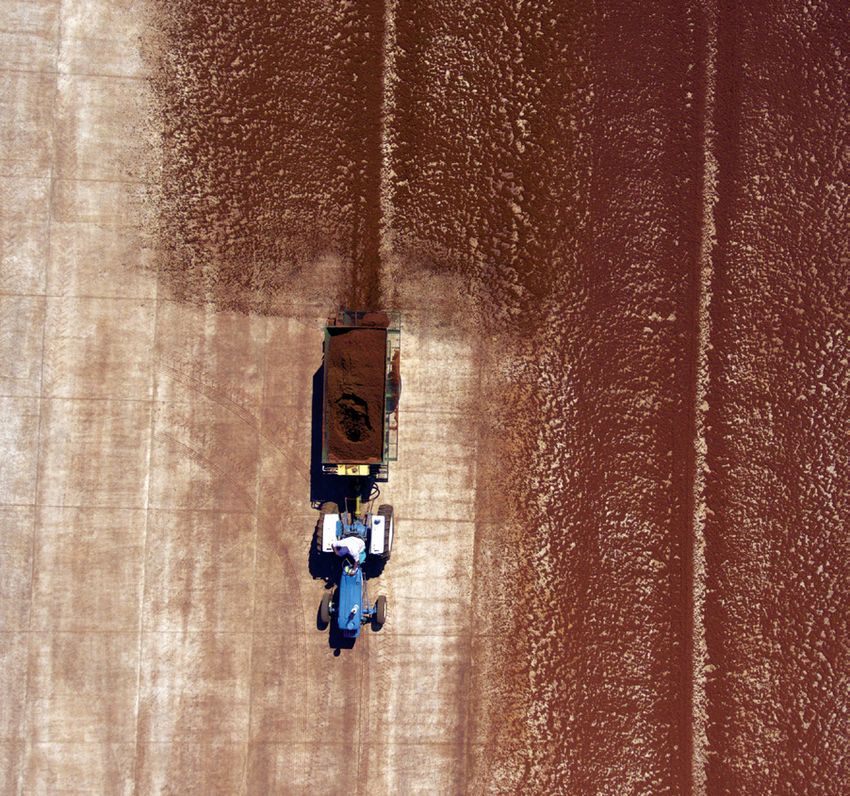
The UTZ name or logo
                                                                              is now on more than
UTZ certified coffee, cocoa                                                    13,000 products in
 and tea is grown on more                                                       130 countries
than 2.7 million hectares
      in 41 countries

 In 2016 our members sourced enough to make
38 billion cups of coffee, 3 billion cups of tea,   We work with more than
        and 15 billion bars of chocolate             850,000 farmers and
             (milk chocolate 100g)                     430,000 workers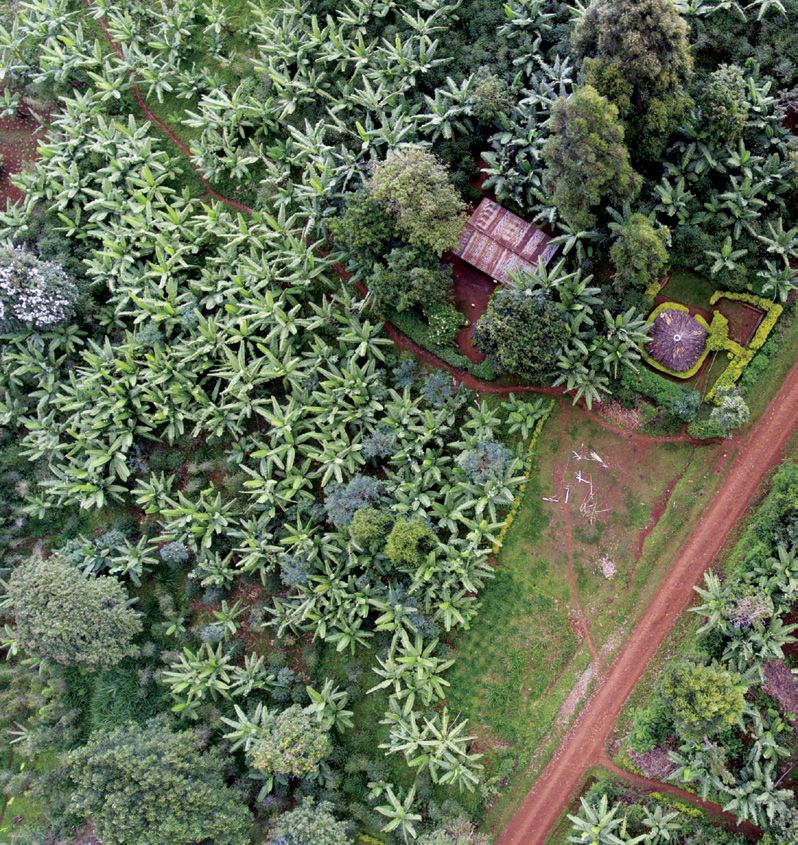
THE IMPACT OF CERTIFICATION
                                                         Being part of the UTZ program brings big benefits to farmers and
                                                         workers. From tackling climate change and empowering female
                                                         farmers, to improving conditions for workers; certification is the catalyst
                                                         for change.

                                                         PERUVIAN FARMERS ADAPT TO CLIMATE CHANGE
                                                         Amaro Chasquero is one of thousands of farmers who
                                                         grow coffee on the vertiginous slopes of the San Ignacio
                                                         region of northern Peru, on a farm spread between 1200
                                                         and 1700 meters above sea level. “I have been growing
                                                         coffee here since 1985,” he says. “This hot weather was
                                                         more usual in the lower areas, and up here at it was
                                                         cooler. But now the weather is changing, and it’s hotter
                                                         here as well.”

                                                         As part of the training required in the UTZ program, the
                                                         cooperative works with farmers like Amaro to help them
                                                         adapt to climate change. One of the best methods is
                                                         planting shade trees, which protect the coffee plants
                                                         from the most extreme heat – as well as encouraging
                                                         biodiversity.                                                      Amaro Chasquero

                                                         When Amaro first started using shade trees his neighbors were skeptical. “At first, they
                                                         told me there was no need for so many shade trees at this altitude. But as the weather
                                                         changed they saw that the shade is vital to protect the coffee plants. This ensures the
                                                         coffee is the best possible quality.”

                                                         SMALLHOLDERS HARNESS THE POWER OF TECHNOLOGY
                                                         Cocoa farming is a way of life in the village of Oupoyo in Cote D’Ivoire, where Jean-
                                                         Marc Gouda is the manager of the NECAAYO cooperative. In 2016, his cooperative
                                                         was one of the first to pilot new technology that digitizes the management of the
                                                         farmer group, as part of an UTZ innovation program that aims to bring the benefits of
                                                         technology to small farmers.

                                                             “Keeping digital records means I have a much better overview
  We work with more than                                         of how we are doing, and which farmers need additional
                                                              support,” says Jean-Marc. “When the auditors came this year,
   850,000 farmers and                                        I felt more confident – I had the entire management system in
                                                              one place, and I could easily show them what they needed.”
     430,000 workers                                     On top of these efficiency benefits, the new technology has the potential to generate
                                                         data from within farmer groups that can benefit farmers, auditors, and others in the
                                                         supply chain. For example, farms within a group can be plotted on maps alongside

 UTZ certified coffee, cocoa
                                                         physical features like fresh water sources, contributing to environmental protection
                                                         strategies.

  and tea is grown on more                               The goal is also to give farmers access to sources of data that could help them improve
                                                         their practices, such as satellite imagery or land classification databases. In 2017, the
than 2.7 million hectares in                             technology will be rolled out to more farms across Africa, Latin America and Asia.

       41 countries

                               A coffee farm in Uganda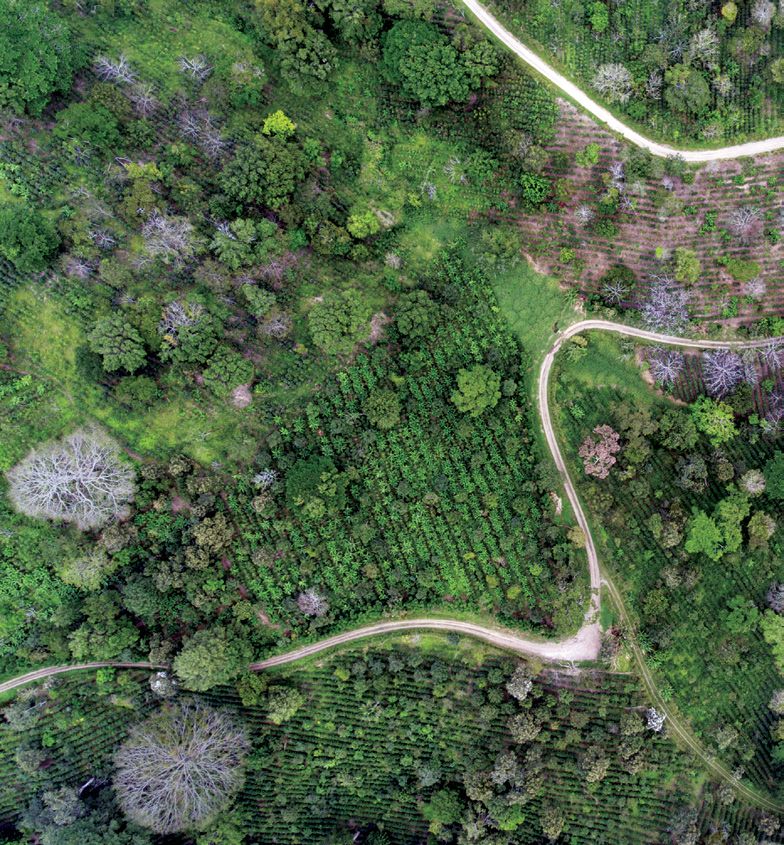
BETTER WORKING CONDITIONS, BETTER RESULTS
Maturata Plantations Ltd is one of the largest tea producing companies in Sri Lanka,
employing more than 4,000 workers across several estates.

     “Back in 2013 our tea estates were underperforming and
   workers were disillusioned,” says Subhash Abeywickrama, the
   company’s General Manager. “Global markets were making
     demands for certification, and so we looked at available
   schemes. We quickly realized the difference it could make to
                 productivity and workers’ lives.”
Big improvements have been made since the company became UTZ certified.
For example, workers used to struggle to carry heavy baskets of tea from the fields;
now there are restrictions on the weight and new weighing stations have reduced
the distance the tea must be carried. Clean water sources have been installed
nearer to the workers’ homes, and new facilities such as toilets and rest areas have
been built for female workers. The company has also started a new large scale
housing project, with 560 new houses being built for workers.

It’s been a significant investment. But, says Subhash, it’s worth it: “It is making a
huge difference to workers’ lives. They know now that we are serious about looking
after their needs. In return they support us, which has been one of the biggest
advantages of certification.”

“We have 19 direct competitors in the Sri Lanka tea market,” says Subhash. “Before
certification we were number 19 on the list in terms of profit and loss. Today? Today
we are number one!”

“WHEN WOMEN WANT TO DO SOMETHING, THEY DO IT ALL THE WAY”
Too often, female farmers are excluded from the training that could help them
improve their business. Léonie Osso Sona is part of an UTZ certified farmer group,
Côte d’Ivoire and the president of the Offa village women’s farmer association,
and she is on a mission to change that in her community.

                               Léonie runs a field school for women, which provides
                               training specifically for women on ways to improve
                               productivity. They have a 25 hectare cocoa
                               nursery where they grow new plants that will later
                               be introduced on the farms, and farmers are also
                               supported in their production of food crops like corn
                               and cassava.

                               Promoting equal opportunities for women is a core
                               part of the UTZ program. Women must have equal
                               opportunities to attend training, and every cocoa
                               farmer group must appoint someone responsible for
                               equal rights and opportunities for women.

                               According to Léonie, investing in women can
                               have a big pay-off. “Côte D’Ivoire is the best
                               cocoa producer,” she says, “and all that is thanks
                               to the women. Because when women want to do
                               something, they do it all the way.”
   Léonie Osso Sona

                                                                                        A coffee plantation in Honduras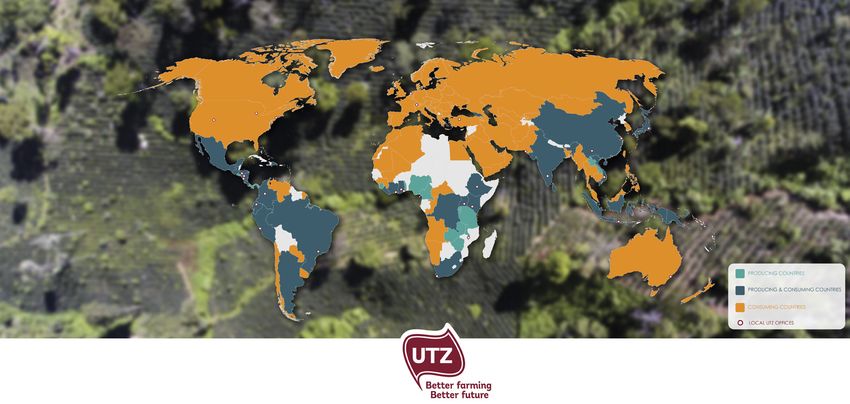
A cocoa farm in Nicaragua
                            We regularly publish studies that assess the impact of our programs, highlighting success and identifying
                            ongoing challenges. Visit www.utz.org/reports for more information.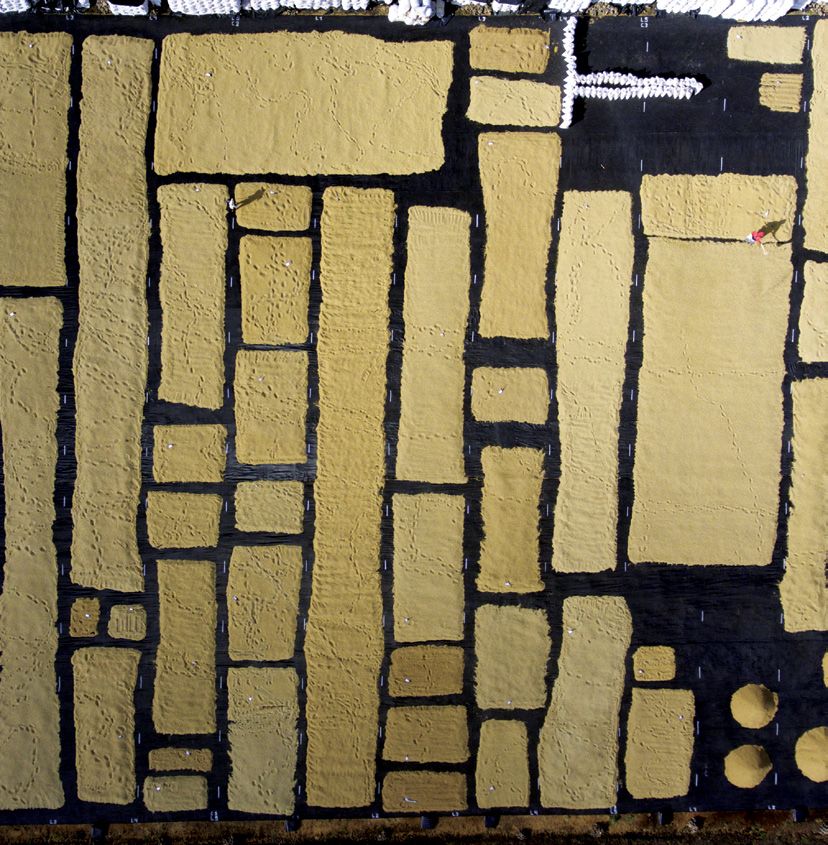
TRANSFORMING THE MARKET
                                            FOR SUSTAINABILITY
                                            To make large-scale change, it all comes down to the commitment of
                                            companies. Forward thinking companies are stimulating innovation
                                            in their supply chains and taking big steps to meet investor and
                                            customer expectations – and to keep up with the latest regulatory
                                            frameworks for sustainability.

                                            100% COMMITMENT
                                            There is no one-size-fits all approach when it comes to sustainability, but there is
                                            one thing that the world’s most sustainable companies have in common: they are
                                            making commitments to 100% sustainable sourcing, and they are using certification
                                            to help them reach that goal.

                                            In the coffee sector, Ahold Delhaize Coffee Company and Arvid Nordquist are
                                            just two of the companies already sourcing 100% certified, as well as Migros in
                                            Switzerland for their private label. Several tea companies have made similar
                                            commitments, including OTG.

                                            Particularly in the cocoa sector, some have already reached their goal to source
                                            100% certified cocoa, either 100% UTZ or a combination with other credible
                                            sustainability standards. This includes companies such as Nestle (for KitKat), Aldi
                                            (Sud and Nord), Lidl, FrieslandCampina and Cloetta at the global level, Woolworths
                                            in South Africa, REWE Group in Germany, and Haigh’s in Australia. Some other big
                                            players who have committed to reach 100% certified cocoa by 2020 include Mars,
                                            Ferrero and Hershey’s.

                                            SPOTLIGHT ON THE UNITED STATES
                                            2016 saw companies worldwide making greater sustainability commitments, but
                                            we saw particularly strong growth in the United States.

                                            The largest buyer of UTZ certified coffee in North America is The J.M. Smucker
                                            Company. Ahold USA is another major buyer of UTZ certified coffee, and in 2016
                                            it met its commitment to 100% sustainable procurement. In the cocoa sector,
                                            Hershey’s and Whitewave have both made 100% commitments. Nestlé USA also
                                            sourced UTZ certified cocoa for several products in 2016.

                                                   “The J.M. Smucker Company is proud of our long-term
                                                 partnership with UTZ to introduce consumers to sustainable
                                                  coffee practices. Through our joint efforts we are helping
                                                   to improve sustainable practices of smallholder coffee
                                                 farmers, enabling better farming and a better future for all
                                                                        stakeholders.”

                                            MEETING CONSUMER EXPECTATIONS
                                            Awareness has been growing among consumers for decades, and this trend
                                            shows no sign of slowing. A major study from performance management company
                                            Nielsen found that 91% of consumers in the world’s biggest economies expect
                                            companies to do more than make a profit, and to operate responsibly to address
                                            social and environmental issues. This has implications for the products consumers
                                            choose to buy, and also those they choose to avoid. In some developed markets,
                                            according to Claudia Suárez-Gapp from Nielson, “sustainability is no longer about
                                            marking yourself out as ahead of the curve, but rather ensuring that you don’t fall
Rooibos spread out to dry in South Africa   behind.”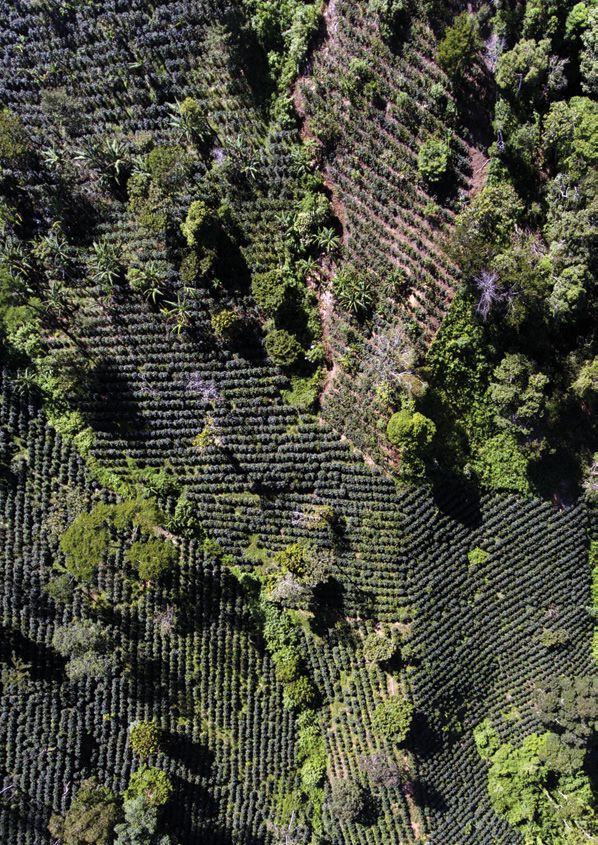
NAVIGATING THE LABEL JUNGLE
In some markets, sustainability labels have proliferated to the point where consumers can
be confused about the different claims on offer. 2016 saw the launch of several initiatives
aimed at explaining and differentiating between labels, showing which sustainability
claims are truly representative of sustainable impact. For example, a Dutch government
funded initiative by the consumer information NGO Millieu Centraal rated UTZ as the best
label for cocoa, coffee and tea, based on criteria around sustainability requirements,
transparency and control processes.
BEYOND THE CONSUMER: FROM EXPECTATION TO OBLIGATION
At the same time, 2016 showed that sustainability is no longer simply a matter of meeting
consumer expectation. Increasingly, it’s also a matter of meeting legal obligations.
2016 was the first full year of the Modern Slavery Act in the United Kingdom, which made
it a requirement for companies to report on their efforts to eradicate slavery in their supply
chains. In the United States a legal loophole was closed, in effect introducing a ban
on the import of goods produced using child labor or slavery. France has adopted a
law requiring multi-nationals to publish due diligence plans on human rights from 2018
onwards, and the Netherlands is preparing a similar law related to child labor. Inspired
by the Sustainable Development Goals and the UN Guiding Principles on Business and
Human Rights, we can expect more countries to follow this route in the years to come.
Certification offers companies a ready-made tool for gaining greater visibility of their
supply chains, contributing to a sustainability strategy that meets these obligations.
NEW MODELS FOR SUSTAINABILITY
Certification has a huge impact. Together with our partners we have already transformed
significant portions of the total market volume of products like cocoa, coffee and tea,
and certification continues to be our core business. At the same time, in today’s complex
market we see that many companies are looking for new ways to bring sustainability to
their supply chains and to differentiate themselves from their competitors.
That’s why in 2016 UTZ began exploring opportunities to work with market leading
companies who want to broaden or deepen their impact. By developing company
programs that complement certification, we can ensure the bar is raised across whole
supply chains.
SUPPORTING AND INSPIRING OUR MEMBERS
More companies than ever are sourcing UTZ certified ingredients. We work closely with
them from the first moment they consider sourcing certified ingredients, supporting them
to integrate sustainability into the core of their business.
Our dedicated global member support team operates in 12 languages. Every day, they
are in touch with our members more than 250 times, and they process more than 30
requests for approval to use the UTZ label on pack.
Sometimes companies struggle to explain their choice for sustainable sourcing, whether
to customers or internally. That’s why we launched the Better Business Hub in January 2016.
In the course of the year, more than 150 articles were published on this online platform.
Stories of UTZ certified farmers and workers offer an insight into the impact of UTZ on the
ground, while interviews and case studies give inspiring examples of how UTZ can add
value to a company’s sustainability strategy or marketing efforts. Other articles answered
some of the most frequently asked questions about UTZ, or highlighted the materials
available to companies for their own communication, such as infographics, pictures and
farmer testimonials. Highlights are shared every three weeks through our newsletter.
Visit the Better Business Hub at www.utz.org/better-business-hub and sign up via utz.org/
newsletter.
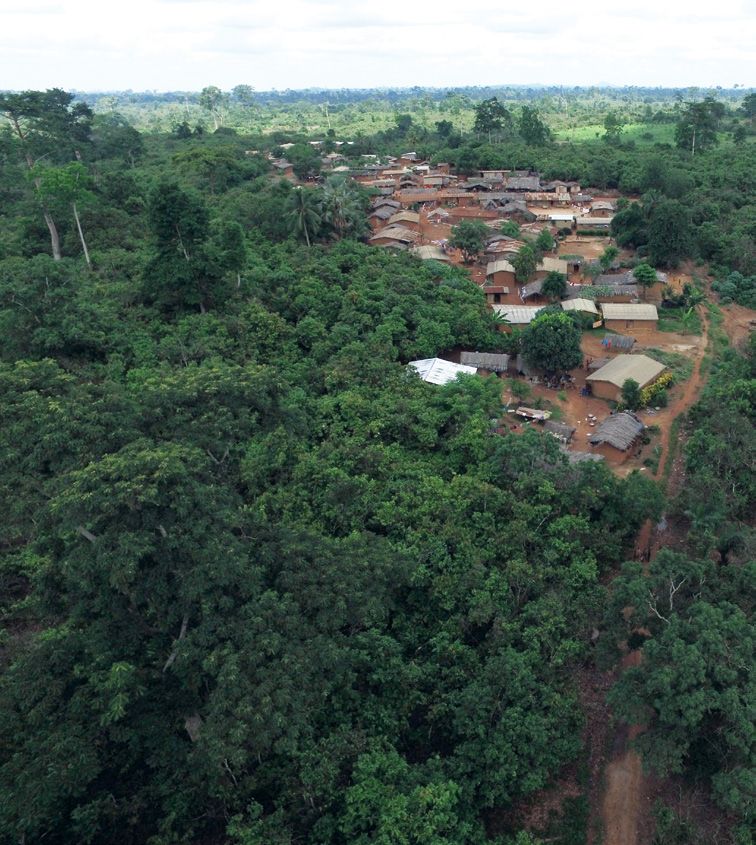
Aerial view of a village near Soubre in Côte d’Ivoire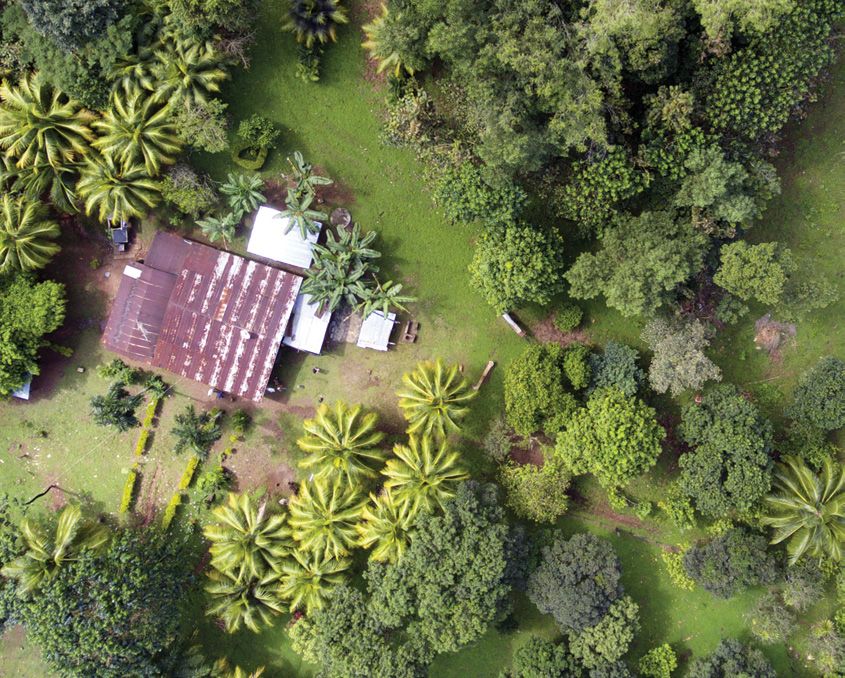
DRIVING CHANGE AT THE SECTOR
LEVEL
Big problems need sector-wide solutions. Issues like living wages, gender equality, and
productivity cannot be solved by any one actor alone. That’s why we’re scaling up our
partnerships within supply chains and across sectors to develop innovative and lasting
collaborations for sector change: developing best practice, building capacity, bringing
people together and influencing policy.

TAKING ON THE BIG CHALLENGES: NEW PRODUCTS
Companies often choose to start their sustainability journeys with iconic ingredients. That’s why we
have seen such big commitments from companies in our cocoa program. But what comes next? Many
companies want to source other ingredients sustainably, too.

That’s how our hazelnut program was born. Hazelnuts are commonly used in confectionary products,
often alongside cocoa. Awareness is growing about the sustainability challenges in hazelnut production,
particularly social issues, and we saw that some of our existing partners wanted to contribute to improving
this sector. We saw an opportunity to meet market demand while contributing to tackling the serious
sustainability challenges.

The program continued to develop in 2016, with new partnerships formed across the sector in Turkey,
and more companies committing to the program.

In 2016 we also began developing a program for sustainable vanilla, working with the Union for Ethical
Biotrade (UEBT). We will continue developing the program in 2017, with the aim of scaling up sustainability
and contributing to market transformation in the vanilla sector.

ACCELERATING CHANGE IN THE COFFEE SECTOR
Making a sector truly sustainable takes commitment from everyone involved. For coffee, that means
giving a voice to farmers, traders, roasters, standards organizations, civil society, and many others.

The Global Coffee Platform (GCP) was launched in April 2016 to bring these stakeholders together,
align them on key issues, and share knowledge. The platform aims to set a global reference for baseline
sustainability, and provide a framework to collectively measure and improve performance.

We are funding the Global Coffee Platform through our Sector Partnerships program (see page 18),
helping to strengthen and support the development of inclusive national platforms, where representatives
of women, smallholders and young farmers also participate. We are specifically focusing on Uganda
and Indonesia’s fledgling platforms and the scoping of platforms in Nicaragua, Honduras and Kenya.

STEPS TOWARDS SUSTAINABLE RICE
Around 20% of the world’s population depends on rice cultivation for their livelihoods. Improving
agricultural practices across this sector has the potential to improve the lives of more than a billion
people, while improving the rice industry’s climate resilience and reducing its contributions to climate
change.

With the vast majority of rice consumed locally in the developing countries where it is produced, a
different approach is needed from the UTZ certification model that has worked so well for cash crops
like coffee, cocoa and tea.

That’s why we have been an active member of the Sustainable Rice Platform (SRP) since 2014, alongside
governments, the United Nations Environment Program, the International Rice Research Institute, and
other partners. We helped to lead the development of the SRP Standard for Sustainable Rice Cultivation,
which was piloted in several field trials in 2016 together with Mars Foods, GIZ and OLAM.

“We are already seeing positive results,” says Geert Eenhoorn, UTZ’s Project Manager for rice. “By
applying the 46 best practice requirements, farmers and traders are reporting an improved return with
lower costs and reduced pesticide residues.”                                                                  Coffee spread out to dry in Nicaragua
DATA-DRIVEN CHANGE IN THE COCOA SECTOR
                             The world’s largest companies have a vital role to play in driving sector change.
                             In the cocoa sector, big players such as Nestlé, Barry Callebaut, Mars, Olam and
                             Hershey’s have come together with origin governments and other stakeholders to
                             form an industry-wide strategy called Cocoa Action.

                             To inform and promote sustainability at the farm level, Cocoa Action members are
                             gathering data against a set of Key Performance Indicators on productivity and
                             community development. In 2016, UTZ worked with Nestlé to gather and analyze
                             this data, by combining a survey with UTZ audits and arranging additional data
                             collection at the community or cooperative level. The analysis of this data will
                             give greater insights into how farmers are putting sustainability requirements into
                             practice, which will allow UTZ and Nestle to improve their programs.

                             MAKING SUSTAINABLE PALM OIL THE NORM
                             Since 2007, UTZ has been working in partnership with the Roundtable on Sustainable
                             Palm Oil (RSPO), the global initiative to promote sustainable oil palm production.

                             RSPO brings together a diverse range of stakeholders in the palm oil industry.
                             Producers, processors, traders, consumer goods manufacturers, retailers, banks/
                             investors, and environmental and social NGOs all work together through to develop
                             and implement global standards for sustainable palm oil.

                             One aspect of our partnership is focused on traceability: managing and tracing
                             volumes of certified sustainable palm oil. Certified members of RSPO register their
                             sales and processing activities in the online traceability system managed by UTZ,
                             from the mill through to the refineries. In 2016 more than 3.5 million tons of certified
                             palm oil was traded through the system – up 33% on 2015.

                             On 1st of January 2017 RSPO and UTZ launched a brand new and improved
                             traceability platform called RSPO PalmTrace, which includes an online marketplace
                             for RSPO Credits. This new platform brings together the management of all of RSPO’s
                             supply chain models and certified volume in one place.

                             In 2017 our partnership will continue to develop, with more of the RSPO’s work
                             integrated into the new PalmTrace system. We will focus on improving usability of
                             the system and further supporting the collection of impact data for the RSPO.

A coffee farm in Nicaragua
PARTNERSHIPS FOR CHANGE
In 2016 we launched our Sector Partnerships Program, in partnership with the Ministry of Foreign Affairs in
the Netherlands. The program is part of our work in producing countries, within supply chains, and across
sectors, with a focus on six sustainability themes in nine countries. All of the projects on this page are
funded by the program.
A STRONG COALITION FOR A LIVING WAGE
The concept of a living wage sounds simple; it should be enough to cover the essential needs of the worker and their
family, including a little extra for unexpected events. In practice, legal minimum wages (if they exist) are often a long
way from a living wage, and until recently there has been no consensus on what a living wage is and how to calculate it
in different countries and communities.
Promoting better working conditions is a core part of the UTZ program, and in 2016 we took big steps alongside our
partners in the Global Living Wage Coalition.
The Coalition brings together UTZ, Fairtrade International, Forest Stewardship Council (FSC), Goodweave, Sustainable
Agriculture Network/Rainforest Alliance, Social Accountability International (SAI), and the ISEAL alliance, the membership
association for sustainability standards. Together, we have agreed on a shared approach for measuring the living wage,
and we are building a global database of benchmarks for actual living wages in different countries and sectors. We are
committed to use a wide range of strategies, appropriate to each of our respective standards systems, to work towards
the long term goal of improving wages.
“The benchmarks give workers and their representatives the tools they need to negotiate for better wages,” says Noura
Hanna, UTZ’s living wage expert. “On top of that, they can give companies a better understanding of the living wage
in their own supply chains, so they can take action accordingly, and governments can be challenged to develop legal
minimum wages based on the real cost of living.” In the UTZ program, the benchmarks are used to measure the progress
made by individual farms towards paying their workers a living wage.
The potential reach is huge: through the six standards in the Coalition, the living wage concept will eventually benefit
millions of workers in more than 50 countries. Benchmarks relevant to coffee, cocoa or tea have been published for
Malawi, Dominican Republic, South Africa, Kenya and Brazil.
IMPROVING SOIL FERTILITY IN UGANDA AND HONDURAS
Fertile soil is the basis for a successful and sustainable farm, yet many farmers lack access to fertilizers, or they don’t know
how to use them most effectively. Together with consultancy firm Soil & More International, we are working with coffee
farmers in Uganda and Honduras. Soil will be analyzed and action plans developed to target fertilizer use while protecting
and conserving the soil. Farmers will be trained on how to implement the plans, and the project will be scaled up and
extended to many more farmers through cooperation with partners, such as the national coffee farmers union NUCAFE in
Uganda.
EMPOWERING WOMEN IN NICARAGUA
Female farmers face unique challenges thanks to systemic gender inequality. In practice it means that women are less
likely to own land, have less access to knowledge and resources that would improve their business, often are not members
of cooperatives and also therefore are often excluded from decision making processes.
In Nicaragua, we are working with the Coffee Quality Institute and the national branch of Women in Coffee to explore new
ways of working towards gender equality for female farmers within families and cooperatives. Workshops will bring men
and women together to explore and address gender inequalities at the household level. At the cooperative level, new
initiatives will ensure that women can actively participate in leadership and decision making. This will give female farmers
a stronger voice, for example in national platforms where stakeholders come together to discuss sustainability issues.
KEY SUSTAINABILITY THEMES:
PREVENTING CHILD LABOR IN GHANA CHILD LABOR
Any successful approach to child labor must be about much more than simply removing children from their situation, or LIVING WAGE
decertifying farms where child labor is found. Stop a child working on one farm and he’ll just go to the farm next door, or CLIMATE CHANGE
the factory in the nearest town. PRODUCTIVITY
FARMER GROUP STRENGTHENING
That’s why UTZ requires a combination of prevention, monitoring and remediation. In Ghana, a new project will see UTZ
GENDER
working together with the Ghanaian NGO Child Rights International and farmer group Kookoo Pa, to create and promote
a bottom-up, cost efficient and gender-sensitive approach to put the UTZ requirements into practice. This will include
empowering the farmer group to lobby and advocate for support from government bodies and supply chain actors.
Lessons learned will be fed back into the UTZ program and other initiatives.UTZ 2016 GOVERNANCE & FINANCIAL INFORMATION
SUPERVISORY BOARD
Paul Andela Nalin Miglani
SB member since 08/12/2011. Union Representative. Former SB member from 10/12/2010 until 9/12/2016. Supply Chain
International Secretary FNV Bondgenoten (largest Dutch trade Representative. Executive Vice President and Chief Human
union), former President of ECF-IUF (now EFFAT), former Resources Officer of Exl Service Holdings Inc. Former Chief HR
President IUF. and Corporate Development Officer at Nutreco; and former
Chief HR and Communication Officer at Tata Beverage Group.
Sidiki Cissé
SB member since 4/12/2014. Producer Representative. General Stefanie Miltenburg
Manager at ANADER, the National Agency for Rural SB member since 28/03/2011. Supply Chain Representative.
Development Support in Côte d’Ivoire. Manager Sustainability & Global Partnerships at Royal Flora
Holland. Formerly Director of International Corporate Social
Jim Fisher Responsibility at Jacobs Douwe Egberts and Director of DE
SB member from 22/06/2010 until 21/06/2016. Supply Chain Foundation.
Representative. Managing Principal of Triumph Revenue
Advisors, a marketing and consulting firm focused on building Paula Nimpuno
revenues and a special expertise in retail coffee marketing SB member since 04/04/2013. Civil Society Representative.
including development of a premium coffee house concept Development planning consultant working on issues of rural
for Melitta, USA. enterprise, social justice and policy development. Formerly
Program Officer for Economic Opportunities and Assets at the
Nina Haase Ford Foundation Southern Africa.
SB member since 20/10/2016. Civil Society Representative.
Head, Advocacy and Policy Market Transformation Initiative at Vanusia Nogueira
WWF. SB member since 12/09/2014. Producer Representative.
Executive Director of the Brazil Specialty Coffee Association
Richard Holland (BSCA). Vanusia comes from a coffee growing family.
Former SB chair, SB member from 10/10/2007 until 09/10/2016.
Civil Society Representative. Director Market Transformation Juan Esteban Orduz
Initiative at WWF. SB member since 12/09/2014. Producer Representative.
President of Colombian Coffee Federation, Inc., the North
Ton van der Laan America subsidiary of the National Federation of Coffee
SB member since 04/12/2012, SB chair since 04/04/2013. Supply Growers of Colombia (FNC) which represents more than
Chain Representative. Former CEO of Nidera, a commodity 563,000 coffee-growing families.
service and solutions provider for the global agricultural
markets and also worked for Cargill, Provimi, Unilever and Cees van Rijn
Philips. SB member since 09/12/2013. Supply Chain Representative.
Worked for more than 35 years in the agribusiness and food
Jos de Loor industry. He is former CFO at Nutreco and worked at Sara Lee,
GOVERNANCE SB member since 20/10/2016. Supply Chain Representative. McCain Foods and Nutricia.
UTZ has an executive team that is responsible for day-to-day affairs, and a multi-stakeholder governance structure. Former business leader for cocoa and chocolate for Cargill
EMEA.
Han de Groot - Executive Director
Daan de Vries - Innovation and Technology Director STANDARDS COMMITTEE
Britta Wyss Bisang - Program Director Hugo Byrnes Ximena Rueda Fajardo
Industry Representative. VP Product Integrity, Ahold Delhaize, Producer Representative. Research Associate, Stanford
Justin Leavenworth – Global Markets Director The Netherlands. University, USA (previous: Strategic Marketing Director,
Federación Nacional de Cafeteros de Colombia).
SUPERVISORY BOARD Niwton Castro Moraes
UTZ is governed by a multi-stakeholder Supervisory Board. Members include representatives from producer organizations, the Producer Representative. Technical Advisor for Coffee of Leonardo Sánchez Hernández
Department of Agriculture of Minas Gerais State, Brazil. NGO Representative/Individual Expert. Environment and
supply chain (including brands, processors, trade, retailers), civil society/non-governmental organizations and trade unions. The
Certification Expert, Aceres Consultants, Costa Rica.
Supervisory Board meets at least three times per year and oversees the Executive Team. In 2016, the Supervisory Board met four Jean-Yves Couloud
times and in 2016, with a particular focus on the organizational development of UTZ as a result of the new Strategy 2016 – 2019. Producer Representative. Program Coordinator, World Cocoa Winaryo Suyono
Foundation, Côte d’Ivoire. Certification Body Representative. Control Union Certifications,
STANDARDS COMMITTEE Indonesia.
Stephanie Daniels
The multi-stakeholder Standards Committee includes representatives from producer organizations and supply chain actors, NGOs NGO Representative/Individual Expert. Program Manager, Kraig Kraft
and technical experts on specific sustainability issues (e.g. employees’ rights, good agricultural practices, and biodiversity), Agriculture & Development, Sustainable Food Lab, USA. NGO Representative/Individual Expert. Regional Technical
experts in the field of certification and sustainability, and the UTZ Standards Director (non-voting member). The Committee’s task is Advisor for Coffee and Cocoa at Catholic Relief Services,
to adopt new Codes of Conduct as well as revise existing Codes. In 2016, the Standards Committee met twice. Anneke Fermont Nicaragua.
Industry Representative. Regional Sustainability Manager,
Kyagalanyi Coffee Ltd. (Volcafe), Uganda. Jenny Walther Thoss
PRODUCT ADVISORY COMMITTEES NGO representative/Individual Expert. World Wildlife Fund,
Product Advisory Committees (PACs) support and advise both the Supervisory Board and UTZ’s staff on the development, Jürg von Niederhaeusern Germany.
implementation and revision of product specific programs (coffee, tea and cocoa). Members of the PACs possess knowledge of Industry Representative. Head of Social Compliance &
production, trade, manufacturing or retail. Standards, Migros, Switzerland. Ute Eisenlohr
Certification Body Representative. IMO, Switzerland.
Michele Pisetta
Industry Representative. Sustainable Project Developer. Ferrero Marcela Uruena
Trading Lux., Luxembourg. Coffee production expert, Colombia
For all UTZ staff please see: https://www.utz.org/who-we-are/who-is-who/ Britta Wyss Bisang
Non-Voting Member. Program Director, UTZ.
UTZ
UTZ 2016 GOVERNANCE & FINANCIAL INFORMATIONFINANCIAL STATEMENTS
COMMENTS ON THE 2016 FINANCIAL
UTZ
STATEMENTS
The year 2016 ended with a positive result of € 4.194K UTZ will use its knowledge and experience to roll out new
compared to a positive result of €2.622K for 2015. This result is programs and thereby increase its contribution to agricultural
transferred into the general and continuity reserves. Income sustainability. The objective is to be able to finance all current
increased by 28% to € 13.942K due to increased income from operations through program fee income. New programs in
fees for coffee, cocoa and palm oil. Operating expenses their initial phase will mainly be financed through
increased by 24%. contributions and sponsoring.
Due to the fact that a non-profit organization as UTZ is more UTZ acknowledges financial support from various donors.
vulnerable to volatile markets and changes in donor policies, Their financial support has been crucial in strengthening our
a continuity reserve exists to secure continuity of its activities. producer programs and market linkage.
When surplus funds are available, additions to this reserve are
be made to keep up with the growth.
BALANCE REVENUE AND EXPENDITURES MAIN SUBSIDIES
Balance as per December 2016 Statement of revenue and expenditures The main subsidies received and accounted for by UTZ
for the year ending 31-Dec-2016 for the year 2016 can be listed as follows:
(€ x 1,000) 31-Dec-16 31-Dec-15 GENERAL NOTES ON THE ACCOUNTS
(€ x 1,000) 2016 2015 2014 Funder € x 1,000
Intangible fixed assets 981 613
Fees 14,189 11,975 9,158 General
Tangible fixed assets 272 304 Dutch Ministry of Foreign Affairs 3,241
Unless otherwise indicated, assets and liabilities are stated at
Subsidies 3,830 1,148 1,193
Finacial fixed assets 1 1 Postcode Loterij (NPL) 300 nominal value.
Contributions 839 783 637
Total fixed asssets 1,254 918 Hazelnuts (industry support) 73 Accounts receivable
Other 390 36 48
Accounts receivable are stated at nominal value including
Total Income 19,248 13,942 11,036 Cocoa (industry support) 177 an allowance for bad debts. The bad debt allowance is
Accounts receivable 3,655 2,809 calculated as follows:
Other (diverse small donor fundings) 39
Nominal value of invoices outstanding between 30 and
Other receivables and prepaid expenses 654 422
Personnel cost -6,543 -5,994 -5,740 Total Subsidies 3,830 • 60 days x 25%.
Cash at banks 10,074 3,892 Nominal value of invoices outstanding between 60 and
Brand & advertising -98 -105 -96 • 90 days x 50%.
Total current assets 14,383 7,123 Nominal value of invoices outstanding longer than 90 days
Events & trainings -708 -607 -687
• x 100%.
Materials & translation -147 -163 -148 Dutch Ministry of Foreign Affairs € x 1,000 +10% of the sum of the above to cover additional debtor
Total assets 15,637 8,041 • management expenses.
Travel & meals -1,097 -902 -805 Monitoring & Evaluation 1,002
General & office -603 -612 -635 Knowledge management 1,158 Tangible fixed assets
Paid in capital 3 3 Tangible fixed assets are stated at their historical cost less
ICT services -694 -682 -555 Lobby & Advocacy 707
General reserve 2,799 2,604 depreciation. Depreciation is provided in equal annual
Consultancy & research -2,936 -870 -1,154 installments over the estimated useful lives of the assets.
Continuity reserve 6,800 2,800 Capacity building 374
Repres. & projects in origin -1,451 -896 -647
Total capital account 9,602 5,407 Total Subsidies 3,241 Intangible fixed assets
Total Operating expenses -14,277 -10,831 -10,467 Intangible fixed assets are stated at their historical cost less
amortization. Amortization is provided in equal annual
Accounts payable 2,602 1,896 STRATEGIC PARTNERSHIP (SP) installments over the estimated useful lives of the assets.
EBITDA 4,971 3,111 569
Taxes and premiums 189 216 The Dutch Ministry of Foreign Affairs granted a subsidy of € 18 Result of the year
Subsidies received 2,620 132 million for the period 2016 -2020 for the Sector Partnerships (SP) The result represents the difference between income and costs
Depreciation -679 -540 -396 program. The actual subsidy in 2016 is € 3.2 million and consists based on accrual accounting during the year. The results on
Other liabilities 624 390 of what has been spent on the first phase activities and other transactions are recognized in the year they are realized;
EBIT 4,292 2,571 173
6,035 2,634 started activities in the various regions. During the first phase, a losses are taken as soon as they are foreseeable.
Total current liabilities
deeper analysis has been carried out by the sector(s) and Income
Income represents funds received from donors, contributions
Exchange result 30 38 83 themes have been proposed for countries to develop a more from targeted industries and administration fees billed to users
Total disposable reserves and liabilities 15,637 8,041 focused approach for the Strategic Partnership.
Interest 13 14 13 of the UTZ Traceability system calculated on the basis of
volume.
Other -141 -1 -6 THE NATIONAL POSTCODE LOTTERY (NPL)
Total financial result -98 51 90 Corporate Income Tax
The NPL granted a subsidy of € 1.5 million for the period The activities of UTZ are exempt from corporate income tax.
2016-2019.
Result 4,194 2,622 263
UTZ 2016 GOVERNANCE & FINANCIAL INFORMATIONUTZ 2016 FACTS & FIGURES
UTZ
Head office:
De Ruyterkade 6
1013 AA Amsterdam
PRODUCING COUNTRIES
PRODUCING & CONSUMING COUNTRIES
UTZ
THE NETHERLANDS
+31 20 530 8000 CONSUMING COUNTRIES
info@utz.org
LOCAL UTZ OFFICES
www.utz.orgCOFFEE COCOA
UTZ certified estimated production volumes green coffee (MT) UTZ certified group member farmers UTZ certified estimated production volumes (MT) UTZ certified group member farmers
Country 2011 2012 2013 2014 2015 2016 Country 2011 2012 2013 2014 2015 2016 Country 2011 2012 2013 2014 2015 2016 Country 2011 2012 2013 2014 2015 2016
Global UTZ certified Global 160,737 165,133 164,721 161,650 186,948 225,505 Global UTZ certified Global 149,633 256,111 336,351 406,702 465,547 614,405
Coffee Volume (MT) 476,903 715,648 726,591 729,918 821,399 870,102 Cocoa Volume (MT) 212,690 534,614 691,490 879,771 917,603 1,188,166
Latin America 30,419 36,535 34,470 27,634 40,892 49,885 Africa 132,960 221,148 284,000 354,253 399,428 536,070
Latin America 338,449 473,580 459,277 449,359 496,340 597,636 Asia 24,225 40,788 49,089 51,120 53,775 41,527 Africa 171,191 440,740 571,859 754,802 775,685 991,729 Latin America 10,526 19,902 21,414 20,570 20,913 25,811
Brazil 166,274 232,336 228,677 244,896 249,126 300,745 Africa 106,093 87,810 81,162 82,896 92,281 134,093 Côte d’Ivoire 96,361 288,483 403,075 506,478 486,842 661,876 Asia 6,147 15,061 30,937 31,879 45,206 52,524
Colombia 62,127 78,171 79,862 69,198 81,379 74,564 Ghana 37,407 85,936 99,497 132,107 169,057 181,365
Honduras 42,405 64,408 60,348 69,253 72,652 82,469 Nigeria 6,708 18,039 28,014 61,106 70,777 72,955
Peru 37,003 58,452 48,511 32,230 36,370 75,551 Sierra Leone 9,180 31,073 17,312 19,374 5,451 13,430
Cameroon
UTZ certified individual farms/estates
Guatemala 13,487 15,997 12,391 8,841 11,382 12,242 438 2,799 2,938 15,320 10,892 35,526
Nicaragua 10,556 13,704 11,407 14,250 25,352 36,046 Uganda 17,999 9,750 13,935 14,320 14,061 6,081 Country 2011 2012 2013 2014 2015 2016
Mexico 2,965 7,891 15,844 7,700 18,040 13,564 UTZ certified individual farms/estates DR of Congo 2,372 2,258 5,087 5,607 12,987 13,070
Costa Rica 2,999 1,857 1,583 2,495 1,713 1,368 Tanzania 725 2,402 2,000 - 4,993 5,458 Global 4 9 40 77 84 103
Country 2011 2012 2013 2014 2015 2016 Togo - - - 489 624 624
Bolivia 251 377 272 166 - -
Dominican Republic 200 204 204 159 129 730 Liberia - - - - - 1,344 Africa 1 - - 1 - 2
El Salvador 182 182 177 96 108 274 Global 569 710 845 865 923 919
Latin America 3 8 36 69 77 96
Panama - - - 76 90 82 Latin America 37,183 73,045 80,131 89,116 86,904 136,488 Asia - 1 4 7 7 5
Latin America 462 599 725 755 801 785 Peru 11,382 23,829 31,688 33,482 32,115 47,871
Asia 112,173 209,523 233,285 241,205 278,218 225,285 Asia 69 73 83 73 70 79 Ecuador 776 4,841 13,903 23,973 31,789 59,626
Vietnam 75,762 158,986 185,928 191,284 224,579 172,620 Africa 38 38 37 37 52 55 Dominican Republic 24,819 44,263 33,363 29,490 18,285 22,056 Workers on UTZ certified farms (Permanent&Seasonal)
India 27,084 31,549 33,520 34,688 38,812 39,320 Nicaragua - - 33 114 929 621
Indonesia 8,001 17,527 12,510 12,997 10,654 9,585 Brazil - - 790 1,538 2,057 4,757 Country 2011 2012 2013 2014 2015 2016
Papua New Guinea 1,327 1,461 1,328 1,266 1,022 1,300 Mexico 206 112 354 513 444 484
China - - - 969 3,151 2,210 Panama - - - 5 66 58 Global UTZ
Laos - - - - - 250 Colombia - - - - 1,218 1,016 certified # of 6,884 10,539 14,405 18,625 17,645 23,675
Workers on UTZ certified farms (Permanent&Seasonal) Cocoa workers
Africa 26,281 32,546 34,029 39,355 46,840 47,181 Country 2011 2012 2013 2014 2015 2016 Asia 4,316 20,830 39,500 35,853 55,014 59,948
Uganda 9,773 18,609 19,395 20,443 20,912 15,593 Indonesia 3,238 19,204 37,776 33,768 52,852 58,018 Africa 1,994 4,884 6,548 7,500 7,638 13,620
Kenya 6,597 7,801 5,910 6,084 7,077 6,201 Global UTZ Vietnam 1,078 1,626 1,725 2,086 2,163 1,931 Latin America 3,392 3,284 3,993 5,791 6,486 5,935
Ethiopia 6,623 3,693 6,578 8,592 12,739 13,488 certified Coffee 305,916 374,794 350,766 242,481 257,248 296,208 Asia 1,498 2,371 3,864 5,334 3,521 4,120
Tanzania 3,047 1,381 1,708 1,696 2,319 2,850 # of workers
Zambia - 424 - - - 885
DR of Congo - 313 313 1,864 2,299 5,158 Latin America 197,921 220,732 164,424 90,366 112,086 153,581
Burundi 220 286 125 175 494 1,733 85,399 123,245 151,571 133,311 103,700 90,065
UTZ certified first buyer sales (MT)
Asia
Rwanda - 39 - 500 1,000 1,272
Africa 22,596 30,817 34,771 18,804 41,462 52,562 Country 2011 2012 2013 2014 2015 2016
Malawi 20 - - - - -
UTZ certified first buyer sales (MT) Global UTZ certified
1st Buyer Cocoa Sales 42,704 118,641 295,084 390,416 581,709 639,087
Country 2011 2012 2013 2014 2015 2016
Africa 33,973 87,046 247,465 336,732 483,978 516,774
Global UTZ certified Côte d’Ivoire 27,949 60,399 190,493 217,689 373,933 345,987
1st Buyer Coffee Sales 136,752 188,096 224,028 258,867 238,392 321,419 Ghana 866 15,995 33,167 79,664 63,308 79,034
Nigeria 2,763 3,449 15,282 20,889 25,105 39,747
Latin America 98,954 132,581 158,317 174,112 167,783 251,022 Sierra Leone 1,664 2,421 1,159 3,453 6,584 6,056
Brazil 58,424 79,666 91,392 112,436 99,631 149,514 Cameroon - 176 754 6,156 6,421 32,895
Honduras 8,327 9,218 20,196 21,699 27,821 32,041 Uganda - 1,687 3,729 6,220 3,956 4,208
Colombia 5,797 6,278 5,691 4,528 5,430 31,758 DR of Congo 480 1,596 2,832 2,661 3,352 7,965
Peru 2,691 3,282 5,275 6,376 2,065 12,597 Tanzania 251 1,323 50 - 1,134 621
Nicaragua 4,557 2,715 2,321 4,617 4,865 10,933 Togo - - - - 186 262
Guatemala 533 2,107 5,248 5,260 5,261 6,876 Liberia - - - - - -
Mexico 1,292 1,052 946 2,327 819 5,668
Costa Rica 207 228 63 42 7 1,635 Latin America 8,535 21,457 24,100 32,380 67,921 78,934
Bolivia 75 115 - 78 - - Peru 3,162 11,138 11,836 16,233 28,170 28,347
Dominican Republic 42 - 19 10 - - Ecuador 689 2,331 5,849 8,873 26,888 36,705
El Salvador - - - - - - Dominican Republic 4,684 7,987 6,348 6,991 12,187 11,790
Panama - - - - - 20 Nicaragua - - 3 43 305 304
Brazil - - 64 239 218 1,584
Asia 35,647 50,165 60,421 76,621 61,672 61,737 Mexico - - - - 129 126
Vietnam 25,519 38,669 49,787 67,380 50,768 48,326 Panama - - - - 23 54
India 7,682 8,815 5,947 6,716 7,033 9,555 Colombia - - - - - 25
Indonesia 1,762 2,108 4,408 2,294 3,398 2,986
China - - - - 223 543 Asia 196 10,139 23,519 21,304 29,810 43,379
Papua New Guinea 684 573 279 230 250 326 Indonesia - 9,108 22,371 20,416 29,010 42,767
Vietnam 181 1,031 1,148 888 800 612
Africa 2,151 5,351 5,290 8,135 8,936 8,660 Papua New Guinea 14 - - - - -
Kenya 509 2,548 1,187 1,382 1,401 1,258
Uganda 1,373 1,906 2,065 2,499 3,118 3,172
Ethiopia 96 568 1,662 3,623 3,358 3,122
Tanzania 76 235 200 277 230 486
Burundi 97 58 - 181 389 289
Zambia - 36 77 - - -
DR of Congo - - 99 173 250 38
Rwanda - - - - 190 295
UTZ
UTZ 2016 FACTS & FIGURESTEA PRODUCING COUNTRIES
UTZ certified estimated production volumes (MT) UTZ certified group member farmers Number of producing countries
Country 2012 2013 2014 2015 2016 Country 2012 2013 2014 2015 2016 2011 2012 2013 2014 2015 2016
Global UTZ certified Global 30,757 9,000 8,615 12,694 12,178 COFFEE 22 23 21 24 23 25
Tea Volume (MT) 65,132 59,979 71,234 86,294 119,642
Africa 27,221 8,530 8,160 10,597 8,672 COCOA 14 14 16 17 19 20
Africa 48,226 37,413 38,076 45,905 44,894 Asia 3,525 460 445 2,090 3,506
Kenya 31,641 20,903 21,472 28,787 27,758 Latin America 11 10 10 7 - TEA 8 10 10 10 12 12
Malawi 10,929 10,832 10,721 11,195 11,468
South Africa (Rooibos) 1,079 1,078 1,540 1,264 1,561 HAZELNUTS 2
Zimbabwe 4,577 4,600 4,342 4,660 4,106
Asia 15,909 21,653 29,632 36,899 71,925
China - - 1,332 1,786 2,960
India 6,710 7,909 14,679 19,244 54,548 UTZ certified individual farms/estates
Indonesia 7,913 10,073 8,000 8,060 7,652
Japan - - - 54 71 Country 2012 2013 2014 2015 2016
SriLanka 1,272 3,655 5,447 7,727 6,666
Vietnam 14 14 175 28 28 Total farm units 70 55 70 81 122
Latin America 997 913 3,526 3,491 2,823 Africa 26 13 14 17 22
Argentina 810 726 3,526 3,437 2,813 Asia 32 41 55 61 97
Colombia 187 187 - 54 10 Latin America 12 1 1 3 3
Workers on UTZ certified farms (Permanent&Seasonal)
Country 2012 2013 2014 2015 2016
UTZ certified first buyer sales (MT)
Country 2012 2013 2014 2015 2016 Global UTZ Argentina - t Ecuador - c Laos - c Sierra Leone - c
certified Tea 45,707 52,540 57,479 58,429 104,335 Brazil - c,c El Salvador - c Liberia - c South Africa - t
Global UTZ Certified # of workers Burundi - c Ethiopia - c Malawi - t Sri Lanka - t
1st Buyer Tea Sales 3,074 4,044 4,527 5,763 6,640 Cameroon - c Georgia - h Mexico - c,c Tanzania - c,c
Africa 20,057 18,593 16,549 15,060 19,901 China - c,t Ghana - c Nicaragua - c,c Togo - c
Africa 1,906 2,524 3,292 3,939 4,308 Colombia - c,c,t Guatemala - c Nigeria - c Turkey - h
Asia 25,272 33,569 40,821 43,003 84,138
Kenya 24 - 272 580 809 Costa Rica - c Honduras - c Panama - c,c Uganda - c,c
Latin America 378 378 109 366 296
Malawi 1,636 1,347 1,708 1,771 1,669 Côte d’Ivoire - c India - c,t Papua New Guinea - c Vietnam - c,c,t
South Africa (Rooibos) 112 826 827 1,076 947 Democratic Republic Indonesia - c,c,t Peru - c,c Zambia - c
Zimbabwe 134 350 485 512 882 of Congo - c,c Japan - t Rwanda - c Zimbabwe - t
Dominican Republic - c,c Kenya - c,t
Asia 909 1,255 971 1,352 2,197 Various countries produce multiple commodities: c = coffee, c = cocoa, t = tea, h = hazelnuts
China - - 16 196 311
India 244 485 466 812 1,108
CERTIFIED AREA (hectares)
Indonesia 631 755 331 221 611
Japan - - - -
SriLanka 34 15 158 122 168
UTZ certified area per region
Latin America 259 266 264 472 135
Argentina 259 266 264 472 135 2011 2012 2013 2014 2015 2016
Global UTZ certified
Coffee Area 348,086 508,661 473,953 473,953 473,953 567,336
HAZELNUTS NOTES
Latin America
Asia
Africa
235,463
58,334
325,975
90,154
295,915
102,124
286,460
109,318
338,367
120,237
377,470
107,460
54,290 92,532 75,914 79,800 90,426 82,406
In 2016 we started collecting data for the start-up phase of Certified volume
our hazelnut program. • Before 2013 certified volume was calculated from
Global UTZ certified
beginning of March. From 2014 onwards certified volume
is calculated using the cut off date of 31 December Cocoa Area 460,390 902,360 1,199,298 1,502,424 1,530,137 2,096,939
2016 • From 2014 certified volumes have been converted to Africa 401,950 792,940 1,059,477 1,355,869 1,358,902 1,874,157
processed product Latin America 52,140 88,252 97,473 105,750 106,070 145,327
Number UTZ certified 3,582 Asia 6,300 21,168 42,348 40,805 65,165 77,455
• Includes Extension volume (when applicable)
Hazelnut farmers
Global UTZ certified
Workers
• In 2014 we changed the way we measure the number of
Tea Area 26,230 36,034 32,757 38,605 47,828 67,679
UTZ certified estimated 16,116 workers, to make it more accurate
production volume Africa 18,772 25,329 18,266 19,842 24,667 24,117
Asia 6,841 10,449 14,249 17,915 21,906 42,789
(MT)
Latin America 618 256 242 849 1,256 774
UTZ
UTZ 2016 FACTS & FIGURESYou can also read