Access to data and information - Anne Schmidt, Chris van Swaay, Rene Henkens and Peter Verweij - Ecologic Institute
←
→
Page content transcription
If your browser does not render page correctly, please read the page content below

A C C E S S   T O   D A T A   A N D   I N F O R M A T I O N
68

      CHAPTER A.III.

Access to data
and information

      Anne Schmidt, Chris van Swaay, Rene Henkens and Peter Verweij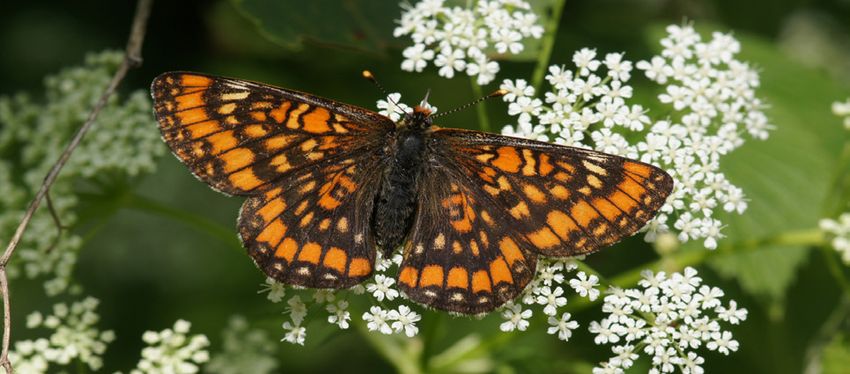
A C C E S S   T O   D A T A   A N D   I N F O R M A T I O N
    69

                                                                                                          Citation
                                                                                                          Chapter A.III: Schmidt, A.M., van Swaay, C.A.M., Henkens,
III.1 Introduction                                                                                        R.J.H.G. & Verweij, P.J.F.M. (2021) In: Schmidt, A.M. &
                                                                                                          Van der Sluis, T. (2021). E-BIND Handbook (Part A):
                                                                                                          Improving the availability of data and information on
                                                                                                          species, habitats and sites.
Biodiversity information is based on data that is gathered by a mixed, large group of people.
Professionals and nature enthusiasts observe and record nature, either using protocols in field           The whole document can be downloaded under
studies, remote sensing and monitoring schemes, or via opportunistic sightings. Despite this              ecologic.eu/book/improving-the-availability-of-data-
seeming abundance in data availability, decision- and policy-makers are constrained by the lack           and-information
of targeted data and indicators, mostly as a result of barriers preventing existing data from
being found and accessed, or by missing forms of presentation that answer questions of policy
makers and practitioners (Verweij et al., 2019; Geijzendorffer et al., 2016; Addison, 2015; Wetzel
et al., 2015; Proença et al., 2017).
                                                                                                          Definition of data, information and
                                                                                                          indicators
                                                                                                          Biodiversity data are pieces of information collected
III.1.3 Different types of data and information sources                                                   through observations or generated via modelling.
                                                                                                          More technically, data is a set of numerical or qualita-
There is a wide range of data and information sources available, including citizen-science data col-
                                                                                                          tive values to describe variables about an individual,
lections, monitoring data collections and networks, GIS-data repositories, research infrastructures
                                                                                                          or object, including space and time. Data become
for open data, synthesis of scientific knowledge and community interfacing platforms aspiring to
                                                                                                          information when the values get a meaning in some
bring the science and policy-making communities closer together. The variety of sources can be
                                                                                                          context for the receiver.
categorized in three main categories (see Box "Types of data and information sources").
                                                                                                          Indicators summarize or simplify relevant informa-
III.1.4 Barriers to sharing of biodiversity data and information                                          tion and play an important role in communicating on
                                                                                                          the status and trends of nature in such a way that
The World Conservation Monitoring Centre (WCMC) of the United Nations Environmental Pro-                  these are useful for decision making, e.g. by relating
gram (UNEP) conducted a review on the barriers to sharing of biodiversity data and information            them to specific management goals and policy targets
and made recommendations for eliminating them (UNEP, 2012). Although progress has been                    (Gallopin, 1996).
made since 2012, most of the barriers identified by the WCMC of UNEP still exist, namely:

»   Psychological and behavioural barriers, which range from unwillingness to share for                   Types of data and information sources
    commercial reasons to barriers resulting from concerns over how data, information and                 There is a wide range of data and information sources
    knowledge might be used, as well as legal barriers.                                                   available which can largely be grouped in (1) data
                                                                                                          lakes (contains raw, non-harmonised data), (2) data
»   Barriers related to describing information and data, which range from a lack of widely
                                                                                                          platforms (a system that enables integration of
    agreed classification systems for some types of biodiversity, to insufficient use of contextual
                                                                                                          harmonised data in other similar datasets and uses a
    and explanatory information linked to datasets.
                                                                                                          quality checked, sometimes open-access, data repos-
»   Practical barriers, which range from knowing how to make data, information and knowl-                 itory, to which, preferably, peer-reviewed articles are
    edge you hold available in meaningful ways, to locating the information that you need from            attached for proof of data quality) and (3) indicator
    amongst plethora of data, information and knowledge available.                                        catalogues. Data lakes and data platforms target
                                                                                                          data analysts. Indicators catalogues aim to provide
                                                                                                          condensed information in the form of indicators with
                                                                                                          accompanying narratives and references.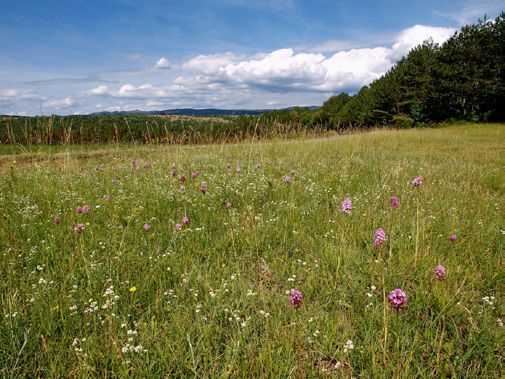
A C C E S S   T O   D A T A   A N D   I N F O R M A T I O N
    70

»   Inadequate strategies and resources that result in data, information and knowledge
    often being made available in an opportunistic manner rather than being focused on need,
    often without sufficient resources being made available.

There are different types of solutions to remove these barriers and actions need to be taken
by different stakeholders. Governments need to provide funding for information resources and
maintenance of infrastructures and develop open data and research policies. Publishers should
increase open access to publications and encourage the publication of data papers. Knowledge
brokers should develop information infrastructures or repositories for ensuring long term access
to data, information and knowledge and further promote the use of common vocabularies,
classification systems and standards. The academic world should promote and create incentives
to increase access to data and information. Donors and others providing support should ensure
that each funded project provides appropriate access to the data and information and promote
longer-term investment in the maintenance of data and information resources and funding of
knowledge management and dissemination.

In some cases the access to data and information is not the problem, but the willing-
ness to use the available data and information. There might be different reasons for
this amongst others the scepticism towards using data collected by volunteers.

III.1.5 Data and information needed for the implementation of the
        Birds and Habitats Directive
For the implementation of the Birds and Habitats Directive data and information are needed on
the species and the habitat types targeted by these directives. This concerns data and infor-
mation on the distribution and population size of species, the area and quality of the habitat
for species and, the distribution, area and structure and function (quality) of habitat types. In
addition, data and information are needed on the impact of pressures and threats and the
effects of mitigation and restoration measures [see chapter B.I. Guidance and tools for effective
restoration measures for species and habitats].

The data and information serve different purposes, amongst others the selection and designa-
tion of Natura 2000 sites, the management of Natura 2000 sites, appropriate assessments for
permitting procedures and conservation status assessments for reporting. This means data
and information is needed on different spatial scale levels ranging from local level to
Natura site level, Natura 2000 network, biogeographical, national and European level.
The user requirements e.g. in terms of the spatial-temporal coverage and resolution of the
data differ depending on the purpose. Where management plans need information in detailed
maps almost at the square meter, the species and habitat distribution maps for the Article 17
reporting only needs to be done in squares of 10x10km. The idea to collect data on multi-
ple scale levels for multiple purposes seems logical, but in practice this is not always
feasible as each monitoring objective requires a specific sampling strategy [see chapter
A.I. Monitoring]. Due to budget constraints priorities need to be set.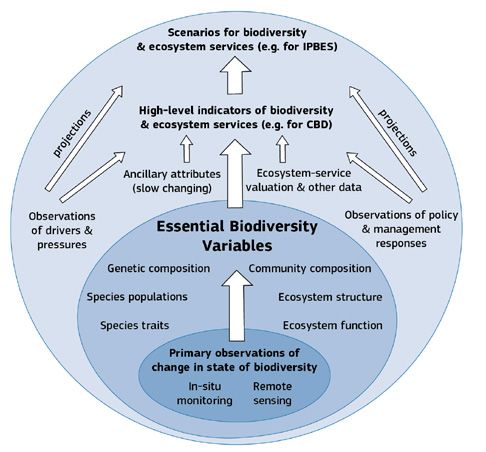
A C C E S S T O D A T A A N D I N F O R M A T I O N
71
Opportunistic data collected by volunteers seem very attractive as the costs of
collecting this type of data are low. Nevertheless, a lot of time and effort is spent
on validating and harmonizing these data (Dobson et al., 2016). Even in successful online
web portals, as iNaturalist.org and observation.org, recorders tend to go to the same places and
sometimes it even gets crowded with volunteers at a well-known spot, where similar spots in
the surroundings are missed. It requires active participation from experts to try and di-
rect ('lure') recorders into visiting unvisited places. At the end this also requires time and
money, which should not be ignored when setting up such systems or using existing ones.
III.2 Strategies, approaches and practical
examples to improve data and
information access
III.2.1 Frameworks, common vocabularies and classification systems
In order to facilitate the exchange of biodiversity data and information there should
be a common understanding on the type of data and information that are needed by
the different users (policy makers, practitioners and scientists). The Birds and Habitats
Directives are important instruments to preserve and restore European biodiversity, but there
is more to it than that. The Convention on Biological Diversity and the European Biodiversity
Strategy have a broader perspective on biodiversity including for example ecosystem services. In
the following paragraphs some examples are given of frameworks and classification systems to
define and describe the data and information with this broader perspective in mind.
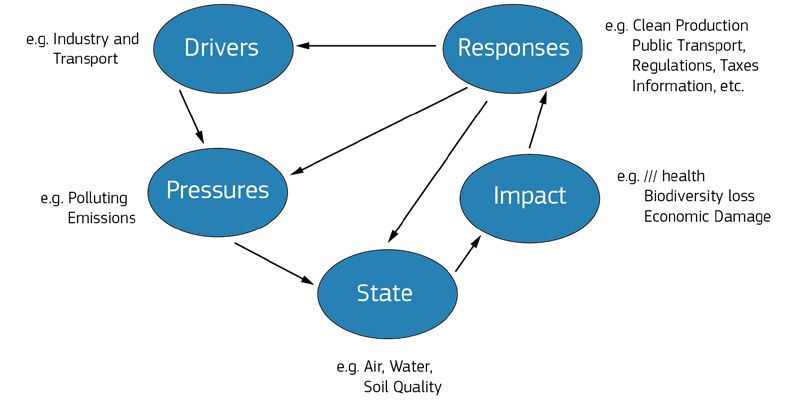
DPSIR framework: drivers, pressures, states, impacts and responses
The DPSIR model (see Figure III.1) adopted by the European Environmental Agency is a causal
framework for describing the interactions between society and the environment. The DPSIR
framework serves as a starting point for the development of indicators to evaluate
environmental policies such as the Birds and Habitats Directives.
The way the conservation status of species and habitats is assessed fits into the
DPSIR framework. Conservation status is being assessed based on several state variables (e.g.
the distribution and population size of species), that are influenced by pressures resulting from
different drivers (e.g. pollution from agriculture) and by policy and management responses act-
ing upon them (e.g. measures to reduce pollution from agriculture). State indicators ideally are
derived from observational data, whereas the impact of pressures and the effects of conserva-
tion measures – in most cases – are assessed based on directed research or expert judgement.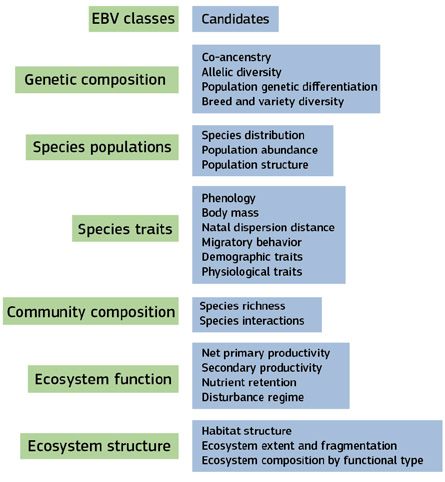
A C C E S S   T O   D A T A   A N D   I N F O R M A T I O N
  72

                                                                                                           Figure III.1
                                                                                                           DPSIR framework of the European Environmental Agency.
                                                                                                           Source: www.eea.europa.eu/publications/92-9167-059-6-
                                                                                                           sum/page002.html

The concept of biodiversity
In order to collect, exchange and/or integrate data from multiple sources it is im-
portant as well to develop a common vocabulary and unified classification systems,
starting with the concept of biodiversity. Noss (1990) distinguishes different compo-
nents (composition, structure and function) and different levels of biodiversity (genes, species
populations, communities, ecosystems and landscapes), see Figure III.2. The components and
levels of biodiversity to be addressed depend on the research, policy or management
questions that need to be answered.

The Birds Directive and Habitats Directive are targeted on the level of ecosystems
and communities (habitat types) and species populations (species). Different compo-
nents are being addressed on these levels for example the population structure of species
and the structure and function of habitat types. Nevertheless for the implementation of the
directives the other levels of biodiversity are relevant as well, for example genetic diversity is
important for setting favourable reference values on population size of species.

Essential Biodiversity Variables (EBVs)
The GEOBON network (https://geobon.org/) are developing the so called Essential Biodiversity
Variables (EBVs), that to a large extent are based on the hierarchical approach of monitor-
ing biodiversity proposed by Noss (1990). The EBVs provide the first level of abstraction
between low-level primary observations and high-level indicators of biodiversity (see
Figure III.3). There are 6 EBV classes with 21 EBV candidates (see Figure III.4).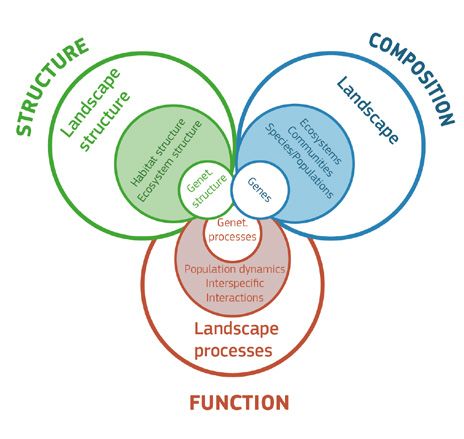
A C C E S S   T O     D A T A   A N D   I N F O R M A T I O N
  73

The EBVs serve different purposes. They are applied                                                        Figure III.2
to integrate data coming from different sources e.g.                                                       Schematic visualisation of major biodiversity components
in-situ (field surveys and monitoring schemes) and                                                         (structure, composition, function) with hierarchical nested
ex-situ (remote sensing) measurements and to trans-                                                        levels in each case (adapted after Noss, 1990). The co-
form these data into biodiversity indicators relevant                                                      loured areas highlight the most feasible level, the level of
for biodiversity assessments and reporting. They                                                           diversity in species (species richness), within ecosystems
might become the window into the biodiversity observation                                                  and in population interactions.
systems upon which researchers, managers and decision                                                      Source: www.researchgate.net/figure/Schematic-visualisa-
makers at different levels can better interact while they do                                               tion-of-major-biodiversity-components-structure-composi-
their jobs. As illustrated in Figure III.3 EBVs concern state                                              tion_fig1_281586657
variables sensitive to change depending on drives,
pressures and policy and management responses,
that act upon them.

The EBV classes that are relevant for the Birds and
Habitat Directives are species populations (e.g. spe-
cies distribution and population abundance), ecosys-
tem function (e.g. disturbance regime) and ecosystem
structure (habitat structure, ecosystem extent and
fragmentation). Whereas the monitoring of trends in
distribution and population size of species seems quite
well developed, the monitoring of the distribution and area                                                Figure III.3
of habitat types is quite challenging and even more the                                                    Essential Biodiversity Variables.
monitoring and assessment of the ‘quality of the habitat                                                   Source: geobon.org/ebvs/what-are-ebvs
for species’ and the ‘structure and function of habitat types’
[see chapter A.I. Monitoring]. The further development
of EBVs might be of help to harmonize the monitor-
ing and assessment methods applied by different EU
member states for the purpose of the implementa-
tion of the BD and HD.

Identification and classification systems (code
lists)
a. Taxonomy: species identification and classification

Taxonomy is a scientific discipline that has provided
the universal naming and classification system of
biodiversity for centuries and continues effectively to
accommodate new knowledge (Thomson et al., 2018).
The assumption that species are fixed entities underpins
every international agreement on biodiversity conservation,
A C C E S S   T O   D A T A   A N D   I N F O R M A T I O N
    74

all national environmental legislation and the efforts of many                                           Figure III.4
individuals and organizations to safeguard plants and animals                                            EBV’s classes and candidates.
(Garnett and Christidis, 2017). New knowledge, sometimes                                                 Source: www.earthobservations.org/uploads/438_2_essen-
caused by new techniques, can lead to a change in taxono-                                                tial_biodiversity_variable_strategy_v1.pdf
my. Because of this species get split, lumped with other species,
or are moved to another genus. This also applies to the species
in the Annexes of the Habitats Directive, where e.g. Hypodryas
maturna (see Figure III.5) from the original list was moved to the
genus Euphypdryas, and Polyommatus eroides is now considered
a subspecies of the Alpine Polyommatus eros.

To keep legislation in line with new knowledge in taxono-
my, a decent backbone is needed describing the most up-
to-date taxonomy. Users need standardised and continu-
ously harmonised taxonomic reference systems, as well as
high-quality and complete taxonomic data sets (De Jong et
al. 2015). Several initiatives have been launched to provide this:

»   The Pan-European Species-directories Infrastructure
    (PESI) provides a mechanism to deliver an integrated, anno-
    tated checklist of the species occurring in 'geographic Europe',
    aiming to cover the Western Paleartic biogeographic region. At
    the core of EU-nomen are five community networks, with com-
    mon nomenclatures or systems designations: Zoology, Botany,
    Marine Biota, Mycology and Phycology (De Jong et al., 2015). The present status of PESI
    is unclear, as recent searches on the website (www.eu-nomen.eu/pesi) did not give decent
    results to all queries, also not for Habitat Directive species.

»   EUNIS (eunis.eea.europa.eu/species.jsp) provides a website with information targeted at
    accessing information about species in Europe, particularly species mentioned in legal texts.
    However many species names appear not to be updated to the latest taxonomy.

»   Fauna Europaea (fauna-eu.org) was supposed to become Europe's main zoological tax-
    onomic index, also feeding into PESI (see above). However, due to financial constraints the
    information is not up-to-date anymore.

»   Euromed Plantbase (www.emplantbase.org/home.html): The Euro+Med PlantBase provides
    an on-line database and information system for the vascular plants of Europe and the
    Mediterranean region, against an up-to-date and critically evaluated consensus taxonomic
    core of the species concerned. The Euro+Med PlantBase is part of the Pan-European Species
    directories Infrastructure (PESI), funded by the European Union under the Framework 7
    Capacities Work Programme.
A C C E S S T O D A T A A N D I N F O R M A T I O N
75
Figure III.5
Euphydryas maturna. Photo: Chris van Swaay from the
Dutch Butterfly Foundation.
» WORMS (World Register of Marine Species: the main taxonomic reference system for marine
environment (www.marinespecies.org)
» Catalogue of Life (www.catalogueoflife.org): The Catalogue of Life is the most com-
prehensive and authoritative global index of species currently available. It consists of a
single integrated species checklist and taxonomic hierarchy. The Catalogue holds essential
information on the names, relationships and distributions of over 1.8 million species. This
figure continues to rise as information is compiled from diverse sources around the world.
For Catalogue of Life a new infrastructure is currently being developed in the CoL+ project
(www.dissco.eu/catalogue-of-life).
It is obvious from the above mentioned initiatives, that users will find it difficult to find their
way in all these websites.
The Darwin Core Standard (DwC) offers a stable, straightforward and flexible frame-
work for compiling biodiversity data from varied and variable sources. Originally
developed by the Biodiversity Information Standards (TDWG) community, Darwin Core is 'an
evolving community-developed biodiversity data standard. It plays fundamental role in the
sharing, use and reuse of open-access biodiversity data (www.gbif.org/darwin-core). One of
the cores is a Taxon core, which lists a set of species, typically coming from the
same region or sharing common characteristics. This is an open-source way of stan-
dardizing taxa, used e.g. in GBIF (gbif.org).A C C E S S T O D A T A A N D I N F O R M A T I O N
76
b. Ecosystem typologies: habitat identification and classification
Many ecosystem and habitat typologies exist ranging from local to global level. In the follow-
ing paragraph some of the main typologies used on EU level are shortly described to start
with the EU Habitat Directive Annex 1 habitat types. Translations are being made between
these different typologies.
Figure III.6
EU Habitats Directive Annex I habitat types Slovenia, Osrednjeslovenska, Brezovica 5, Saxifraga-Hans
The Habitat Directive Annex I lists today 233 European Dekker. Source: www.freenatureimages.eu
natural habitat types, including 71 priority (i.e. habitat
types in danger of disappearance and whose natural
range mainly falls within the territory of the European
Union). Annex I was initially based on the hierarchical
classification of European habitats developed by the
CORINE Biotopes project since that was the only existing
classification at European level. An Interpretation Manual
describes the habitats but there is often variation between
Member States in how they interpret the habitat types,
sometimes there is variation between regions in the same
country. There is a specific code list for identification of
the habitat types, described as well for the Habitats Direc-
tive Article 17 reporting.
EUNIS habitat classification
The EUNIS habitat classification is a comprehensive pan-European system for habitat identi-
fication. The EUNIS habitat classification covers both natural and artificial pan-Euro-
pean habitats and groups them into 11 broad categories:
1 Marine habitats
2 Coastal habitats
3 Inland surface waters
4 Mires, bogs and fens
5 Grasslands and lands dominated by forbs, mosses or lichens
6 Heathland, shrub and tundra
7 Woodland, forest and other wooded land
8 Inland unvegetated or sparsely vegetated habitats
9 Regularly or recently cultivated agricultural, horticultural and domestic habitats
10 Constructed, industrial and other artificial habitats
11 Habitat complexes
The habitat types are identified by specific codes, names and descriptions.A C C E S S T O D A T A A N D I N F O R M A T I O N 77 The MAES ecosystem typology The MAES project (MAES: Mapping and Assessment of Ecosystem and their Services) has proposed a typology that distinguishes 12 main ecosystem types based on the higher levels of the EUNIS Habitat Classification. The interpretation of ecosystem typologies is often complicated and even more so the mapping and monitoring of habitats [see chapter A.I Monitoring of species and habitats]. Member States may use the same codes, but the interpretation and the mapping / monitoring and assessment methods differ leading to inconsistencies in the data and information being reported. c. Classification systems for drivers, pressures, impact and responses For the purpose of reporting the EC proposes classification systems and code lists are pre- scribed for the identification of pressures and threats and conservation measures. These clas- sification systems are based on former classification systems such as proposed by Salafsky et al. (2007). Differences exist between the classification systems and code lists of different directives, such as the Birds and Habitats Directives, the Water Framework Directive and Ma- rine Strategy Framework Directive. Although unified classification systems for drivers, pressures, impact and responses (e.g. mitigation and conservation measures) exist, data and information are often lacking or inaccessible. The reporting formats of the Birds and Habitats Directives don’t request evidence on pressures and threats in terms of quantitative data (e.g. trends). III.2.2 Data portals and services A data portal on the internet acts as a ‘gateway’ to a series of other websites that deal with the same subject. In some countries, national level web portals exist, which provide the ability to customise local projects to suit the needs and interests of key stakeholders at the same time as feeding into larger databases using standardised data collection and curation pro- tocols. Examples include Artportalen in Sweden, the Norwegian Biodiversity Information Centre, waarneming.nl and telmee.nl in the Netherlands and the National Biodiversity Network in the UK. These portals create a bridge between the needs of large Biodiversity Observation Networks and the needs of local stakeholders by reducing many of the barriers that hinder data flows. These portals provide many of the tools, systems access to expertise, feedback and other resources that otherwise make connecting local projects to global programs challenging (Chandler et al., 2017). Next to these national gateways, iNaturalist.org and observation.org provide international data portals, making it possible for everyone in the world to enter any living organism in the world. Part of this data is uploaded to GBIF.
A C C E S S   T O   D A T A   A N D   I N F O R M A T I O N
  78

In the following paragraphs some examples are presented of global and European data portals
and services, that are or might become of importance for the implementation of the Birds and
Habitats Directives.

GBIF – Global Biodiversity Information Facility
GBIF (www.gbif.org) is an international network and research infrastructure funded by the
world’s governments and aimed at providing anyone, anywhere, open access to data about all
types of life on Earth.

The GBIF network of participating countries and organizations, provides data-holding institutions
around the world with common standards and open-source tools that enable them to share
information about where and when species have been recorded. This knowledge derives from
many sources, including everything from museum specimens collected in the 18th and 19th cen-
tury to geotagged smartphone photos shared by amateur naturalists in recent days and weeks.

The GBIF network draws all these sources together through the use of data standards, such as
Darwin Core (DwC is meant to provide a stable standard reference for sharing information on
biological diversity, Wieczorek et al., 2012), which forms the basis for the bulk of GBIF.org’s index
of 1,5 billion of species occurrence records. GBIF covers for instance over 500 million species
occurrences for the participating countries in Europe. Publishers provide open access to their
datasets using machine-readable Creative Commons licence designations, allowing scientists,
researchers and others to apply the data in hundreds of peer-reviewed publications and policy
papers each year. Many of these analyses—which cover topics from the impacts of climate
change and the spread of invasive and alien pests to priorities for conservation and protected
areas, food security and human health—would not be possible without this. Currently, more than
two peer-reviewed articles that use data discovered and accessed through GBIF are published
every day of the year (www.gbif.org/literature-tracking).

The National Biodiversity Network UK
The National Biodiversity Network NBN (nbn.org.uk) is a collaborative partnership created to
exchange biodiversity information (see Figure III.7). The NBN Trust, the charity which oversees
and facilitates the development of the Network, has a membership including many UK wild-
life conservation organisations, government, country agencies, environmental agencies, local
environmental records centres and many voluntary groups. Different tools are made available to
record, share and explore data.

                                                                                                          Figure III.7
                                                                                                          NBN Data Flow Pathway. Source: nbn.org.uk/wp-content/
                                                                                                          uploads/2015/10/Data-flow-pathway-headings-only.jpg.
A C C E S S T O D A T A A N D I N F O R M A T I O N 79 EVA – European Vegetation Archive The European Vegetation Archive (EVA – euroveg.org/eva-database) is an initiative of Euro- pean Vegetation Survey aimed at establishing and maintaining a single data reposi- tory of vegetation-plot observations (i.e. records of plant taxon co-occurrence at particular sites, also called phytosociological relevés) from Europe and adjacent areas and to facilitate the use of these data for non-commercial purposes, mainly academic research and applications in nature conservation and ecological restoration. The initiative follows the EVA Data Property and Governance Rules. It closely cooperates with the Global Index of Vegetation-Plot Databases (GIVD), the Global Vegetation Database (sPlot) and the Plant Trait Database (TRY). EVA stores copies of national and regional vegetation-plot databases on a single software plat- form. By 30 June 2015, 61 databases from all European regions have joined EVA, contributing in total 1.027.376 vegetation plots, 82% of them with geographic coordinates, from 57 countries. EVA provides a unique data source for large-scale analyses of European vegetation diversity both for fundamental research and nature conservation applications (Chytrý et al., 2016). Copernicus Copernicus (www.copernicus.eu/en/services) is the largest space data provider in the world, current- ly producing 12 terabytes per day. Copernicus is a European Union Programme aimed at de- veloping European information services based on satellite Earth Observation and in situ (non-space) data. The Programme is coordinated and managed by the European Commission and implemented in partnership with the Member States, the European Space Agency (ESA), the European Organisation for the Exploitation of Meteorological Satellites (EUMETSAT), the European Centre for Medium Range Weather Forecasts (ECMWF), EU Agencies and Mercator Océan. Vast amounts of global data from satellites and from ground based, airborne and seaborne measurement systems are being used to provide information to help service providers, public authorities and international organisations. The vast majority of data and information delivered by Copernicus are made available and accessible to any citizen and any organisation around the world on a free, full and open access basis. Copernicus analyses the data in a way that generates indicators useful for policy makers and end users, providing information on past, present and future trends. They can analyse, for example, the air quality in our cities and detect visible and noticeable increases in air pollution (smoke, dust, smog) or analyse the rise in global sea levels. Monitoring portals With the monitoring of more and more taxa spreading over Europe, there are now portals bringing together data and results for use at a higher level. So far the main portals are for birds (Pan-European Common Bird Monitoring Scheme: pecbms.info) and butterflies (European But- terfly Monitoring Scheme: butterfly-monitoring.net). They summarize pan-European as well as EU-trends and indicators, providing a background for trends in Member States. In most cases the underlying data is also used by the member states for biodiversity reporting.
A C C E S S   T O   D A T A   A N D   I N F O R M A T I O N
    80

III.2.3 Open data principles, policies and practices
As described by the WCMC some people and organisations are unwilling to share biodiversity
data for various reasons, but there is a rising awareness that sharing data helps to improve the
knowledge on the environment and may increase as well the effectiveness of human interven-
tions to protect and preserve the environment. From the academic world there are different ini-
tiatives – often community driven – to improve access to data. Governments are developing and
implementing policies for open data and research whereas the funding organisations demand                 Network coherence is often addressed on the basis of:
the appropriate access to the data being collected in research projects. These initiatives and pol-
icies are contributing as well to improve the access to data and information (and knowledge) for          »   assessment of landscape fragmentation, through
the implementation of the Birds and Habitats Directives. In the next paragraphs some of these                 indices
initiatives are presented.                                                                                »   assessment of functionality of the landscape for
                                                                                                              particular species or ecosystems
GO FAIR                                                                                                   »   assessment of corridors
GO FAIR is a bottom-up, stakeholder-driven and self-governed initiative that aims
to implement the FAIR data principles (www.go-fair.org/fair-principles), making data
Findable, Accessible, Interoperable and Reusable (FAIR). It offers an open and inclusive
ecosystem for individuals, institutions and organisations working together through Imple-
mentation Networks (INs). The INs are active in three activity pillars: GO CHANGE, GO TRAIN
and GO BUILD. The principles emphasise machine-actionability (i.e., the capacity of
computational systems to find, access, interoperate, and reuse data with none or
minimal human intervention) because humans increasingly rely on computational support
to deal with data as a result of the increase in volume, complexity, and creation speed of data
(Wilkinson et al., 2016).

Research Data Alliance (RDA)
The Research Data Alliance (www.rd-alliance.org) was launched as a community-driven
initiative in 2013 by the European Commission, the US Government's National Science
Foundation and National Institute of Standards and Technology, and the Australian
Government’s Department of Innovation with the goal of building the social and tech-
nical infrastructure to enable open sharing and re-use of data.

RDA wants researchers and innovators to openly share data across technologies, disciplines, and
countries to address the grand challenges of society. RDA’s mission is to build the social and
technical bridges that enable open sharing and re-use of data.

Open Data Directive
The Directive on open data and the re-use of public sector information, also known as the ‘Open
Data Directive’ (Directive (EU) 2019/1024) entered into force on 16 July 2019. Once fully trans-
posed on the national level, the new rules will:

»   Stimulate the publishing of dynamic data and the uptake of Application Programme
    Interfaces (APIs).
A C C E S S T O D A T A A N D I N F O R M A T I O N
81
» Limit the exceptions which currently allow public bodies to charge more than the marginal
costs of dissemination for the re-use of their data.
» Enlarge the scope of the Directive to:
→ data held by public undertakings, under a specific set of rules. In principle, the A number of examples based on LIFE or Interreg
Directive will only apply to data which the undertakings make available for re-use. projects are presented on how measures were
Charges for the re-use of such data can be above marginal costs for dissemination; prepared for improvement of the coherence of
→ research data resulting from public funding – Member States will be asked to habitats, as well as for specific species:
develop policies for open access to publicly funded research data. New rules will also » Boreal Baltic coastal meadows (1630*)
facilitate the re-usability of research data that is already contained in open repositories. » Alpine rivers and their ligneous vegetation with
» Strengthen the transparency requirements for public–private agreements involving public Myricaria germanica (3230)
sector information, avoiding exclusive arrangements. » Temporary Mediterranean ponds (3170*)
» European sturgeon/Beluga (Huso Huso) (HD App.
In addition, the Open Data Directive requires the adoption by the Commission (via a future V)
implementing act) of a list of high-value datasets to be provided free of charge. These » Large copper (Lycaena dispar) (HD App. II, IV)
datasets, to be identified within a thematic range described in the Annex to the Directive, have » Eurasian lynx (Lynx lynx) (HD App. II, IV)
a high commercial potential and can speed up the emergence of value-added EU-wide informa- » Stag beetle (Lucanus cervus) (HD App. II)
tion products. They will also serve as key data sources for the development of Artificial Intelli-
gence. Member States have to transpose Directive (EU) 2019/1024 by 16 July 2021.
III.2.4 Information systems The flora of Baltic coastal meadows is very rich, e.g. in
Estonia a total of 390 plants species have been found,
Information systems bring together data and information from different sources and dissem- which is 26% of all Estonian species. More than 20
inate this information in a structured way for different types of users. They are oriented to a protected species grow on coastal meadows, including
specific domain such as biodiversity and organised around certain user communities (govermen- many orchids: Dactylorhiza ruthei, Frog orchid (Coelo-
tal officials and/or scientists). In the next paragraphs some examples on global and European glossum viride), Fen orchid (Liparis loeselii), Baltic
level are described. orchid (Dactylorhiza baltica), Blood-red dactylorhiza
(Dactylorhiza incarnata ssp. cruenta), Early marsh
EUNIS – European Nature Information System orchid (Dactylorhiza incarnata), Musk orchid (Hermini-
The European Nature information System, EUNIS (eunis.eea.europa.eu/index.jsp), brings togeth- um monorchis), Marsh helleborine (Epipactis palustris),
er European data from several databases and organisations into three interlinked Early-purple orchid (Orchis mascula), Common spotted
modules on sites, species and habitat types. The EUNIS information system is part of the orchid (Dactylorhiza fuchsii), Military orchid (Orchis
European Biodiversity Centre and it is a contribution to the knowledge base for implementing militaris), Fly orchid (Ophrys insectifera) and Fragrant
the EU and global biodiversity strategies and the 7th Action Programme. The EUNIS informa- orchid (Gymnadenia conopsea).
tion system provides access to the publicly available data in the EUNIS database.
Other decorative species in coastal meadows are:
BISE – Biodiversity Information System of Europe Gladiolus imbricatus, Armeria maritima, Tetragonol-
Biodiversity Information System of Europe, BISE (biodiversity.europa.eu) is a single entry point obus maritimus, large pink Dianthus superbus and
for data and information on biodiversity supporting the implementation of the EU Red kidney vetch Anthyllis vulneraria var. coccinea
strategy and the Aichi targets in Europe. Bringing together facts and figures on biodiversity (Anonymous, 2011).A C C E S S T O D A T A A N D I N F O R M A T I O N 82 and ecosystem services, it links to related policies, environmental data centres, assessments and research findings from various sources. It is being developed to strengthen the knowl- edge base in support of the implementation of the EU biodiversity strategy e.g. Birds and Habitats Directives and the assessment of progress in achieving the 2020 targets. OBIS – Ocean Biographic Information System OBIS (www.obis.org) is a global alliance that collaborates with scientific communities to facilitate free and open access to, and application of, biodiversity and biogeographic data and information on marine life. To date more than 20 OBIS nodes around the world have been established, which facilitate the connection of data sources in their region to the master OBIS data network and also increasingly provide specialised services or views of OBIS data to users in their particular region. The OBIS nodes connect over 500 institutions from 56 countries. Collectively, they have provided over 45 million observations of nearly 120.000 ma- rine species, from Bacteria to Whales, from the surface to 10.900 meters depth, and from the Tropics to the Poles. The datasets are integrated so you can search and map them all seam- lessly by species name, higher taxonomic level, geographic area, depth, time and environmental parameters. III.2.5 Knowledge networks Knowledge networks are collections of individuals and teams who come together across or- ganizational, spatial and disciplinary boundaries to invent and share a body of knowledge. The focus of such networks is usually on developing, distributing and applying knowledge. Just as information systems knowledge networks are often focussed on certain domains. In the next paragraphs some good examples are presented. The Natura 2000 Biogeographical Process The EU Biodiversity Strategy calls for significant improvements in the conservation status of species and habitats protected under the EU Birds and Habitats Directives by 2020. To help meeting this target, the European Commission launched in 2012 the Natura 2000 Biogeograph- ical Process, a multi-stakeholders' co-operation process at the biogeographical level, including seminars, workshops and cooperation activities to enhance effective implementa- tion, management, monitoring, financing and reporting of the Natura 2000 network. OBN network In The Netherlands there is a knowledge network called ‘OBN’ with researchers, conservation site managers, universities, consultancies, NGO’s and governmental bodies, such as provinces and water boards, closely cooperating to restore ecosystems and nature reserves. In this net- work, knowledge and practice intermingle, and science and nature management jointly look for the most effective approaches to enhance sustainable conservation of important ecosystems in the Dutch landscapes [see chapter B.I. Guidance and tools for effective restoration measures for species and habitats].
A C C E S S   T O   D A T A   A N D   I N F O R M A T I O N
  83

III.3 Key findings and recommendations
There are many initiatives to improve access to data and information on different scale levels
(from local to global level), but often with a much broader scope than the implementation of the
Bird and Habitat Directives. The challenge is to explore/exploit these initiatives for the purpose
of a better implementation of the Birds and Habitats Directives. Obviously a combination of
different approaches is needed to remove the barriers as identified by the WCMC.

III.3.1 Frameworks, common vocabulary and classification systems
A broader perspective than the Birds and Habitats Directives is needed to
improve access to biodiversity data and information
When defining the data and information needs and developing classification systems for the pur-
pose of streamlining data flows, it is important to look from a broader perspective than just the
Birds and Habitats Directives, as there is a strong relation and overlap with other EU directives
(e.g. the Water Framework Directive, the Marine Strategy Framework Directive), biodiversity con-
ventions and agreements (e.g. the Convention on Biological Diversity). Harmonisation of classifi-
cation systems used by these directives is recommendable.

The DPSIR framework is a good starting point for defining common
indicators
The DPSIR framework is useful as a starting point to define the data and information needs and
develop indicators. The assessments for the purpose of the implementation of the Birds and
Habitats Directives (e.g. conservation status assessment and proper assessments) fit into this
framework. State indicators such as (trends in) population size of species form the basis of these
assessments, but indicators for drivers, pressures, impacts and responses are important as well,
specifically when addressing the impact of transitions of economic sectors on biodiversity.

The Essential Biodiversity Variables are a useful concept for harmonising
monitoring and assessments
The EBVs offer opportunities to harmonise (not necessarily standardise) the monitoring and
assessment methods of different Member States as they can serve as a window for observation
networks and facilitate the integration of data coming from different sources. The challenge will
be to define common state indicators – useful for the implementation of the Birds and Habitats
Directives – based on the EBVs, and to operationalise these indicators with the help of observa-
tion data coming from different sources. In addition to state indicators other type of indicators of
the DPSIR framework (drivers, pressures, impacts and responses etc.) should be defined.

Identification and classification systems need to be maintained
There is obviously a need for unified identification and classification systems, that are maintained
on the long term. Many initiatives such as PESI are no longer maintained and therefore not useful
anymore.
A C C E S S     T O   D A T A   A N D   I N F O R M A T I O N
  84

III.3.2 Data portals and services
Linking data portals on different scale levels                                                             Figure III.8
There are several good examples of data portals and                                                        Number of records of observations on macro moths from
services making data accessible for different stakehold-                                                   GBIF data, 10th of March 2020, doi.org10.15468dl.w1aafk
ers and for multiple purposes operating on different
scales (from local to global). The challenge is to have
more and more organisations and networks contributing
to these portals and to streamline the data flows from
local to global and vice versa. Available funding on a long
term basis and the contribution of certain communities
(often out of idealistic motives) determines the success
of these portals. In Figure III.8 the number records of the
observations on macro moths from GBIF are presented
to illustrate that there is quite some difference between
the Member States in terms of data availability.

Better use of the potential of opportunistic
data
The efficient use of the widely collected opportunistic
data requires active participation of leading scientists
and conservationists. They can bind volunteer recorders
and steer them to active investigation of ‘empty’ areas.

Better use of the potential of remote sensing data
The use of remote sensing has not yet been fully assimilated into standard biodiversity conser-
vation practices. The remote sensing community needs to continue to reach out to the broader
conservation community and to simplify access to images and the derived products that the
broader community need (link with remote sensing chapter). These actions will facilitate greater
use and integration and increase the return on the huge investment in remote sensing infra-
structure. As more and different types of sensors become available and as coordination with
that broader community continues to increase, remote sensing will play an ever-increasing role,
providing global, periodic data that can improve our understanding of change as well as how
society responds (Geller et al., 2017).

III.3.3 Open data and research principles, policies and practices
The FAIR principles are important to improve data and information access. By means of open
data policies these principles can be put in practice. Data portals play an important role, making
it easier for data custodians to register their data.
A C C E S S        T O    D A T A      A N D      I N F O R M A T I O N
   85

III.3.4 Information systems
Many information systems are being developed that serve different purposes. The maintenance
of these systems can be problematic due to lack of long-term funding and governance.

III.3.5 Knowledge networks
Knowledge networks of e.g. scientists and practitioners are very valuable as long as they stay in
place for a long period of time.

III.4 References
Adamec, M., Álvares, F., Anders, O., Andrén, H., Balciauskas, L., Balys, V., . . . Boitani, L. (2012). Status, management and
    distribution of large carnivores – bear, lynx, wolf & wolverine – in Europe.

Addison, P.F.E., et al. (2015). Are we missing the boat? Current uses of long-term biological monitoring data in the evaluation
     and management of marine protected areas. Journal of Environmental Management 149: 148–156.

Chandler, M., et al. (2017). Contribution of citizen science towards international biodiversity monitoring. Biological Conserva-
    tion 213: 280–294.

Chytrý M., et al. (2016). European Vegetation Archive (EVA): an integrated database of European vegetation plots. Applied
     Vegetation Science 19: 173–180. onlinelibrary.wiley.com/doi/full/10.1111/avsc.12191

Dobson, A.D.M. , Milner-Gulland, E.J., Aebischer, N.J., Beale, C.M., Brozovic, R., Coals, P., Critchlow, R., Dancer, A., Greve, M.,
    Hinsley, A., Ibbett, H., Johnston, A., Kuiper, T., Le Comber, S., Mahood, S.P., Moore, J.F., Nilsen, E.B., Pocock, M.J.O., Quinn,
    A., Travers, H., Wilfred, P., Wright, J., Keane, A. (2016). Making Messy Data Work for Conservation, One Earth, Volume 2,
    Issue 5, 2020, Pages 455–465, ISSN 2590-3322, doi.org/10.1016/j.oneear.2020.04.012

Gallopín, G. (1996). Environmental and sustainability indicators and the concept of situational indicators. A systems ap-
     proach. Environmental Modeling and Assessment 1: 101–117.

Garnett S.T., Christidis L. (2017). Taxonomy anarchy hampers conservation. Nature. 546(7656): 25–27. doi.
    org/10.1038/546025a PMID: 28569833

Geijzendorffer, I.R., Regan, E.C., Pereira, H.M., Brotons, L., Brummitt, N., Gavish, Y., Haase, P., Martin, C.S., Mihoub, J.-B., Se-
     cades, C., Schmeller, D.S., Stoll, S., Wetzel, F.T. and Walters, M. (2016), Bridging the gap between biodiversity data and
     policy reporting needs: An Essential Biodiversity Variables perspective. J Appl Ecol, 53: 1341–1350. doi:10.1111/1365-
     2664.12417

Geller, G.N. et al. (2017). Remote Sensing for Biodiversity. In: The GEO Handbook on Biodiversity Observation Networks.
     Michele Walters and Robert J. Scholes (eds.). 330p.

De Jong Y., Kouwenberg J., Boumans L., Hussey C., Hyam R., Nicolson N., Kirk P., Paton A., Michel E., Guiry M., Boegh P., Peder-
    sen H., Enghoff H., von Raab-Straube E., Güntsch A., Geoffroy M., Müller A., Kohlbecker A., Berendsohn W., Appeltans W.,
    Arvanitidis C., Vanhoorne B., Declerck J., Vandepitte L., Hernandez F., Nash R., Costello M., Ouvrard D., Bezard-Falgas P.,
    Bourgoin T., Wetzel F., Glöckler F., Korb G., Ring C., Hagedorn G., Häuser C., Aktaç N., Asan A., Ardelean A., Borges P., Dho-
    ra D., Khachatryan H., Malicky M., Ibrahimov S., Tuzikov A., De Wever A., Moncheva S., Spassov N., Chobot K., Popov A.,
    Boršić I., Sfenthourakis S., Kõljalg U., Uotila P., Olivier G., Dauvin J., Tarkhnishvili D., Chaladze G., Tuerkay M., Legakis A.,
    Peregovits L., Gudmundsson G., Ólafsson E., Lysaght L., Galil B., Raimondo F., Domina G., Stoch F., Minelli A., Spungis V.,
    Budrys E., Olenin S., Turpel A., Walisch T., Krpach V., Gambin M., Ungureanu L., Karaman G., Kleukers R., Stur E., Aagaard
    K., Valland N., Moen T., Bogdanowicz W., Tykarski P., Węsławski J., Kędra M., M. de Frias Martins A., Abreu A., Silva R.,
    Medvedev S., Ryss A., Šimić S., Marhold K., Stloukal E., Tome D., Ramos M., Valdés B., Pina F., Kullander S., Telenius A.,
    Gonseth Y., Tschudin P., Sergeyeva O., Vladymyrov V., Rizun V., Raper C., Lear D., Stoev P., Penev L., Rubio A., Backeljau
    T., Saarenmaa H., Ulenberg S. (2015) PESI – a taxonomic backbone for Europe. Biodiversity Data Journal 3: e5848. doi.
    org/10.3897/BDJ.3.e5848
A C C E S S T O D A T A A N D I N F O R M A T I O N
86
Noss, R.F. (1990). Indicators for Monitoring Biodiversity: A Hierarchical Approach. Conservation Biology, 4: 355–364.
doi:10.1111/j.1523-1739.1990.tb00309.x
Proença, V., et al. (2017). Global biodiversity monitoring: From data sources to Essential Biodiversity Variables. Biological
Conservation 213: 256–263.
Salafsky, N., Salzer, D., Statterfield, A.J., Hilton-Taylor, C., Neugarten, R., Butchart, S.H.M., Collen, B., Cox, N., Master, L.L.,
O'Connors, S. and Wilkie, D. (2008). A Standard Lexicon for Biodiversity Conservation: Unified Classifications of Threats
and Actions. Conservation Biology, 22: 897–911. doi:10.1111/j.1523-1739.2008.00937.x
Scholes R.J., Gill M.J., Costello M.J., Sarantakos G., Walters M. (2017). Working in Networks to Make Biodiversity Data More
Available. In: Walters M, Scholes RJ, editors. Handbook on Biodiversity Observation Networks. Springer Open; 2017. pp.
1–18. doi: 10.1007/978-3-319-27288-7_1
Thomson S.A., Pyle R.L., Ahyong S.T., Alonso-Zarazaga M., Ammirati J., Araya J.F., et al. (2018). Taxonomy based on science is
necessary for global conservation. PLoSBiol 16(3): e2005075. doi.org/10.1371/journal.pbio.2005075
UNEP (2012). A review of barriers to the sharing of biodiversity data and information, with recommendations for eliminating
them. Prepared by the UNEP World Conservation Monitoring Centre. 30p.
Verweij, P., Cormont, A., Hoetjes, P., de Meyer, K., van Bussel, T., Roosenschoon, O., Henkens, R., Schmidt, A., Janssen, S.
(2019). Co-designing a data platform to impact nature policy and management: experiences from the Dutch Caribbean,
Environmental Science & Policy, 100, pp. 13–20.
Wetzel, F.T., et al. (2015). The roles and contributions of Biodiversity Observation Networks (BONs) in better tracking prog-
ress to 2020 biodiversity targets: a European case study. Biodiversity 16(2-3): 137–149.
Wieczorek, J., Bloom, D., Guralnick, R., Blum, S., Döring, M., De Giovanni, R., Robertson, T., Vieglais, D. (2012). Darwin Core: An
Evolving Community-developed Biodiversity Data Standard. PLoS ONE. 7 (1): e29715.
Wilkinson, M., Dumontier, M., Aalbersberg, I. et al. (2016) The FAIR Guiding Principles for scientific data management and
stewardship. Sci Data 3, 160018. doi.org/10.1038/sdata.2016.1887
Acknowledgements and contributions
Thanks to DG-Environment for the input and comments on earlier drafts of the Handbook. In
particular Ute Goerres and Angelika Rubin that directed the study, but also Micheal O’Briain and
Bruno Combal that provided input at various stages.
Events and forums on which the project was presented:
» 4th NATURA 2000 monitoring workshop: remote sensing group (Doñana, 9–11th of April
2019): Carlos Sunyer, Clive Hurford, Alan Brown, Kristijan Civic, Bruno Combal, Sander Much-
er, Ellen Meulman, and all other participants.
» ESP-Conference, science-policy interface (Hannover, Leibniz University Hannover, 21st of
October 2019): EBIND – The contribution of Ecosystem Services science to policy: are we
addressing the right questions? Marta Perez-Soba, Leon Braat, Theo van der Sluis.
» E-BIND Focus Group meeting ‘Evidence-based improvements in the Birds and Habitats Direc-
tives (BHD) implementation: systematic review’ (Brussels, June 2019).
Complete list of organizations consulted along the project
European Environment Agency- Natural capital and Ecosystems, Helmholtz-Centre for Environ-
mental Research (Germany), Spanish Ministry for Ecological Transition, European Bird Census
Council (EuroBird Portal), German Centre for Integrative Biodiversity Research (iDiv) Halle-Je-
na-Leipzig, Foundation for the research on Ethology and Biodiversity (Spain), European Commis-
sion: DG Environment, DG Research and Innovation & Joint Research Centre, Swedish University
of Agricultural Sciences, University of Cantabria: Environmental Hydraulics Institute (Spain),
Technical University of Denmark: National Institute of Aquatic Resources, EUROSITE, University
of Twente (Netherlands), Justus-Liebig University Gießen, Universiteit Antwerp (Belgium), Natu-
urmonumenten (Netherlands), Bulgarian Biodiversity Foundation, University of Patras: Depart-
ment of Environmental And Natural Resources Management (Greece), Infrastructure and Ecology
Network Europe, IMMERSE H2020 Project (Improving Models for Marine Environment Services),
Catalan Ornithological Institute (Spain), BirdLife Europe, EURAC Research Centre (Italy), Flora &
Fauna International, Conservatoires D´Espaces Naturels (France), Research Institute for Nature
& Forest (Belgium).
Other people consulted or contributed (by authors): Dolf de Groot, Carla Grashof-Bokdam, Walter
van Wingerden (†), Chris van Swaay.You can also read