Population Aging, Age Discrimination, and Age Discrimination Protections at the 50th Anniversary of the Age Discrimination in Employment Act - IZA ...
←
→
Page content transcription
If your browser does not render page correctly, please read the page content below
DISCUSSION PAPER SERIES

IZA DP No. 12265

Population Aging, Age Discrimination,
and Age Discrimination Protections
at the 50th Anniversary of the Age
Discrimination in Employment Act
Patrick Button

MARCH 2019
DISCUSSION PAPER SERIES

IZA DP No. 12265

Population Aging, Age Discrimination,
and Age Discrimination Protections
at the 50th Anniversary of the Age
Discrimination in Employment Act
Patrick Button
Tulane University, RAND Corporation and IZA

MARCH 2019

Any opinions expressed in this paper are those of the author(s) and not those of IZA. Research published in this series may
include views on policy, but IZA takes no institutional policy positions. The IZA research network is committed to the IZA
Guiding Principles of Research Integrity.
The IZA Institute of Labor Economics is an independent economic research institute that conducts research in labor economics
and offers evidence-based policy advice on labor market issues. Supported by the Deutsche Post Foundation, IZA runs the
world’s largest network of economists, whose research aims to provide answers to the global labor market challenges of our
time. Our key objective is to build bridges between academic research, policymakers and society.
IZA Discussion Papers often represent preliminary work and are circulated to encourage discussion. Citation of such a paper
should account for its provisional character. A revised version may be available directly from the author.

                                                     ISSN: 2365-9793

                                           IZA – Institute of Labor Economics
Schaumburg-Lippe-Straße 5–9                      Phone: +49-228-3894-0
53113 Bonn, Germany                             Email: publications@iza.org                                    www.iza.org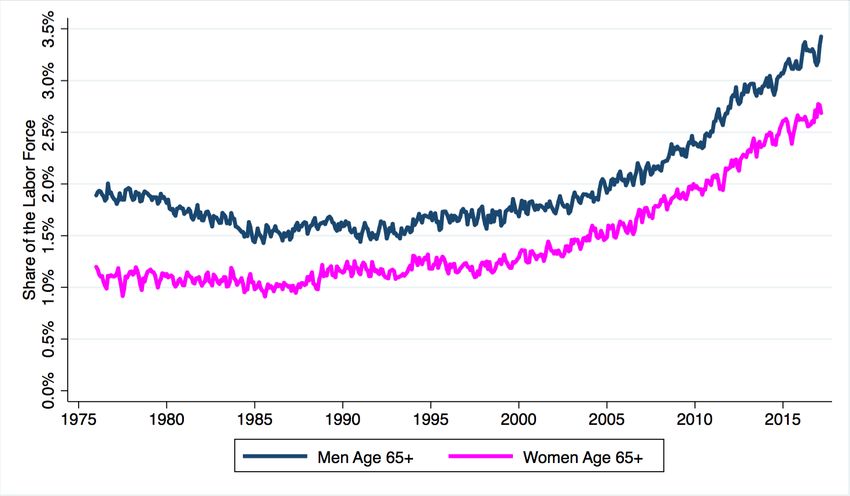
IZA DP No. 12265                                                                                                                      MARCH 2019

            ABSTRACT
            Population Aging, Age Discrimination,
            and Age Discrimination Protections
            at the 50th Anniversary of the Age
            Discrimination in Employment Act1
            This paper discusses population aging, increased participation of seniors in the labor force
            in the United States (and reasons for this), and how these trends are making the struggles
            of older workers in the labor market increasingly relevant. Evidence examining whether
            age discrimination is a barrier for seniors as they try to increase their work lives through
            the common practice of “bridge” jobs is also presented. After discussing the evidence that
            measures age discrimination, economics and legal research that seeks to determine to what
            extent the federal Age Discrimination in Employment Act and state-level age discrimination
            laws prevent age discrimination is discussed. In summary, current evidence indicates that
            age discrimination exists, but more so for older women. While evidence suggests that age
            discrimination laws may help, they cannot resolve the challenges imposed by population
            aging, especially for older women.

            JEL Classification:               J71, J78, J14, K31, J16, J26
            Keywords:                         age discrimination, seniors, age discrimination in employment
                                              act, population aging, discrimination law, older women,
                                              sex-plus-age discrimination, intersectionality

            Corresponding author:
            Patrick Button
            Department of Economics
            Tulane University
            6823 St. Charles Avenue
            New Orleans, LA 70118
            United States
            E-mail: pbutton@tulane.edu

            1
                I thank Sara Czaja, Emmarose Glaser, Raymond Peeler, and Cathy Ventrell-Monsees for helpful comments. I thank
            the National Institutes of Health and the National Institute of Aging for funding through a postdoctoral training grant
            at the RAND Corporation (5T32AG000244-23).
1 Introduction – Population Aging
At the 50th anniversary of the Age Discrimination in Employment Act (ADEA), 2 the
United States is experiencing a rapidly aging population. The share of the population of age 65
and older was 9.0% in 1960 (20.3% for age 45 to 64), and this increased to 13.0% (26.4%) in
2010 (Howden & Meyer, 2011). This trend will continue, as the share of seniors (here defined as
age 65 and older) in the U.S. working-age population is projected to rise sharply—from about
19% currently to 29% in the year 2060—approaching equality with the shares of those aged 25–
44 and 45–64 (Neumark, Burn, & Button, 2017a). This aging population makes issues such as
the employment and financial well-being of seniors increasingly important.
2 The Increased Labor Force Participation of Seniors
In addition to there being more seniors due to the aging population, seniors are
increasingly choosing to work into older ages. Figure 1 presents the labor force participation rate
of men in panel (a) and women in panel (b) for the same three age groups. Men younger than 65,
have experienced slightly decreasing participation since 1975. For men age 65 and older,
participation has increased from 16.5% in March 1985 to 20.2% in March 2017. The changes are
more drastic for older women. While the participation rate of women younger than 65 increased
until 1995 (age 25-44) or 2005 (age 45-64), it has since flat-lined. Meanwhile since about 2000
the participation rate for women aged 65 and older has been rapidly increasing, from 10.0% in
March 2000 to 15.9% in March 2017.
2
For a discussion of the history of the ADEA at its 30 th anniversary, see Eglit (1997).
2Figure 1 Labor force participation rates by age group and sex
(a) Men
(b) Women
Source: Author’s calculations using data from the Current Population Survey (monthly) from 1975 to March 2017,
via IPUMS-CPS (Flood et al., 2015).
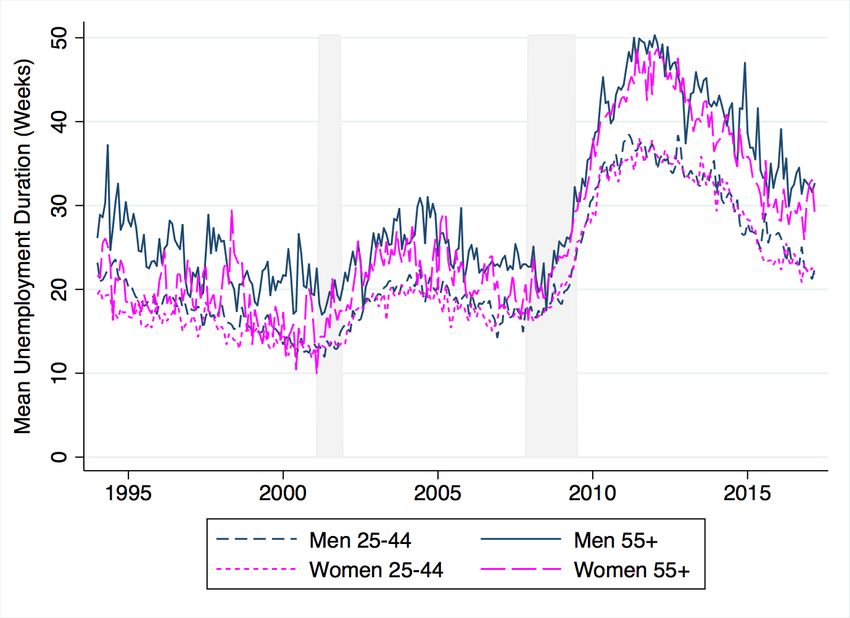
3In addition to there being more seniors due to the aging population, seniors are
increasingly choosing to work into older ages. Figure 2 presents the labor force participation rate
of senior women and men. For senior men, participation increased from 15.9% in 1985 to 24.3%
in 2016, a 52.9% increase. But this increase was much larger proportionately for senior women,
whose labor force participation rate more than doubled from 7.3% to 15.8% during this period.3
Figure 2 Proportion of the labor force by age group and sex
Source: Author’s calculations using data from the Current Population Survey (monthly) from 1975 to March 2017,
via IPUMS-CPS (Flood et al., 2015).
3 Working Longer Through “Bridge” Jobs
A common approach that seniors take to work longer is taking “bridge” jobs or “partial
retirement” jobs (e.g., Johnson et al., 2009), which ease them into a complete retirement.
“Unretirement” is also very common, where seniors leave retirement to take jobs before retiring
again. Nearly 50% of retirees follow a non-traditional retirement path that involves transitioning
to bridge jobs before retirement or involves “un-retirement.” This behavior is usually anticipated
3
These trends may differ by race and race-by-gender. See e.g., Lahey (2018).
4and often is not due to some adverse economic event during retirement (Maestas, 2010). For
these reasons, hiring in these “bridge” jobs remains important as seniors seek to work longer.
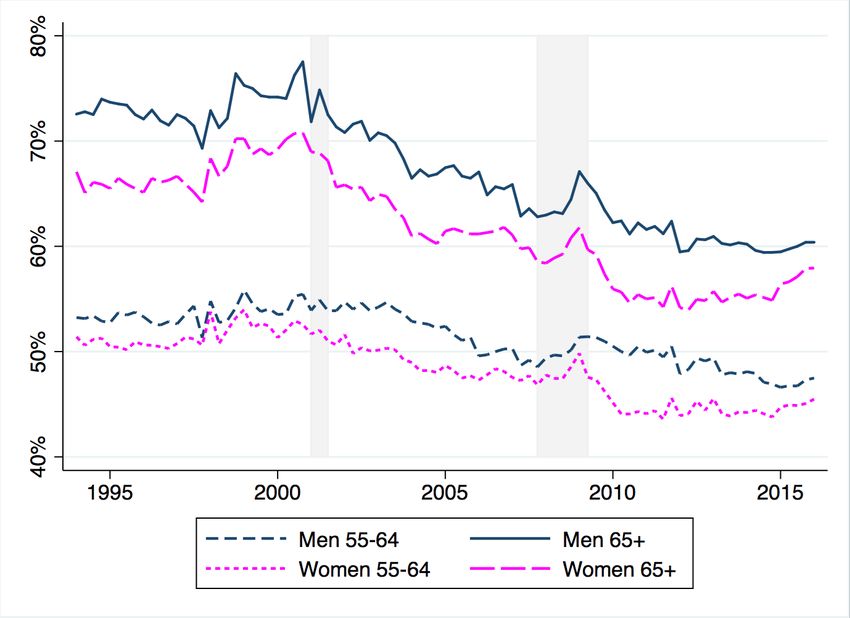
Figure 3 presents the hiring rate of men and women age 55-64 and age 65 and older,
relative to the hiring rate of men age 25-34.4 Both of the older age groups have a lower hiring
rate than that of young men, reflecting that young men move jobs more often and face fewer
obstacles (e.g., age discrimination). Older women also, unsurprisingly, have lower hiring rates.
However, it is notable that the hiring rates of those age 65 and older are higher than for those age
55 to 64, reflecting the importance of these “bridge” jobs. For both of the older age groups and
for both genders, the hiring rate has been declining since about 2000, especially for seniors age
65 and older, perhaps reflecting increased difficulties faced by older workers in the labor market
and the increased difficulties as seniors seek to extend their work lives.5
4 Why are Seniors Working Longer?
Seniors are working longer both due to “push” and “pull” factors. “Pull” include internal,
personal reasons for why seniors prefer to work longer. With each generation being healthier and
living longer, there is more capacity for seniors to work longer (Coile et al., 2017). While the
physical challenges of work are a barrier to many, these barriers are shrinking as the health of
seniors improves and as they identify ways to mitigate these barriers (McLaughlin & Neumark,
2017). This is especially the case for women, who live longer than men and often outlive their
spouses (Maestas, 2018). While some cognitive and physical skills (McLaughlin & Neumark,
2017) decline near retirement age, most do not. This stability in many skills and abilities
contributes to productivity in many common “bridge” jobs (e.g., retail sales, administrative
assistants; see Neumark, Burn, & Button, 2019) being largely unaffected by aging (Belbase et
al., 2015). Many seniors elect to work longer based on preferences, as this allows them to
maintain their sense of identity (Riach & Loretto, 2009) and is associated with improved
physical and mental well-being (Calvo, 2006).
4
The hiring rate is calculated from Quarterly Workforce Indicators (QWI) data as the number of hires divided by
employment for that age group and gender. This is calculated as relative to the hiring rate for men age 25-34. A
value of 50% means that this group has half the hiring rate of men age 25-34.
5
As supporting evidence, Figure 6 shows that mean unemployment durations were also generally increasing for
older workers after 2000.
5Figure 3 Hiring rates by age and gender, relative to men age 25-34
Source: Author’s calculations using data from the National Quarterly Workforce Indicators (NQWI) from 1994Q1
to 2006Q1 (release R2017Q1). Each series is seasonally adjusted by the author using X-13ARIMA-SEATS before
being converted to relative rates. Shaded areas are recessions according to the NBER Business Cycle Dating
Committee.
“Push” factors in working longer include the economic situation and government policies
that push seniors into the labor force rather involuntarily. Even with seniors choosing to work
longer voluntarily, they are increasingly pushed into the labor force because their financial
situation demands it. This is because most seniors cannot fully rely on the combination of Social
Security benefits (Retirement Benefits, Survivor Benefits, Supplemental Security Income),
private pensions, and personal savings to get by after retiring. For this reason, poverty is highly
concentrated among seniors, especially senior women who are single, separated, divorced, or
widowed (Sandall & Iams, 1997). With recent reforms to the Social Security system, discussed
below, the push to get seniors to work is only increasing. The economic benefits to working
6longer are larger for married women, relative to married men, since older women typically have
a shorter work history and less Social Security wealth, making the opportunity cost of earlier
retirement higher for older women (Maestas, 2018).
Age discrimination becomes even more relevant with these increased “push” and “pull”
factors. The ability for seniors to get hired in bridge jobs, and thus to delay retirement, depends
on the extent to which they face age discrimination. Severe age discrimination leads seniors to
become discouraged after being unable to find work, or taking jobs that are a worse match,
earning less or staying at these jobs for less time. An inability for seniors to get bridge jobs
makes poverty even more likely.
4.1 “Carrots” and “Sticks” from Recent Social Security Retirement Benefit Reforms
Recent reforms to the U.S. Social Security system have further pushed seniors into the
labor market to make ends meet, which makes age discrimination even more relevant. Social
Security is crucial for seniors, as it is their primary source of income. However, most do not
receive many benefits relative to their previous earnings. As of 2007, the hypothetical “medium
earner” retiring at 65 receives Social Security Retirement Benefits equal to about 41% of
previous earnings (Munnell & Sass, 2007).
These already low Social Security benefits are even lower now, after the Social Security
Amendments of 1983, which raised at age at which seniors who were born after 1938 can retire
with full Social Security retirement benefits. The full benefits retirement age increased from 65
to between 65 and 70 for cohorts born from 1938 to 1960 based on a graduated scale, with the
full benefits retirement age staying at age 70 for cohorts born in 1960 onwards. This amendment
made it such that retiring at the previous full benefits age of 65 meant a cut in benefits. Table 1
presents the changes in the full retirement year over time, and how benefits decreased for three
possible retirement ages: age 62 (the earliest age for claiming benefits), the former full
retirement age of 65, and the full retirement age that was in effect for each birth year. Figure 4
presents the proportion of full benefits that were available per year for different birth cohorts
retiring at age 65. The cut in benefits from this reform were fairly steep. For example, those born
in 1960 and later and retiring at age 65 receive only 86.7% of what those born in 1937 or earlier
and retiring at age 65 receive annually. This cut in benefits makes it even harder for Social
7Security benefits to make ends meet for seniors, leading seniors to recoup this income in the
labor market if they can get bridge jobs without facing age discrimination.
Table 1 Social Security retirement benefit calculations by year of birth
Proportion of Benefits Received if Retiring at…
Full Retirement
Age 65 Age 62
Age (FRA)
…and you are the...
Full Benefits Wage Wage Wage
Year of Birth Spouse Spouse Spouse
Retirement Age Earner Earner Earner
1937 and earlier 65 100% 50% 100.0% 50.0% 80.0% 37.5%
1938 65 + 2 months 100% 50% 98.9% 49.3% 79.2% 37.1%
1939 65 + 4 months 100% 50% 97.8% 48.6% 78.3% 36.7%
1940 65 + 6 months 100% 50% 96.7% 47.9% 77.5% 36.3%
1941 65 + 8 months 100% 50% 95.6% 47.2% 76.7% 35.8%
1942 65 + 10 months 100% 50% 94.4% 46.5% 75.8% 35.4%
1943-1954 66 100% 50% 93.3% 45.8% 75.0% 35.0%
1955 66 + 2 months 100% 50% 92.2% 45.1% 74.2% 34.6%
1956 66 + 4 months 100% 50% 91.1% 44.4% 73.3% 34.2%
1957 66 + 6 months 100% 50% 90.0% 43.8% 72.5% 33.8%
1958 66 + 8 months 100% 50% 88.9% 43.1% 71.7% 33.3%
1959 66 + 10 months 100% 50% 87.8% 42.4% 70.8% 32.9%
1960 and later 67 100% 50% 86.7% 41.7% 70.0% 32.5%
Source: Social Security’s Retirement Planner, at https://www.ssa.gov/planners/retire/ageincrease.html
This Social Security cut (a “stick”) was combined with another reform (a “carrot”) to
increase the labor supply of seniors. The Senior Citizen’s Freedom to Work Act of 2000 changed
Social Security’s retirement earnings test (RET) with the goal of reducing Social Security benefit
reductions for those who claimed benefits, but also had earnings from work, from the ages of the
full retirement age to age 69. The RET applied a cutoff where any earnings above this level were
essentially taxed, leading to temporary reductions in Social Security benefits. These reduced
benefits were withheld until later, so benefits were not lost but rather transferred to later in life.
Prior to 2000, the RET applied to those who claimed Social Security benefits but also worked
from the ages 62 to age 69. The RET earnings cutoff in 1999 was $15,500 for seniors of age 65
to 69 (Figinski & Neumark, 2018). The RET imposed a larger benefits reduction for those who
worked and claimed Social Security benefits before the full retirement age. Prior to 2000, this
benefits reduction was $1 for every $2 earned above the cutoff during the period from age 62 to
8the full retirement age (then age 65), and was $1 for each $3 earned from the full retirement age
to age 69 (Baum, Hannah, & Ford, 2002; Figinski & Neumark, 2018).
Figure 4 Proportion of full benefits per year for retirement at age 65, by year of birth
Source: Social Security’s Retirement Planner, at https://www.ssa.gov/planners/retire/ageincrease.html (accessed
March 31, 2018).
The Senior Citizen’s Freedom to Work Act of 2000 removed the RET above the full
retirement age, so the $1 for every $3 in earnings benefits reduction was no longer in place for
those collecting benefits and working from the full retirement age to age 69. Also, the act made
the RET less stringent in the full retirement age year (Figinski & Neumark, 2018). Thus, this act
led to an increase in earnings for those claiming but also working from the full retirement age to
age 69. Since the RET was perceived as a tax (Liebmann & Luttmer, 2015) despite not really
being one, this perceived “income tax cut” from the Act led to increased earnings, and perhaps
increased labor supply, for seniors. For example, Song & Manchester (2007) found that this Act
led to increased earnings, with some evidence of increased labor supply. Loughran & Haider
(2007) found even larger responses in earnings and labor supply to the RET.
4.2 Employer-Sponsored Pensions
Many seniors cannot rely on private sector employer-sponsored pensions, as less than
half of the private sector work force age 25 to 64 have an employer-sponsored plan of any type
9(Munnell & Sass, 2007), and only 27.6% of those who stopped working to retire claimed a
pension (Maestas, 2010). Since pension participation rises with earnings, the lack of coverage of
private pensions hits lower income seniors even harder. Even for those with a pension, the
typical pension does not provide much. The Federal Reserve’s 2004 Survey of Consumer
Finances shows that a typical individual approaching retirement had 401(k)/IRA balances of only
$60,000 (Munnell & Sass, 2007; Munnell & Sundén, 2006). Thus, pensions only have a small
role in making ends meet for seniors, leading seniors to stay in or re-enter the labor market.
4.3 Personal Savings
Personal savings are even less likely to help seniors make ends meet during retirement. It
is well established that individuals do not adequately save for retirement. Approximately 30% of
U.S. households where the head of the household is close to retirement have done little or no
retirement planning (Lusardi, 2003). Similarly, only a minority of U.S. households feel
“confident” about the adequacy of their retirement savings (Lusardi & Mitchell, 2005). More
concretely, a study of the U.S. National Income and Product Accounts (NIPA) personal saving
rate found that almost all of the saving undertaken by the working-age population occurred in
pension plans (Munnell et al., 2005). In many recent years, the saving outside of pensions has
actually been negative (Munnell & Sass, 2007). Clearly there is little role for personal savings to
help seniors make ends meet unless current personal savings behavior changes significantly.
4.4 Senior Women and Death of a Spouse
Another “push” factor that primarily affects women is the death of a spouse. Because
women tend to live longer than men, more than half (53.0%) of women aged 65 or older are
separated, divorced, widowed, or never married/single.6 These women cannot rely on
supplementary income from a partner, who is or was often the primary earner. This is a major
factor for why poverty among seniors is particularly concentrated among senior women and
leads to increased pressure to work (Sandall & Iams, 1997), and partially explains the differential
increase in labor force supply for senior women (Figure 1b).
6
Calculated by the author using 2015 data from the Current Population Survey, via IPUMS CPS (Flood et al.,
2015).
105 Is Age Discrimination a Barrier to Working Longer?
Since much of the increased labor force participation of seniors comes from “bridge” or
“partial retirement” jobs, increasing hiring is fundamental to increasing the employment and
financial security of seniors. However, research demonstrates that age discrimination remains a
large barrier for seniors seeking to get hired in these jobs, more so for senior women than for
senior men.
5.1 Non-Experimental Evidence of Age Discrimination
There is ample evidence of age discrimination in hiring. One prominent piece of evidence
is longer unemployment durations for older workers compared to younger workers (see Neumark
& Button, 2014), which partly reflects the increased difficulty that older workers face in the
labor market. There is also industrial psychology research that notes that older workers face
negative stereotypes such as disinterest in building their skills (e.g., Fritzsche & Marcus, 2013), a
lack of ambition (e.g., Bowen & Staudinger, 2013), physical and cognitive health challenges
(e.g., Hummert et al., 1994; Ng & Feldman, 2012), inflexible or abnormal personalities (e.g.,
Fritzsche & Marcus, 2013), and less experience with technology (e.g., AARP, 1999).7 Some
studies also examine worker self-reports of discrimination, which are correlated with adverse
labor market outcomes (Adams, 2002; Johnson & Neumark, 1997).
5.2 Experimental Evidence of Age Discrimination
The most credible studies that quantify age discrimination in hiring are field experiments,
more specifically, resume-correspondence studies (Bertrand & Duflo, 2017; Fix & Struyk, 1993;
Neumark, 2018). These studies create fictitious-but-realistic job applicants (resumes and cover
letters) that are on-average equal except for age, which is signaled through school graduation
year(s). These fictitious job applicants then apply for real job openings. Employers then request
interviews with the candidates by sending an email or leaving a voicemail. Researchers measure
hiring discrimination by comparing interview request rates (“callbacks”) by age.
While it would be ideal to track job offers in resume-correspondence studies, as that is an
exact measure of hiring discrimination, this requires hiring actors and actresses. Not only is this
7
There are also some positive stereotypes, such as older workers being more dependable (e.g., Chiu et al., 2001),
kind (e.g., Fritzsche & Marcus, 2013), and of course, more experienced (Bal et al., 2013).
11costly but it opens up the study to “experimenter effects” (Heckman & Siegelman, 1993). While
comparing interview request rates is only a proxy for hiring, most discrimination occurs at the
interview offer stage (90%), according to studies of ethnic discrimination by the International
Labor Organization (ILO), discussed in Riach & Rich (2002) and Neumark et al. (2019).
This experimental approach controls for all factors but age, which better isolates age
discrimination. An alternative to quantify hiring discrimination is to use survey data to study
hiring rate differences between older and younger workers. The difficulty with this approach is
that it is not possible to make older and younger workers identical, even if regression control is
used to set factors such as education, occupation, and geography constant. This problem is
avoided by using an experimental method.
Previous resume-correspondence studies almost always point to substantial age
discrimination in hiring (Baert et al., 2016; Bendick et al., 1997; Bendick et al., 1999; Carlsson
& Eriksson, forthcoming; Lahey, 2008b; Riach & Rich, 2006, 2010). However, a difficulty in
these studies comes from making older job applicants on-average identical to the younger job
applicants. Older workers generally have much more experience, so if the resumes of older and
younger workers are made to be the same, then this could overestimate age discrimination. Also,
previous studies did not focus on those near traditional retirement ages, which is the group for
which age discrimination matters most in terms of population aging and strain on the Social
Security system.
5.3 The Neumark, Burn, and Button (2019) Resume-Correspondence Study
Partly to better confront these issues, and to provide more detailed and accurate evidence
of age discrimination, Neumark et al. (2019) conducted the largest and most comprehensive
resume-correspondence study of age discrimination in hiring. They created realistic but fictitious
resumes for young (aged 29-31), middle-aged (aged 49-51), and senior (aged 64-66) job
applicants. Workers age 64-65 age group are new to the literature and is motivated by the
common occurrence of “bridge” jobs for this age group.
In this experiment, they sent over 40,000 applications (resumes) to over 13,000 job
positions in 12 cities spread across 11 states, by far the largest resume-correspondence study of
hiring discrimination to date. They sent applications for positions that seniors often take as
“bridge” jobs, according to Current Population Survey data: administrative assistant and retail
12sales for women, and retail sales, security, and janitor for men. These positions are also common
for younger workers. While their resumes were generally on-average identical to isolate the
effect of age, they sent different types of senior resumes: some with the same experience on-
average as the younger applicants, and many where the senior had a longer work experience
commensurate with their age. As in other studies, they tracked callbacks – interview requests or
other similar positive responses from employers – and compared the callback rates by age.
Figure 5 Comparisons of job applicant callback rates by age
Source: Neumark et al. (2017a), using data from Neumark et al. (2019).
Figure 5 presents the main results from Neumark et al. (2019). Across all occupations and
genders, senior applicants (age 64-66) got fewer callbacks than younger applicants. These
differences are statistically significant in all cases except for security jobs (men). The evidence is
more mixed for middle-aged applicants (age 49-51), as female middle-aged applicants have a
statistically significant lower callback rate, but there is no evidence of discrimination against
middle-aged men.
Even in the cases where both senior women and men face age discrimination, the
magnitude of the discrimination against senior women is much larger. For administrative
13assistant positions, the callback rate is nearly half for senior women (7.58%) compared to
younger women (14.41%). For retail sales, senior women get callbacks 18.43% of the time while
younger women get callbacks 28.68% of the time. These differences are less pronounced for
senior men. In retail sales, where they apply with both male and female applicants, the age
penalty is larger for senior women (35.7% fewer callbacks) than it is for senior men (29.6%).
Thus, while they find age discrimination against senior men, it is concentrated in those near
traditional retirement ages and does not occur in every occupation. This evidence is also not
robust to other checks of the data (Neumark et al., 2016). For senior women, the discrimination
is more severe and starts much earlier than it does for senior men.
6 Can Stronger Age Discrimination Laws Help Reduce Age Discrimination?
Age discrimination laws are the key approaches used to reduce age discrimination in
employment. There is, of course, the federal Age Discrimination in Employment Act (ADEA),
but there are also state laws in all states (plus the District of Columbia) except Arkansas,
Mississippi, and South Dakota. Some states even have features of their laws that make them
broader or stronger than the federal law (Neumark et al., 2018; 2017b; Neumark & Song, 2013),
which provide additional protections against age discrimination.
6.1 Evidence from Theory
At first blush, one would expect that laws forbidding discrimination would reduce
discrimination, and thus improve labor market outcomes for protected individuals. However,
theory suggests that this may not necessarily be the case. Discrimination laws should reduce
terminations because terminating an employee, whether there is discriminatory intent or not,
opens firms up to possible legal action. Because it is harder under discrimination laws to
terminate older workers, it creates a disincentive to hire them in the first place (Bloch, 1994).
This could lead to the unintended consequence of decreased hiring.
Of course, discrimination laws forbid discrimination in hiring, so they could still decrease
hiring discrimination if employers follow this aspect of the law. Enforcement to curtail hiring
discrimination is more difficult than other types of anti-discrimination enforcement, however,
because it is harder to prove or identify a class of affected workers. For example, with most of
the discrimination occurring at the interview offer phase (Riach & Rich, 2002), it is almost
14impossible to prove that age discrimination is the reason for a lack of interview. Economic
damages are generally much smaller in hiring discrimination cases relative to terminations,
which leads to hiring cases being less attractive to plaintiffs and attorneys. This means that laws
forbidding discrimination in hiring have little bite, which could mean that the negative hiring
incentive dominates. But in net, it is difficult to know the effect of discrimination laws on hiring,
and thus on employment.
6.2 Evidence from the Empirical Literature
Economists have long studied the effects of discrimination laws on the employment
outcomes of protected workers. The most common approach that these studies employ is a
statistical analysis strategy called a “difference-in-differences,” which tries to isolate the effect of
the law on labor market outcomes. Most of these difference-in-differences studies compare older
workers before and after a change in discrimination law (e.g., introduction of the ADEA or
changes in state laws) compared to the same before and after change for some unaffected control
group, such as younger workers or older workers in states without legal changes, or both. Most
studies of age discrimination laws have found positive effects of the laws, while some have
found no effects or negative effects.
Most of these “difference-in-differences” studies use the passage of state age
discrimination laws before the passage of the ADEA to explore if the introduction of these laws
affected employment for older workers. Neumark & Stock (1999) found that state-level age
discrimination laws passed before the ADEA in addition to the passage of the ADEA in 1968 led
to increased employment for protected older workers. Adams (2004) found a similar result using
the state laws passed before the ADEA.
Other studies focus not just on the introduction of laws but rather on how features of the
laws differ. Lahey (2008a) finds that some features of age discrimination laws are associated
with decreased hiring of older workers. Lahey (2008a) explores how the employment effects
stemming from the introduction of the ADEA were mediated by existing state-level age
discrimination laws. Lahey (2008a) argues that the ADEA was stronger in states with an existing
law, noting that the statute of limitations under the ADEA is 300 days if the state has a fair
employment protection agency, whereas it is 180 days otherwise. Lahey (2008a) also argues that
fair employment protection agencies in these states may be able to process claims more quickly
15than the EEOC. Lahey (2008a) finds that these increased legal protections lead to a decrease in
employment, hiring, and an increase in retirement. However, Neumark (2009) disputes these
results for several reasons, and argues rather that the results show that the introduction of the
federal ADEA boosted employment of older workers in states without existing age
discrimination laws.
Neumark & Song (2013) explore the effect of state age discrimination laws that had
features that made them stronger or broader than the ADEA. They study older men “caught” by
the increase in Social Security’s full retirement age, which meant that the men had to work
longer before they could retire with full Social Security benefits. They compared “caught” older
men to older men who were not caught, in states with and without these stronger law features.
They classified states as having stronger laws if (1) the state law allows for compensatory or
punitive damages (“larger damages”), which provides for larger damages than the ADEA,8 (2)
the federal ADEA applies to employers with at least 20 employees, but some state laws apply to
employers with fewer employees (“lower firm size”), and (3) if the state law has a longer statute
of limitations than the ADEA.9 They found that larger damages and lower firm size both
increased hiring of older workers, with the statute of limitations having little effect.
Neumark et al. (2018) use a unique approach to examine how these state law features
(“larger damages” and “lower firm size”) affect hiring of older workers. They follow the resume-
correspondence approach of Neumark et al. (2019), creating on-average identical resumes for
older (age 65) and younger (age 30) workers of both genders in retail sales. They then send these
resumes (older men, older women, younger men, younger women) to job openings in all 50
states and compare callback rates between older and younger workers in states with stronger
laws compared to in states with weaker laws. This approach provides direct evidence of
discrimination in hiring and helps control for other factors, such as older and younger workers
being different. They find evidence that some features of stronger discrimination laws (namely
“larger damages”, meaning plaintiffs can sue for more damages) reduce age discrimination.
8
To be more specific, compensatory and punitive damages are not allowed under the ADEA, but “liquidated
damages” are those which are available up to the amount of back pay for a willful violation of the ADEA. A
violation is willful when an employer either knew it engaged in illegal conduct under the ADEA or the employer
showed “reckless disregard” for whether it was prohibited. See
https://www.americanbar.org/content/dam/aba/administrative/labor_law/meetings/2011/annualmeeting/004.authc
heckdam.pdf. Neumark & Song (2013) classify states as having larger damages than the ADEA if they allow
compensatory or punitive damages, regardless of if they require proof of intent or willful violation.
9
The filing period for the ADEA for states without a law is 180 days, but is 300 days for states with a state law and
enforcement agency.
16Otherwise they find no effects of the laws, and no find no evidence that stronger or broader laws
reduce hiring. It is important to note that while their study only sometimes finds that broader or
stronger state laws reduce age discrimination in hiring, their study may not capture other possible
positive effects of these laws, such as increased labor market participation of older workers.
7 Challenges to Age Discrimination Laws
While the research suggests – but is not definitive – that age discrimination protections
may help improve labor market outcomes for seniors, the ability for age discrimination
protections to be effective at this is challenged by recessions, where the laws may become less
effective, by recent court decisions, and by legal quirks that lead the ADEA to inadequately
cover older women and older people of color.
7.1 Age Discrimination Laws and the Great Recession
One consideration for discrimination laws is how they operate over the business cycle.
Research indicates that discrimination tends to increase during a recession (Baert et al., 2013;
Johnston & Lordan, 2015; Kroft et al., 2013). Therefore, it is important to know if age
discrimination laws are still effective during recessions, when they are likely needed the most,
compared to during economic expansions. This is a timely question, given the recent Great
Recession from December 2007 to June 2009,10 which was especially devastating for older
workers, who faced decreased income (Davis & von Wachter, 2011), wealth, and significantly
more job loss (Munnell & Rutledge, 2013), and thus increased Social Security benefit claiming
(Mueller et al., 2016; Munnell & Rutledge, 2013; Rutledge, 2012; Rutledge & Coe, 2012). There
was significant anecdotal evidence, especially in the media, of age discrimination both during the
Great Recession and during the long recovery,11 and ADEA claims filed with the EEOC
increased significantly during this period, rising from about 16,000 in 2006 to about 23,000 in
each year from 2008 to 2012 (Neumark & Button, 2014).
This impact is mirrored in the dramatic increase in unemployment durations for older
workers during and after the Great Recession. Figure 6 shows the mean unemployment duration
10
These are the dates of the Great Recession as determined by the National Bureau of Economic Research (NBER)
Business Cycle Dating Committee. See http://www.nber.org/cycles.html
11
See, e.g., http://www.pbs.org/newshour/bb/women-over-50-help-not-wanted/,
http://www.npr.org/2017/03/24/521266749/too-much-experience-to-be-hired-some-older-americans-face-age-
bias, and http://www.cbsnews.com/news/age-discrimination-is-alive-and-well/
17(in weeks) since 1994 by age and gender. Older workers consistently have higher unemployment
durations, which reflects both age discrimination but also the fact that older workers are pickier
about jobs. The gap in average unemployment durations by age increased significantly after the
Great Recession. The gap was the smallest in the year before the Great Recession (2007), about
6.2 weeks longer for older men and 1.4 weeks longer for older women, peaking in 2012 at 11.7
weeks and 10.7 weeks longer for older men and older women, respectively.12
Figure 6 Effects of the Great Recession on mean unemployment duration, in weeks
Source: Author’s calculations using data from the Current Population Survey (monthly) from 1994 to March 2017,
via IPUMS-CPS (Flood et al., 2015). Each series is seasonally adjusted by the author using X-13ARIMA-SEATS.
Shaded areas are recessions according to the NBER Business Cycle Dating Committee.
Motivated by the severity of the Great Recession, Neumark & Button (2014) explored
whether age discrimination laws helped protect older workers during this difficult time. They
12
The author’s calculations for this, using Current Population Survey data, are available upon request. Note that the
effect of recessions on unemployment durations typically take a few years to materialize, hence the 2012 peak.
18focused on whether state age discrimination laws that were stronger or broader than the federal
ADEA helped older workers. The focus was on “larger damages” and “lower firm size” as
defined in Neumark & Song (2013). The findings provide mixed evidence suggesting that the
effect of age discrimination laws may vary over the business cycle, with them possibly being
more helpful in non-recessionary periods but of mixed and often negative impact during and
after the recent Great Recession.
7.2 Recent Court Cases Weakening the ADEA
Recent legal changes have significantly weakened the coverage and strength of the
ADEA. In 2009, the Supreme Court Case Gross vs. FBL Financial Services Inc.13 significantly
weakened the ADEA (Lazarus, 2012). The case removed one way that plaintiffs would
previously prove their age discrimination case. Since Gross, plaintiffs in age discrimination cases
must prove, by preponderance of evidence, that age was the “but for” cause for the adverse
employment action.14 That is, discrimination must have been the determining reason for the
adverse employment action, not just one reason among others (the “mixed-motive” framework,15
now no longer allowed; Van Ostrand, 2010). This change increased the burden on the plaintiff to
make a prima facie case of discrimination, meaning that they could not establish that age
discrimination might have occurred, which meant that cases could not proceed. Many argue that
Gross radically weakened the ADEA (e.g., Harper, 2010; Lazarus, 2012; Noonan, 2010; Van
Ostrand, 2009), and under Gross, the ADEA is significantly weaker than other similar
discrimination laws, such as Title VII of the Civil Rights Act (McCann, 2018).
Another concerning case was from the U.S. Court of Appeals for the 7th circuit (Kleber v.
CareFusion Corp., No. 17-1206 (7th Cir. 2019)), decided January 23, 2019. In Kleber, the
plaintiff sued for age discrimination in hiring after being passed up in favor of a less-experienced
younger worker for a senior in-house position at CareFusion Corporation’s law department. It
appears that the employer was intentionally trying to screen out older or more experienced
applicants by including the request “3 to 7 years (no more than 7 years) of relevant legal
13
557 U.S. 167 (2009), Decided June 18, 2009.
14
“But for” the discrimination, the adverse employment action would not have happened. See
http://www.constangy.com/communications-247.html (accessed June 5, 2017) for useful discussion.
15
Under “mixed-motive” the jury is instructed to rule for the plaintiff if they determine that the protected class was a
motivating factor, even if other (legal) factors were also present. See Price Waterhouse v. Hopkins, 490 U.S. 228
(1989).
19experience” in the job advertisement. The court ruled that Section 4(a)(2) of the ADEA did not
authorize job applicants to bring a disparate impact claim against a prospective employer. This
was based on the belief that the “plain language” of the ADEA showed that Congress intended
that law to cover current employees, not job applicants.
This decision could have big implications. If disparate impact claims are not allowed for
job candidates, then employers are legally able to discriminate in hiring by filtering older
workers out of the applicant pool. Employers could do this (and have done this) by posting job
advertisements with ageist language to discourage older applicants,16 putting experience or time-
since-graduation restrictions on job applicants,17 posting job ads only in ways where the job ad is
more likely to be seen by younger people,18 or using job candidate evaluation methods that favor
younger applicants. Since this was a decision of a circuit court, it may be more contained to
Illinois, Indiana, and Wisconsin. However, this decision could be appealed to the Supreme Court,
although the current make-up of the court may not be favorable to keeping discrimination laws
intact.
7.3 Intersectional “Sex-Plus-Age” Discrimination
Given that age discrimination is stronger against women than men (Neumark et al.,
2019), intersectional discrimination – that is discrimination at the intersection of age and gender
– may be relevant. If age discrimination against older women is primarily intersectional, that is,
16
Employers could use language that is suggestive that they want younger workers. This could be leveraging age-
related stereotypes, requesting a candidate who is more flexible, able to learn, energetic, or better with technology,
which are stereotypes associated with younger workers (relative to older workers) in the industrial psychology
literature (e.g., Posthuma & Campion, 2007; Burn et al., 2019). While these requests could be well-intentioned, as
they are related to productivity on the job, employers could also use this strategy to intentionally filter out older
workers. More aggressive examples are phrases such as “digital native”, which suggests that the ideal candidate
“grew up” with technology. See, e.g., http://fortune.com/2015/05/04/digital-native-employers-bias/ (accessed
March 29, 2019).
17
In addition to this happening in Kleber it seems common, especially in the tech industry. Other ways this is
phrased in job advertisements includes “Class of 2007 or 2008 preferred” (from a Facebook job advertisement), or
numerous tech companies specifically requesting a “new grad”. See, e.g., http://fortune.com/2015/05/04/digital-
native-employers-bias/ (accessed March 29, 2019).
18
This could include searching for candidates only through job fairs hosted by educational institutions or posting the
job ad only in venues that younger people use, such as social media websites, or using the tools of social media
websites to only advertise job postings to younger candidates, either directly or indirectly. Many social media
websites and tech companies allowed targeting based on age. See https://www.reuters.com/article/us-facebook-
lawsuit-discrimination/facebook-ads-that-let-employers-target-younger-workers-focus-of-u-s-lawsuit-
idUSKBN1EF09B (accessed March 29, 2019). This appears to be changing, as Facebook no longer allows age,
gender, or ZIP Code targeting for housing, employment and credit-related advertisements. See
https://www.wsj.com/articles/facebook-axes-age-gender-and-other-targeting-for-some-sensitive-ads-
11553018450 (accessed March 20, 2019).
20they are not discriminated against for just being female or just being old but by being old and
female, then the ADEA provides limited protection for this “sex-plus-age” discrimination (Day,
2014).
For older women to be protected from this intersectional discrimination, they must use
both the ADEA and Title VII of the Civil Rights Act, recognizing older women as a subgroup of
two protected classes. However, in practice, courts generally do not allow this joint use of legal
precedence (Crocette, 1998; Day, 2014; Porter, 2003; McLaughlin, 2018)19 although some have
allowed it.20 Meanwhile, intersectional claims that fall under the same statute (e.g., race and
gender, both under Title VII) are generally accepted by courts (Day, 2014).21 This odd quirk
seems to stem from the mere fact that the ADEA is a separate statute.
Moreover, sex-plus-age claims are more difficult to make since the Gross v. FBL
Financial Services, Inc. Supreme Court decision. Day (2014) argues that the Gross decision will
likely create a “chilling effect” as to the initiation of sex-plus-age claims, and older women
would be dissuaded from bringing the claim under the ADEA because they cannot use the
mixed-motives framework.
Given all this, an open question is the extent to which age discrimination laws protect
older women from discrimination. All the studies of age discrimination laws discussed above
estimated the effect on men only, except Neumark & Button (2014) and Neumark et al. (2018)
who analyzed men and women separately. Based on these two studies, there are mixed effects of
the laws. Larger damages under state law are associated with shorter unemployment durations
for older workers before the Great Recession, but decreased hiring during and after (Neumark &
19
Case law showing that this is not allowed includes Thompson v. Mississippi State Personnel Board, 674 F. Supp.
198 (N.D. Miss 1987), Murdock v. B.F. Goodrich, 1992 Ohio App. LEXIS 6611, and Sherman v. American
Cyanamid Company, 1999 U.S. App. LEXIS 21086. See McLaughlin (2018) for a discussion of these cases.
Ventrell-Monsees (2014) also lists Johnson v. Napolitano, 2013 WL 1285164 *8 (S.D.N.Y., 2013) which cited
“Cartee v. Wilbur Smith Associates, Inc., No. 3:08-4132-JFAPJG, 2010 WL 1052082, at *4 (D.S.C. Mar 22,
2010); Block-Victor v. CITG Promotions, L.L.C., 665 F. Supp. 2d 797, 808 (E.D. Mich. Oct 13, 2009); Smith v.
Board of County Com'rs of Johnson County, Kan., 96 F. Supp. 2d 1177, 1187 (D. Kan.,2000) (collecting
cases); Luce v. Dalton, 166 F.R.D. 457, 461 (S.D. Cal. 1996); see also Kelly v. Drexel University, 907 F. Supp.
864, 875 n. 8 (E.D. Pa. 1995).”
20
Some courts have recognized intersectional discrimination, such as Arnett v. Aspin, 846 F. Supp. 1234, 1241 (E.D.
Pa. 1994), Grozynski v. JetBlue Airways Corp., 596 F.3d 93, 109 (2d Cir. 2010), Barnett v. PA Consulting Group,
715 F.3d 354 (D.C. Cir. 2013), DeAngelo v. Dental EZ, Inc., 738 F. Supp. 2d 572-578-79 (E.D. Pa. 2010), Good
v. U.S. West Communications, 1995 WL 67672 (D. Or. 1995), Sogg v. American Airlines, 603 N.Y.S.2d 21 (NY
App. 1993), and Foley v. Eckhart Richard-Allan Med. Inbus., 1995 U.S. Dist. LEXIS 20663 (C.D. Cal., Nov. 14,
1995), all discussed by Ventrell-Monsees (2014).
21
For the first notable case (black women), see Jefferies v. Harris Cnty. Cmty. Action Ass'n, 615 F.2d 1025, 1034
(5th Cir. 1980). For Asian women, see Lam v. Univ. of Haw., 40 F.3d 1551, 1562 (9th Cir. 1994).
21Button, 2014). A lower firm-size minimum under state law is associated somewhat with lower
employment of older women after the Great Recession (Neumark & Button, 2014) but with no
difference in hiring in their recent resume-correspondence experiment (Neumark et al., 2018).
Luckily, a study by McLaughlin (2018) fills this gap by estimating the effect of state age
discrimination laws passed before the ADEA, and the passage of the ADEA on employment
outcomes for older women (similar to Adams, 2004, and Neumark & Stock, 1999). McLaughlin
(2018) finds that while both state-level age discrimination laws and the ADEA helped older men,
they either had a smaller positive effect for older women or no effect at all. This suggests that the
ADEA and similar laws are less effective at protecting older women, likely because of the
intersectionality issue.
Moreover, sex-plus-age claims are more difficult to make since the Gross v. FBL
Financial Services, Inc. Supreme Court decision. Day (2014) argues that the Gross decision will
likely create a “chilling effect” as to the initiation of sex-plus-age claims, and older women
would be dissuaded from bringing the claim under the ADEA because they cannot use the
mixed-motives framework.
7.4 Other Intersectional Age Discrimination
It is also likely that current discrimination laws do not adequately cover other types of
intersectional age discrimination. Little is known about age discrimination that intersects with
other factors, namely race and ethnicity.22 This is largely because previous work either does not
study intersectionality, studying older individuals as a whole without doing an analysis by sub-
groups or because researchers look specifically at Whites in order to isolate (non-intersectional)
age discrimination (e.g., Lahey, 2008a). To my knowledge, all the resume-correspondence
studies of age discrimination also used names that were likely to be assumed to be White (or at
least did not signal race or ethnicity) meaning these studies cannot speak to if age discrimination
differs by race or ethnicity.
Lahey & Oxley (2018) is one of the first studies to study this intersectionality. Lahey &
Oxley (2018) conducted a lab experiment to quantify discrimination at the intersection of age,
gender, and race. They had students in business and related fields rate resumes and select
22
There is, however, a growing literature on how disability discrimination laws protect older workers (Stock and
Beegle, 2004; Neumark, Song, & Button 2017; Neumark et al. 2018; Button & Khan, 2019).
22candidates for interviews, all while being monitored with a non-intrusive eye-tracker. The eye-
tracker allowed the researchers to see the mechanisms behind discrimination and learn more how
individuals treat resumes. Lahey & Oxley (2018) find weak evidence of discrimination in favor
of middle-aged Black workers, relative to middle-aged White workers. However, they find
intersectional discrimination against Black seniors, relative to White seniors, mirroring the
evidence of intersectional discrimination against older women. This additional age
discrimination against Blacks is a further barrier to extending work lives, further exacerbating
racial economic disparities in old age (Emmons & Noeth, 2014).
This intersectional discrimination could similarly fall between the cracks of the ADEA
and Title VII of the Civil Rights Act, an issue discussed in-depth in Delaney & Lahey (2019).
Delaney & Lahey (2019) also note that the implications of Gross apply here, making
intersectional age-by-race claims even more difficult to make. This issue is even more dire for
Black older women who may experience intersectional discrimination on the basis of the
combination of age, race, and gender.
8 Conclusion
The United States is experiencing an aging population that is increasingly trying to work
longer into what would be normally considered typical retirement ages, leading to a more than a
doubling of the proportion of the labor force that are seniors in the last 20 years (2.9% to 6.1%).
Working longer is important to many seniors and is fundamental as they seek to support
themselves financially, especially given recent Social Security reforms. Given this, a key policy
question is to what extent seniors face age discrimination, and if age discrimination laws help
remedy this.
The research summarized in this paper suggests that age discrimination against seniors,
especially, is still common, even under the federal Age Discrimination in Employment Act and
similar state laws. Age discrimination was much higher during and after the Great Recession, as
evidenced by increased EEOC claims, huge increases in unemployment durations for older
workers and a flurry of media discussions of age discrimination (Neumark & Button, 2014).
Research on the impacts of age discrimination laws on employment of older workers generally
suggests that these laws are helpful (Adams, 2004; Neumark & Song, 2013; Neumark & Stock,
1999), although they could be harmful (Lahey, 2008a) and are likely less effective during
23economic downturns such as the Great Recession (Neumark & Button, 2014). Regardless, the
ADEA’s coverage was restricted in 2009 in the Gross v. FBL Financial Services Supreme Court
decision.
There is a major gender element to age discrimination and age discrimination protections.
Age discrimination hits older women at younger ages (at least age 50), and for seniors, age
discrimination against women is much more severe (Neumark et al., 2019). Thus, “sex-plus-age”
intersectional discrimination is a verified problem. Meanwhile, “sex-plus-age” discrimination
cases are generally not being allowed under the ADEA and Title VII of the Civil Rights Act
(Crocette, 1998; Day, 2014; Porter, 2003; McLaughlin, 2018), while other intersectional cases
are allowed (e.g., race and gender) simply because they both fall under the same statute. The lack
of discriminatory protections for older women may be behind the more severe age discrimination
that they face, and may also explain the fact that the laws seem less likely to help them
(McLaughlin, 2018).
At the 50th anniversary of the ADEA, it is clear that age discrimination persists in spite of
the law, and that the challenges of population remain. Thus, policy responses are necessary to
address this issue, which are becoming increasingly relevant. Policy responses should consider
how policies and laws affect senior women specifically, as the gendered nature of age
discrimination and age discrimination law cannot be ignored.
Future research can help us determine which policies or laws can better allow seniors to
keep working by reducing discriminatory barriers to seniors taking bridge jobs. For example,
which features of age discrimination laws best reduce hiring discrimination? Are age
discrimination laws becoming more or less effective in an age of online and social media-based
job posting and recruitment, computerized evaluation of job candidates, and technological
growth? Another impactful avenue for future research is if age discrimination occurs even before
the hiring stage. This could be in where the job ad is posted (e.g., on social media rather than
common job search websites), how the job is described (e.g., using language that may suggest an
age preference), or in the application process itself (e.g., the online job application system
requires that applicants enter high school and college graduation years.) Despite it being the 50 th
anniversary of the ADEA, there is still much more to know about age discrimination and the
effectiveness of age discrimination laws. Future research on age discrimination is crucial in our
endeavor to support seniors and the Social Security system as our population ages.
24References
AARP. (1999). American business and older employees. AARP: Washington, DC.
Adams, S. J. (2004). Age discrimination legislation and the employment of older workers.”
Labour Economics, 11(2), 219-241. doi:10.1016/j.labeco.2003.06.001
Adams, S. J. (2002). Passed over for promotion because of age: An empirical analysis of the
consequences. Journal of Labor Research, 23(3), 447-461. doi:10.1007/s12122-002-
1046-y
Baert, S, Cockx, B., Gheyle, N., & Vandamme, C. (2013, January). Do employers discriminate
less if vacancies are difficult to fill? Evidence from a field experiment. IZA Discussion
Paper No. 7145. Retrieved from http://ftp.iza.org/dp7145.pdf
Baert, S., Norga, J., Thuy, Y., & Van Hecke, M. (2016). Getting grey hairs in the labour market.
An alternative experiment on age discrimination. Journal of Economic Psychology, 77,
86–101. doi:10.1016/j.joep.2016.10.002
Bal, P. M., de Lange, A. H., Van der Heijden, B. I. M., Zacher, H., Oderkerk, F. A., & Otten, S.
(2015). Young at heart, old at work? Relations between age, (meta-)stereotypes, self-
categorization, and retirement attitudes. Journal of Vocational Behavior, 91, 35–45.
doi:10.1016/j.jvb.2015.09.002
Bendick Jr., M., Brown, L. E., & Wall, K. (1999). No foot in the door: An experimental study of
employment discrimination against older workers. Journal of Aging & Social Policy,
10(4), 5-23. doi:10.1300/j031v10n04_02
Bendick Jr., M., Jackson, C. W., & Romero, J. H. (1997). Employment discrimination against
older workers: An experimental study of hiring practices. Journal of Aging & Social
Policy, 8(4), 25-46. doi:10.1300/j031v08n04_03
Belbase, A., Sanzenbacher, G. T., & Gillis, C. M. (2015, September). Does age-related decline in
ability correspond with retirement age? Boston College Center for Retirement Research
Working Paper #2015-24.
Bertrand, M., & Duflo, E. (2017). Field experiments on discrimination. In A. V. Banerjee & E.
Duflo (Eds.), Handbook of economic field experiments (Vol. 1, pp. 309-393).
Amsterdam: North-Holland.
Bloch, F. (1994). Antidiscrimination law and minority employment: Recruitment practices and
regulatory constraints. Chicago: University of Chicago Press.
Bowen, C. E., & Staudinger, U. M. (2013). Relationship between age and promotion orientation
depends on perceived older worker stereotypes. Journals of Gerontology - Series B
Psychological Sciences and Social Sciences, 68(1), 59–63.
doi:10.1093/geronb/gbs060Burn, I., Button, P., Munguia Corella, L., & Neumark, D.
(2019). Ageist Language in Job Ads and Age Discrimination in Hiring: Evidence from a
Field Experiments. Working Paper
Button, P., & Khan, M. R. (2018). Do Stronger Employment Discrimination Protections
Decrease Reliance on Social Security Disability Insurance? Evidence from the Social
Security Reforms. Working Paper.
25You can also read