KBC Group / Bank Debt presentation February 2021 - More infomation: www.kbc.com KBC Group - Investor Relations Office - E-mail
←
→
Page content transcription
If your browser does not render page correctly, please read the page content below

KBC Group / Bank
  Debt presentation
  February 2021

More infomation: www.kbc.com
KBC Group - Investor Relations Office – E-mail: IR4U@kbc.be
                                                              1
Important information for investors
This presentation is provided for information purposes only. It does not constitute an offer to sell or the solicitation to buy any
security issued by the KBC Group.
KBC believes that this presentation is reliable, although some information is condensed and therefore incomplete. KBC cannot be
held liable for any loss or damage resulting from the use of the information.
This presentation contains non-IFRS information and forward-looking statements with respect to the strategy, earnings and capital
trends of KBC, involving numerous assumptions and uncertainties. There is a risk that these statements may not be fulfilled and
that future developments differ materially. Moreover, KBC does not undertake any obligation to update the presentation in line
with new developments.
By reading this presentation, each investor is deemed to represent that it possesses sufficient expertise to understand the risks
involved.
2
KBC Passport
Well-defined core markets
Market share
(end 2020) BE CZ SK HU BG IRL
19% 21%
12% 11% 10% 8%
*
Loans and deposits
3.7m clients 4.2m clients
476 branches 28%
212 branches 23%
18%
103bn EUR loans 29bn EUR loans 12% 13%
135bn EUR dep. Investment funds
42bn EUR dep.
IRELAND 28%
0.8m clients
175 branches Life insurance 13% 8% 3% 3%
9bn EUR loans
BELGIUM
9bn EUR dep.
9% 9% 8% 10%
CZECH REP Non-life insurance 4%
0.3m clients SLOVAKIA
12 branches
10bn EUR loans HUNGARY Real GDP
5bn EUR dep. growth BE CZ SK HU BG IRL
1.6m clients 62%
204 branches
% of Assets 21%
5bn EUR loans 3% 3% 2% 4%
9bn EUR dep.
2.5%
BULGARIA 2020
-6.5% -6.8% -6.0% -5.0%
-7.4%
1.4m clients 4.2% 3.5% 4.0%
2.7% 3.0%
175 branches 2021e 0.9%
4bn EUR loans
Internat
Belgium Czech
ional 5bn EUR dep. 4.1% 5.0% 4.2% 4.8% 4.0% 4.0%
Business Republic
Markets
Unit Business 2022e
Business
Unit
Unit
GDP growth: KBC data, Dec ‘20
3
* Retail segment
KBC Passport
Group’s legal structure and issuer of debt instruments
KBC Group NV
AT 1
Tier 2 MREL
Senior
100% 100%
KBC Bank* KBC Insurance
Covered bond No public issuance
KBC IFIMA**
Retail and Wholesale EMTN
* End of April 2019 the opportunity was taken to simplify the shareholders’ structure of KBC AM, the shares of KBC AM held by KBC Group NV (48%) shifted to KBC Bank
** All debt obligations of KBC IFIMA are unconditionally and irrevocably guaranteed by KBC Bank.
4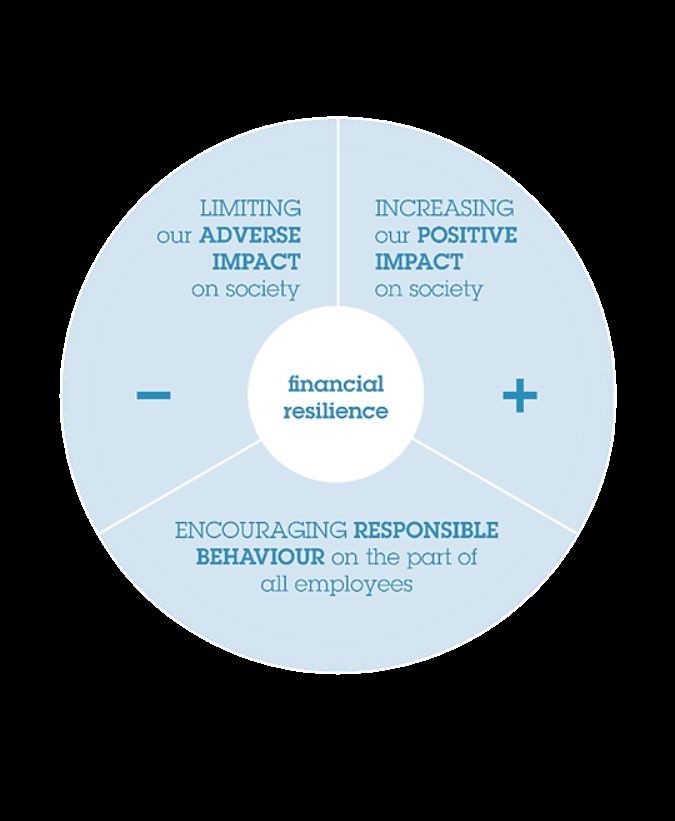
Contents
1. Strategy and business profile SHAREHOLDER STRUCTURE AT END 2020
2. Financial performance
3. Solvency, liquidity and funding
4. Covid-19
5. Covered bond programme
6. Green bond framework
7. Looking forward Roughly 40% of KBC shares are owned by a syndicate of core
shareholders, providing continuity to pursue long-term strategic
goals. Committed shareholders include the Cera/KBC Ancora
Appendices Group (co-operative investment company), the Belgian farmers’
association (MRBB) and a group of industrialist families
The free float is held mainly by a large variety of international
institutional investors
5
KBC Group in a nutshell (1)
We want to be among Europe’s best performing financial institutions! By achieving this,
KBC wants to become the reference in bank-insurance in its core markets
• We are a leading European financial group with a focus on providing bank-insurance products and services to
retail, SME and mid-cap clients, in our core countries: Belgium, Czech Republic, Slovakia, Hungary, Bulgaria and
Ireland.
Diversified and strong business performance
… geographically
• Mature markets (BE, CZ, IRL) versus developing markets (SK, HU, BG)
• Economies of BE & 4 CEE-countries highly oriented towards Germany, while IRL is more oriented to the UK & US
• Robust market position in all key markets & strong trends in loan and deposit growth
… and from a business point of view KBC Group: topline diversification 2018-2020 (in %)
• An integrated bank-insurer
• Strongly developed & tailored AM business
47% 48% 47%
• Strong value creator with good operational
results through the cycle Diversification Synergy
• Unique selling proposition: in-depth
knowledge of local markets and profound 53% 52% 53%
relationships with clients
• Integrated model creates cost synergies and results Customer Centricity 2018 2019 2020
in a complementary & optimised product offering Other income Net interest income
• Broadening ‘one-stop shop’ offering to our clients 6
KBC Group in a nutshell (2)
High profitability
CET1 generation
C/I ratio Combined ratio Net result ROE before any deployment
271 bps 251 bps
1440m
60% 85% EUR 2489m 8% 141 bps
58% 90% EUR 14%
2018 2019 2020
FY20
FY19
Solid capital position… … and robust liquidity positions
Fully loaded Basel 3 CET1 ratio of KBC Group (Danish Compromise)
15.7%* 15.6%* 15.4%*
17.1%** 16.3%* 16.6% * 16.6%* 17.6% NSFR LCR
10.35% Maximum Distributable Amount
7.95% theoretical regulatory minimum 146% 147%
136% 138%
1Q19 1H19 9M19 FY19 1Q20 1H20 9M20 FY20 FY20
FY19
* No IFRS interim profit recognition given more stringent ECB approach
** Taking into account the withdrawal of the final gross dividend over 2019 profit of 2.5 EUR per share
7
Differently: the next level

KBC is the reference: The winning factors
                                    Trust                                  Personalised solutions
                                    Capitalising on the trust customers    Using data and AI to offer proactively
                                    place in us today                      compelling, relevant and personalised
                                                                           financial solutions

                                    Customer experience                    Broad offer
                                    Providing    zero-hassle,  no-frills   Emphasising our broad financial offer
                                    customer experience leveraging our     and ensuring these solutions are Bigtech
                                    unique strengths on data-security      proof (pro-active, convenient &
                                    and data-privacy                       personalised)

                                    Straight-through
                                                                           Beyond bank-insurance
                                    processes
                                                                           Staying focused on the financial wellness
                                    This implies re-design of processes    of our customers and offer services to
                                    and avoiding to digitise the current   become embedded in our customer’s
                                    ones. Aim is E2E digital processes     daily life

                                               8
, your digital assistant

Hyper personalised and trusted financial digital assistant
                                                                                      RELEVANT & VALUABLE OFFER
                                                                                       Kate will only propose offers where sufficient
                                                                                      added value is shown or when she can serve the
                                                                                       client in an important moment in the client's
     PERSONALISED & DATA DRIVEN                                                                             live
    The interaction between the customer and Kate
      will be triggered by data analysis (approval                                                                    AT THE RIGHT TIME
     granted by customer). Kate will be trained on                                                           Lead journeys driven by time or location are
               the basis of the customer’s                                                                        preferably taken care of by Kate, as
           profile, preferences and activities                                                                notifications linked to a specific location or
                                                                                                             specifying moment in time are perceived as
                                                                                                                             highly personal
                           DIGITAL FIRST & E2E
                          We will offer the client a frictionless
                        End2End digital process and in doing so                                                                             VOLUME
                       make bank/insurance simple and hassle free                                                          We want all our clients to meet Kate as much as
                                                                                                                            possible. Kate will allow us to reach out to a
                                                                                                                              sufficient volume of clients, in terms of
                                            SERVING: SECURE &
                                                                                                                              transactions and in terms of number of
 ‘No hassle, no                               FRICTIONLESS                                                                               targetable audience
                                    Kate will help the client saving time and/or
  friction, zero                    money, focusing more on the convenience
      delay’                      factor. Kate will also serve the client regarding
    Johan Thijs                                  security and fraud

                                                                                        9
Differently: the next level

The strong basis remains

                           +

                                             +

                                        10
Differently: the next level
Bank-insurance+
11Differently: the next level
Translating strategy into non-financial targets
CUSTOMER
From key priorities to operational targets NPS RANKING
Maximize
customer
No hassle, no frills, zero- experience
delay customer experience
Proactive personalized
financial solutions via DATA
Outperform
and AI
Go for KEY on
Re-design & automation of DATA
PRIORITIE operational
all processes Digital first STP
% DIGITAL
SALES
DRIVEN
S efficiency SCORE
Bank-insurance+
Digital lead management:
from data driven to solution Further
driven
enhance
Group-wide collaboration bank-
insurance
% BANK-INSURANCE
CUSTOMERS
12Differently: the next level
Translating strategy into non-financial targets
Introducing 4 new operational targets (1)
Customer NPS ranking % bank-insurance (BI) clients
Top-2 Top-2 78% 85%
22% 27%
2020* target '23
2020 BI target '23 2020 stable BI target '23
Target is to remain the reference
(top-2 score on group level) ≥85% of active customers to be BI customers
Based on weighted avg of ranking in six core countries ≥27% of active customers to be stable BI customers
* Based on the latest available data. BI customers have at least 1 bank + 1 insurance product of our group.
Stable BI customers: at least 2 bank + 2 insurance products (Belgium: 3+3)
13Differently: the next level
Translating strategy into non-financial targets
Introducing 4 new operational targets (2)
% digital sales STP score*
(bank / insurance) (straight through processing)
40%
32% 80%
25% 60%
15% 25% 41%
2020 target '23 2020 target '23 2020 target '23 2020 target '23
bank insurance STP STP
potential
Digital sales ≥40% of bank sales
Digital sales ≥25% of insurance sales STP ≥60% and STP potential ≥80%
The STP-ratio measures how many of the services that can be offered digitally
Based on weighed avg of selected core products
are processed without any human intervention and this from the moment of
interaction by a client until the final approval by KBC.
STP potential measures what the STP-ratio would be if KBC would only have
the digital channel in its interaction with clients for a given process or product.
* Based on analysis of core commercial products.
14Our sustainability strategy
The cornerstones of our sustainability strategy and our commitment to the United Nations
Sustainable Development Goals
We apply strict sustainability rules to our business activities
adverse impact
Limiting our
in respect of human rights, the environment, business ethics
and sensitive or controversial social themes. In the light of
constantly changing societal expectations and concerns, we
review and update our sustainability policies at least every
two years.
We are focusing on areas in which we, as a bank-insurer, can
positive impact
create added value: financial literacy, entrepreneurship,
Increasing our
environmental awareness and demographic ageing and/or
health. In doing so, we take into account the local context of
our different home markets. Furthermore, we also support
social projects that are closely aligned with our policy.
Responsible behaviour is especially relevant for a bank-
Responsible behaviour
insurer when it comes to appropriate advice and sales.
Therefore, we pay particular attention to training (including
testing) and awareness. For that reason, responsible
behaviour is also a theme at the KBC University, our senior
management training programme, in which the theory is
taught and practised using concrete situations. Senior
managers are then tasked with disseminating it throughout
the organisation.
15Our sustainability strategy
Sustainability embedded in our organisation
• The Group Executive Committee reports to the BOARD OF DIRECTORS
on the sustainability strategy, including policy on climate change.
Board of Directors
• The INTERNAL SUSTAINABILITY BOARD (ISB) is chaired by
Executive Committee the Group CEO and comprises senior managers from all business units
and core countries, the Group CFO (as chairman of Sustainable Finance
Internal Sustainability
Board
Steering Committee) and the Corporate Sustainability
General Manager. The ISB has group-wide decision rights on all
KBC Group Corporate
sustainability-related issues (including our climate approach) and is the
Sustainable finance Program main platform for driving sustainability at group level. It debates and
Sustainability team
takes decisions on any sustainability-related matter, both at a strategic
External Sustainability Board Senior Representatives from level and in more operational terms.
& SRI Advisory Board Finance and Risk functions
together with Sustainability • The GROUP CORPORATE SUSTAINABILITY DIVISION is headed by the
Experts Group Corporate Sustainability General Manager and reports directly to
Country Coordinator Corporate
Sustainability the Group CEO. The team is responsible for developing the
sustainability strategy and implementing it across the group. The team
monitors and informs the Executive Committee and the Board of
• A SUSTAINABLE FINANCE PROGRAMME to focus on integrating the climate Directors on progress twice a year via the KBC Sustainability Dashboard.
approach within the group. It oversees and supports the business as it develops its
climate resilience in line with the TCFD recommendations and the EU Action Plan. • In addition to our internal organisation, we have set up
• The programme is overseen by a SUSTAINABLE FINANCE STEERING COMMITTEE EXTERNAL ADVISORY BOARDS to advise KBC on various
chaired by the Group CFO. Via the KBC Sustainability Dashboard, progress is aspects of sustainability. They consist of experts from the
discussed regularly within the Internal Sustainability Board, the Group Executive academic world:
Committee and the Board of Directors. • An EXTERNAL SUSTAINABILITY BOARD advises the
Corporate Sustainability Division on KBC sustainability
• In each core country, the CORPORATE SUSTAINABILITY COUNTRY COORDINATOR is policies and strategy.
responsible for integrating the decisions of the Internal Sustainability Board and the • An SRI ADVISORY BOARD acts as an independent body for
objectives of the Sustainable Finance Programme. They work closely and frequently with the SRI funds and oversees screening of the socially
the Group Corporate Sustainability General Manager as well as with their country responsible character of the SRI funds offered by KBC
representative in the ISB. Asset Management.
16Our sustainability strategy
We substantially raise the bar for our climate-related ambitions
Renewable energy loans Direct coal-related finance
Volume of SRI Funds (In millions of EUR)
(In billions of EUR) (In % of total energy-sector loan portfolio)
252
30 61% 65%
57%
41% 44%
17
12 86
7 9 Full
34 36
11 Exit
0
2017 2018 2019 2020 target’25 2017 2018 2019 2020 target’30 2016 2017 2018 2019 2020 2021
Target raised from 50% to 65% by ‘30 Proven track record in building down direct coal exposure
Almost doubling of SRI funds by ’25 (vs 2020)
Firm commitment to exit coal, supporting existing clients
SRI funds ≥ 50% of new fund production by ‘21
in their transition. In order to remain eligible for any kind
of financing, the related client must commit not to engage
into any new coal project and must submit a coal-phase-
Green electricity Reduction own GHG emissions
out plan
(In % of own electricity consumption) (incl. commuter travel)
(In % compared to 2015)
100% 63% Our ESG Latest Score
78% 83% 87%
74% 50% ratings: (End Jan 2021)
38% 80%
29%
56% CDP A - Leadership
32% 42%
26%
FTSE4Good 4.7/5
2017 2018 2019 2020 target’30 2017 2018 2019 2020 Target’30 ISS ESG C Prime
Excl. commuter Incl. commuter (incl. commuter travel)
Target raised from 90% to 100% by ‘30 MSCI AAA
Target reduction of own emissions raised from 65%
Sustainalytics Low Risk: 3rd percentile of 408
to 80% by ‘30 diversified banks (risk view)
KBC will achieve full climate neutrality as of the end S&P Global - 85th percentile of 253 banks
of 2021 by offsetting the balance RobecoSAM assessed
Vigeo Eiris Not publicly available
17Our sustainability strategy
Latest achievements
2020 achievements:
Sustainable finance (*) 2019 2018
• Update of the KBC energy policy and implementation of biodiversity (KBC Group, in millions of euros)
policy
• Asset management joins the Climate Action 100+ Green finance
• KBC, CBC and the European Investment Bank (EIB) together make Renewable energy and biofuel sector 1 768 1 235
300m EUR available to Belgian SMEs for sustainable loan (focus on
climate and agriculture lending) Social finance
• Solar panels on roof KBC building in Belgium, Czech Republic and
Health care sector 5 783 5 621
Bulgaria (resulting in an annual reduction of about 245 tonnes CO2)
Education sector 975 943
2019 achievements: Socially Responsible Investments
• We signed the Collective Commitment to Climate Action, an
initiative of the UNEP FI (Sep 2019) SRI funds under distribution 12 016 8 970
• The entire range of KBC sustainable funds is fully compliant with the
Total 20 542 16 769
Febelfin quality standard for sustainable investment
• KBC signed the Tobacco-Free Finance Pledge drawn up by the (*) For the sustainability report of 2019, we refer to the KBC.COM website:
international organisation Tobacco Free Portfolios https://www.kbc.com/en/corporate-sustainability/reporting.html
• KBC signed the ‘Open letter to index providers on controversial
weapons exclusions’ – an investor initiative coordinated by Swiss
Sustainable Finance
• We continued to build on ‘Team Blue’ – a group-wide initiative at
KBC to strengthen ties and promote cooperation among all the
group’s staff in the different countries in which KBC operates.
18Our sustainability strategy
Preparing for a science-based approach
We have launched 3 pilot projects (PACTA, PCAF and UNEP FI) working on a series of tools and methodologies :
(1) to enhance our ability to identify and to translate climate-related risks and opportunities in our strategy
(2) quantify the indirect impact of our most carbon-intensive sectors and business lines
Pilots
• The first results of the pilot indicate that KBC appears to be less exposed to
industrial groups active in the 7 high-carbon sectors (fossil fuels, power,
automotive, shipping, aviation, cement and steel) compared to the 16 other
PACTA pilot banks
• KBC is involved in a project to further develop the methodology used within
the UNEP FI programme. The goal of which is to identify the physical risks
arising from certain climate scenarios for the most significantly affected
sectors in our loan portfolio. We have begun the analysis of physical risks for
mortgage loans in Flanders and transition risks for the metals sector.
• In 2019 we began to pilot the PCAF methodology to calculate the carbon
footprint of the portfolios: car lease, car loans, mortgage loans for residential
real estate and commercial real estate.
19Contents
1. Strategy and business profile
BREAKDOWN OF ALLOCATED CAPITAL
2. Financial performance BY BUSINESS UNIT AS AT
31 DEC 2020
3. Solvency, liquidity and funding
4. Covid-19 Czech Republic
15%
5. Covered bond programme
Belgium 61%
6. Green bond framework
22%
International Markets
7. Looking forward
1%
Appendices Group Centre
204Q 2020 key takeaways
4Q20 financial performance
FY20
Commercial bank-insurance franchises in core
markets performed well ROE 8% (10%* in 4Q20)
Customer loans and customer deposits increased Cost-income ratio 59% (adjusted for specific items)
y-o-y in most of our core countries Combined ratio 85%
Credit cost ratio 0.60% (0.16% without
Lower net interest income and net interest margin
collective Covid-19 impairments**)
Higher net fee and commission income Common equity ratio 17.6% (B3, DC, fully loaded)
Excellent Leverage ratio 6.4% (fully loaded)
Lower net gains from financial instruments at fair
value and stable net other income
net result NSFR 146% & LCR 147%
of 538m Net result
Sales of non-life and life insurance up y-o-y
EUR in 745
612
702 697
538
Tight cost management 4Q20 430
Slightly higher net impairments on loans and sharply 210
higher impairments on ‘other’ (of which 59m EUR as -5
the result of a one-off software impairment) 1Q19 2Q19 3Q19 4Q19 1Q20 2Q20 3Q20 4Q20
Solid solvency and liquidity * when evenly spreading the bank tax throughout the year
** 783m EUR collective Covid-19 impairments in FY20, of which
Comparisons against the previous quarter unless otherwise stated 672m EUR management overlay and 111m EUR impairments
captured by the ECL models through the updated IFRS 9
macroeconomic variables
21Net result at KBC Group
CONTRIBUTION OF BANKING ACTIVITIES
TO KBC GROUP NET RESULT*
618 586
514 546
437
334
NET RESULT AT KBC GROUP*
42
745
702 697 -11
612
538 1Q19 2Q19 3Q19 4Q19 1Q20 2Q20 3Q20 4Q20
430
210 CONTRIBUTION OF INSURANCE ACTIVITIES
TO KBC GROUP NET RESULT*
173 157
-5
143
1Q19 2Q19 3Q19 4Q19 1Q20 2Q20 3Q20 4Q20
124 99 133
119 134
94
96 61 66 74
33
83 79 79 3 85
68 73 70
36
-4 -20 -12
* Difference between net result at KBC Group and the sum of the banking and insurance -46 -30 -20 -31 -50
contribution is accounted for by the holding-company/group items -13
1Q19 2Q19 3Q19 4Q19 1Q20 2Q20 3Q20 4Q20
Non-Life result Non-technical & taxes
Amounts in m EUR 22
Life resultLower net interest income and net interest margin
NII Amounts in m EUR
Net interest income (1,067m EUR)
1,174 1,182 1,195
1,129
16
1,132
12 117 14 114 12 111 17
1,083 1,122
15 1,067 14 • Decreased by 5% q-o-q and by 10% y-o-y
118 114
4 1 1 106
6 131 105 1 • The q-o-q decrease was driven primarily by:
o lower reinvestment yields
1,006 1,044 1,057 1,066 o a lower positive one-off item at NII Insurance (+5m EUR in 4Q20 versus
992 971 977 947
+26m EUR in 3Q20)
o depreciation of the CZK & HUF versus the EUR
-1 -1 o slightly lower netted positive impact of ALM FX swaps
1Q19 2Q19 3Q19 4Q19 1Q20 2Q20 3Q20 4Q20 partly offset by:
NII - netted positive impact of ALM FX swaps* NII - Insurance o higher margin on new production mortgages than the margin on the
NII - Holding-company/group NII - Banking outstanding portfolio in Belgium, the Czech Republic and Slovakia
o intensified charging of negative interest rates on certain current accounts
NIM **
1.98%
to corporates and SMEs
1.94% 1.94% 1.94% 1.97%
• The y-o-y decrease was mainly the result of the CNB rate cuts, the
1.82% 1.81%
1.75%
depreciation of the CZK & HUF versus the EUR and the negative
impact of lower reinvestment yields
Net interest margin (1.75%)
• Decreased by 6 bps q-o-q and by 19 bps y-o-y due mainly to the CNB
1Q19 2Q19 3Q19 4Q19 1Q20 2Q20 3Q20 4Q20 rate cuts, the negative impact of lower reinvestment yields and an
* From all ALM FX swap desks increase of the interest-bearing assets (denominator)
** NIM is calculated excluding the dealing room and the net positive impact of ALM FX swaps & repos
ORGANIC VOLUME TREND Total loans** o/w retail mortgages Customer deposits*** AuM Life reserves
Volume 160bn 72bn 215bn 212bn 28bn
Growth q-o-q* 0% +2% +1% +4% +1%
Growth y-o-y +3% +7% +6% -2% -3%
* Non-annualised ** Loans to customers, excluding reverse repos (and bonds). Growth figures are excluding FX, consolidation adjustments, reclassifications and collective Covid-19 ECL
*** Customer deposits, including debt certificates but excluding repos. Customer deposit volumes excluding debt certificates & repos +2% q-o-q and +11% y-o-y
23Higher net fee and commission income
F&C Amounts in m EUR Net fee and commission income (403m EUR)
• Up by 3% q-o-q and down by 10% y-o-y
444 445
435 429
410
388 390 403 • Q-o-q increase was the result of the following:
243
o Net F&C income from Asset Management Services increased by
230 237 229
219
219 218 229 2% q-o-q as a result of higher management fees, partly offset by
lower entry fees from mutual funds and unit-linked life
insurance products
264 270 275 279 270 237 245 250 o Net F&C income from banking services rose by roughly 5% q-o-q
as higher securities-related fees, higher fees from credit files &
-73 -65 -68 -77 -71 -68 -73 -77 bank guarantees and higher network income were partly offset
1Q19 2Q19 3Q19 4Q19 1Q20 2Q20 3Q20 4Q20 by slightly lower fees from payment services
o Distribution costs rose by 5% q-o-q due chiefly to higher
Distribution Banking services Asset management services commissions paid linked to banking products and increased life
insurance sales
• Y-o-y decrease was mainly the result of the following:
o Net F&C income from Asset Management Services fell by 10%
Amounts in bn EUR
y-o-y as a result of lower management fees and entry fees
AuM o Net F&C income from banking services decreased by 6% y-o-y
216
(-3% y-o-y excluding FX effect) driven mainly by lower fees from
210 210 212 212
193
202 204 payment services (partly due to less transaction volumes as a
result of Covid-19, partly due to the SEPA regulation) and lower
fees from credit files & bank guarantees, partly offset by higher
securities-related fees
o Distribution costs roughly stabilised y-o-y
1Q19 2Q19 3Q19 4Q19 1Q20 2Q20 3Q20 4Q20 Assets under management (212bn EUR)
• Increased by 4% q-o-q due entirely to a positive price effect
• Decreased by 2% y-o-y due mainly to net outflows in
24
investment adviceNon-life and life premium income up y-o-y
and excellent combined ratio
PREMIUM INCOME (GROSS EARNED PREMIUMS) Insurance premium income (gross earned
805 832
premiums) at 832m EUR
766 742 731 740 712 715 • Non-life premium income (450m EUR) increased by
351 317 291 364 297 267
382 2% y-o-y
276
• Life premium income (382m EUR) up by 43% q-o-q
and by 5% y-o-y
415 425 440 441 443 435 448 450
1Q19 2Q19 3Q19 4Q19 1Q20 2Q20 3Q20 4Q20
Life premium income Non-Life premium income
COMBINED RATIO (NON-LIFE) The non-life combined ratio for FY20
amounted to an excellent 85%. This is the
93% 92% 92%
90%
83% 83%
90%
85% result of 3% y-o-y premium growth combined
with 6% y-o-y lower technical charges in FY20.
The latter was due mainly to lower normal
claims in FY20 (especially in ‘Motor’ and
‘Workmen’s compensation’, partly due to
Covid-19), despite an increase of the ageing
1Q 1H 9M FY reserves in 4Q20 (of 21m EUR)
2019 2020
Amounts in m EUR
25Non-life and life sales up y-o-y
NON-LIFE SALES (GROSS WRITTEN PREMIUM) Sales of non-life insurance products
567 • Up by only 1% y-o-y due to negative impact of Covid-19
534
on existing business (mainly ‘Workmen’s compensation’
412 411 400 415 416 405 and ‘General third-party liability’)
1Q19 2Q19 3Q19 4Q19 1Q20 2Q20 3Q20 4Q20
Sales of life insurance products
• Increased by 39% q-o-q and by 23% y-o-y
LIFE SALES • The q-o-q increase was driven by both higher sales of
561 582 guaranteed interest products in Belgium (attributable
516
459 471 chiefly to traditionally higher volumes in tax-incentivised
427 420
403 235 326 pension savings products in 4Q20) and unit-linked
302
261 311 249 214 products in Belgium and the Czech Republic
242
• The y-o-y increase was driven mainly by higher sales of
327
214 198 177 205 256 unit-linked products in Belgium (mainly due to
161 160
commercial actions towards Retail/SME clients)
1Q19 2Q19 3Q19 4Q19 1Q20 2Q20 3Q20 4Q20 • Sales of unit-linked products accounted for 44% of total
life insurance sales in 4Q20
Guaranteed interest products Unit-linked products
Amounts in m EUR
26Lower FIFV and stable net other income
FIFV 253 The q-o-q small decline in net gains from financial
126
instruments at fair value was attributable mainly
99
130
85 80 to:
44 42
62 8 48
100 19
45
• a negative change in ALM derivatives
11 19 17 10 55
29
-22 -8
28 31 13
-2
23
-30 • lower market, credit and funding value adjustments
-3 -37 -25 -58 -3
-2 -1
(mainly as a result of changes in the underlying market
-46 value of the derivatives portfolio due to lower long-term
-186 interest rates, despite increasing equity markets and
decreasing counterparty credit spreads & KBC funding
-59 spread)
-82 o FVA: 18m EUR (-5m EUR q-o-q)
-385 o CVA: 31m EUR (+2m EUR q-o-q)
1Q19 2Q19 3Q19 4Q19 1Q20 2Q20 3Q20 4Q20 o MVA: -4m EUR (-6m EUR q-o-q)
Dealing room & other income M2M ALM derivatives partly offset by:
MVA/CVA/FVA Net result on equity instruments (overlay insurance) • higher dealing room & other income
• a higher net result on equity instruments (insurance)
NET OTHER INCOME
133
Net other income amounted to 37m EUR, below
the normal run rate of around 50m EUR per
quarter due to, among other things, a legacy legal
59
43 47 50 53
37 37
file in the Czech Republic (-6m EUR) and an
additional impact of the tracker mortgage review in
Ireland of -3m EUR
1Q19 2Q19 3Q19 4Q19 1Q20 2Q20 3Q20 4Q20
Amounts in m EUR
27Tight cost management
OPERATING EXPENSES Operating expenses excluding bank taxes
1,296 1,338 decreased by 4.2% y-o-y in FY20 (compared to our
1,045 407
FY20 guidance of -3.5% y-o-y) due chiefly to the
382 988
30
975
28
51 904 926
988
49
announced cost savings triggered by Covid-19
27 21
Operating expenses excluding bank taxes
913 957 947 994 931 905 939
increased by 4% q-o-q primarily as a result of:
877
o higher staff expenses (due largely to a higher accrual
of variable compensation and wage inflation in most
countries)
1Q19 2Q19 3Q19 4Q19 1Q20 2Q20 3Q20 4Q20
o higher ICT & marketing costs and higher professional
Bank tax Operating expenses fees
partly offset by:
Amounts in m EUR
o +10m EUR one-off as a result of the updated
BANK TAX SPREAD IN 2020 software capitalisation policy
TOTAL Upfront Spread out over the year
o lower facilities expenses
4Q20 1Q20 2Q20 3Q20 4Q20 1Q20 2Q20 3Q20 4Q20 Cost/income ratio (banking) adjusted for specific
BE BU 0 289 2 0 0 0 0 0 0 items* at 60% in 4Q20 and 59% in FY20 (58% in
CZ BU 0 40 0 0 0 0 0 0 0
FY19). Cost/income ratio (banking): 56% in 4Q20
and 60% in FY20
Hungary 22 25 1 0 0 20 18 20 22
Slovakia 0 3 0 0 0 8 8 0 0
Bulgaria 0 17 -1 0 0 0 0 0 0 Total bank taxes (including ESRF contribution)
increased by 2% y-o-y to 503m EUR in FY20
Ireland 26 4 -1 0 0 1 1 1 26
GC 0 0 0 0 0 0 0 0 0
TOTAL 49 377 0 0 0 29 27 21 28 49 * See glossary (slide 106) for the exact definition
Amounts in m EURHigher asset impairments
ASSET IMPAIRMENT 857
12 Higher asset impairments q-o-q due to other impairments
141
• The q-o-q small increase of loan loss provisions was attributable
746
20
122 entirely to a lower reversal of collective Covid-19 impairments in
69 82 43 66
4Q20 (impact from updated IFRS 9 macroeconomic variables was
63
1 40
7
11
fully offset by the management overlay)
26 99
67
36
4
1
75 78 57 57 • Impairment of 66m EUR on ‘other’, of which 59m EUR as the
25
-5 -1 result of a one-off software impairment (see next slide) and a 2m
1Q19 2Q19 3Q19 4Q19 1Q20 2Q20 3Q20 4Q20 EUR one-off modification loss from moratorium (time value of
deferred interest)
Other impairments Impairments on financial assets at AC and FVOCI
Collective Covid-19 ECL
CREDIT COST RATIO
0.60%
0.42%
0.23%
0.44%
The credit cost ratio in FY20 amounted to:
0.09% 0.12% • 16 bps (12 bps in FY19) without collective Covid-19 ECL
0.16%
• 60 bps with collective Covid-19 ECL
-0.06% -0.04%
FY14 FY15 FY16 FY17 FY18 FY19 FY20
CCR with collective Covid-19 ECL CCR without collective Covid-19 ECL
IMPAIRED LOANS RATIO
4.3%
3.7% 3.5% 3.5% 3.3% 3.4% 3.2% 3.3% The impaired loans ratio amounted to 3.3%, 1.8% of which
over 90 days past due
2.4% 2.1% 2.0% 1.9% 1.9% 1.9% 1.8% 1.8%
1Q19 2Q19 3Q19 4Q19 1Q20 2Q20 3Q20 4Q20
29
Amounts in m EUR Impaired loans ratio of which over 90 days past dueSoftware impairment and update of software capitalisation policy
Software impairment 4Q20:
• As a result of concrete impairment triggers related to a few distinct software projects, a total impairment of -59m EUR was booked in
the fourth quarter results
Entity Belgium Czech Rep. Slovakia Hungary Group Centre Total
Impairment -28m EUR -6m EUR -2m EUR -5m EUR -18m EUR -59m EUR
Update of software capitalisation policy
• The KBC Board of Directors approved the change in accounting policy, to no longer capitalise internally developed software assets
below a certain materiality threshold (and which will be immediately expensed in OPEX instead)
• As a result of this change in accounting policy:
o The retrospective impact of derecognising the software assets below the threshold has led to a correction of the opening balance
of 2019 equity by -182m EUR before tax (and -143m EUR after tax)*, without impacting the 2019 P&L nor the capital ratios (as the
2019 drop in parent shareholders’ equity is compensated by lower intangible fixed assets, which are deducted from common equity)
o The impact for 2020 is fully included in the operating expenses of the fourth quarter. This amounts to +10m EUR before tax, which
is positive as the software depreciations to be reversed exceed the capitalisation to be cancelled
Entity Belgium Czech Rep. Hungary Group Centre Total
2020
OPEX +11m EUR -4m EUR +1m EUR +2m EUR +10m EUR
Because of the two items above, the positive impact on CET1 in the fourth quarter of 2020 coming from the quick fix
“prudently valued software” decreases from 21 basis points to 11 basis points
30
* detailed information on the different balance sheet movements can be found in the quarterly reportLoan loss experience at KBC
FY20 FY19 FY18 FY17 FY16 AVERAGE
CREDIT COST CREDIT COST CREDIT COST CREDIT COST CREDIT COST ‘99 –’20
RATIO RATIO RATIO RATIO RATIO
Belgium 0.57% 0.22% 0.09% 0.09% 0.12% n/a
Czech
0.67% 0.04% 0.03% 0.02% 0.11% n/a
Republic
International
0.78% -0.07% -0.46% -0.74% -0.16% n/a
Markets
Group
-0.23% -0.88% -0.83% 0.40% 0.67% n/a
Centre
Total 0.60% 0.12% -0.04% -0.06% 0.09% 0.43%
Credit cost ratio: amount of losses incurred on troubled loans as a % of total average outstanding loan portfolio
31Impaired loans ratios, of which over 90 days past due
KBC GROUP BELGIUM BU
4.3% 2.6%
2.3% 2.3% 2.4% 2.4%
2.2% 2.2% 2.3%
3.7%
3.5% 3.5% 3.4%
3.3% 3.2% 3.3%
2.4% 2.1% 2.0% 1.9% 1.9% 1.9% 1.8% 1.8% 1.2% 1.1% 1.1% 1.1% 1.1% 1.2% 1.2% 1.1%
1Q19 2Q19 3Q19 4Q19 1Q20 2Q20 3Q20 4Q20 1Q19 2Q19 3Q19 4Q19 1Q20 2Q20 3Q20 4Q20
Impaired loans ratio
Of which over 90 days past due
CZECH REPUBLIC BU INTERNATIONAL MARKETS BU
2.5% 11.8%
2.4% 2.3% 2.3% 2.3%
2.2% 2.2% 2.1% 9.8%
9.1%
8.5% 8.2% 7.8%
7.2% 6.9%
1.5% 7.6%
1.3% 1.4% 1.3% 1.2% 5.8%
1.1% 1.1% 1.0% 5.3% 5.1% 4.9% 4.8% 4.5% 4.2%
1Q19 2Q19 3Q19 4Q19 1Q20 2Q20 3Q20 4Q20 1Q19 2Q19 3Q19 4Q19 1Q20 2Q20 3Q20 4Q20
32Cover ratios
KBC GROUP BELGIUM BU
65.6% 63.5% 65.9% 68.3%
60.4% 60.4% 62.4% 61.7% 64.4% 64.2% 63.4% 65.4%
59.9% 60.3% 62.5% 62.6%
45.3% 43.4% 44.8% 45.2% 44.7% 44.9% 45.4% 46.4% 45.6%
42.2% 42.0% 42.0% 42.1% 43.0% 42.3% 41.7%
1Q19 2Q19 3Q19 4Q19 1Q20 2Q20 3Q20 4Q20 1Q19 2Q19 3Q19 4Q19 1Q20 2Q20 3Q20 4Q20
Impaired loans cover ratio
Cover ratio for loans with over 90 days past due
CZECH REPUBLIC BU INTERNATIONAL MARKETS BU
69.0% 70.1% 60.7%
65.5% 65.5% 66.9% 66.0% 66.1%
63.9%
48.1% 47.0% 47.0% 48.7% 46.5% 47.4%
46.4%
47.4% 47.5% 48.1% 47.2% 47.2% 47.2% 49.2% 48.7% 43.0%
35.2% 34.0% 34.4%
32.7% 32.1% 32.7% 32.4%
1Q19 2Q19 3Q19 4Q19 1Q20 2Q20 3Q20 4Q20 1Q19 2Q19 3Q19 4Q19 1Q20 2Q20 3Q20 4Q20
33Overview of contribution of business units to FY20 result
Amounts in m EUR
NET PROFIT – KBC GROUP
FY20 ROAC: 13%
2,575 2,570 2,489
2,427
462 621
685 702
1,440
2,113 538
1,948 1,787
1,742
902
2016 2017 2018 2019 2020
4Q 9M
NET PROFIT – BELGIUM NET PROFIT – CZECH REPUBLIC NET PROFIT – INTERNATIONAL MARKETS
FY20 ROAC: 14% FY20 ROAC: 22% FY20 ROAC: 8%
1,575
1,432 1,450
335 1,344
361
439 412 1,001
789
702 654
396 596 205 533
168 170 428 444
1,240 131 93 379
1,089 375 74
993 932 139 119
605 534 584 94 199
465 484 370 440
281 289 260 86
113
2016 2017 2018 2019 2020 2016 2017 2018 2019 2020 2016 2017 2018 2019 2020
4Q 9M 4Q 9M 4Q 9M
34Balance sheet
KBC Group consolidated at the end of December 2020
Total assets Total liabilities and equity
(EUR 321bn) (EUR 321bn)
160 Capital adequacy &
Credit quality 191
liquidity position
69 22
25
3 14 19
13
7
76
46
Loan book (loans and advances to customers) Deposits from customers
Investment portfolio (equity and debt securties) Equity (including AT1)
Insurance investment contracts Other MREL instruments and debt certificates
Trading assets Technical provisions, before reinsurance NL and L
Other (incl. interbank loans, reverse repos, Liabilities under insurance investment contracts
property & equipment etc...) Trading liabilities
Other (incl. interbank deposits)
35Balance sheet:
Loans and deposits continue to grow in all countries
BE 17%
14%
7%
6%
3% 4%
Y-O-Y ORGANIC* VOLUME GROWTH Loans** Retail Deposits*** Loans** Retail Deposits***
mortgages mortgages
23%
12% 13%
7% 9%
6% 6%
CR
3% 1%
4% Loans** Retail Deposits*** Loans**** Retail Deposits***
mortgages mortgages
Loans** Retail Deposits*** 24%
mortgages
19%
11% 3% 3%
-3%
Loans** Retail Deposits*** Loans** Retail Deposits***
* Volume growth excluding FX effects, divestments/acquisitions and collective Covid-19 ECL mortgages
** Loans to customers, excluding reverse repos (and bonds) mortgages
*** Customer deposits, including debt certificates but excluding repos 36
**** Total customer loans in Bulgaria: new bank portfolio +13% y-o-y, while legacy -18% y-o-ySectorial breakdown of outstanding loan portfolio (1)
(181bn EUR*) of KBC Bank Consolidated
Services
11%
Distribution Oil, gas & other fuels
Hotels, bars & restaurants Electricity
7%
Shipping 0.5%
1.6%
0.6% 0.7%
Private Persons 43% Machinery & heavy equipment
0.9% Food producers
1.8%
13% Rest
Chemicals 1.4%
6% 1.4%
Real estate Metals 4.1%
8% Other sectors
3%
3% 3% 4% Finance & insurance
Automotive Building & construction
Agriculture, farming, fishing Authorities
* It includes all payment credit, guarantee credit (except for confirmations of letters of credit and similar export/import related commercial credit), standby credit and credit
derivatives, granted by KBC to private persons, companies, governments and banks. Bonds held in the investment portfolio are included if they are corporate or bank issued,
hence government bonds and trading book exposure are not included
* Outstanding amount includes all on-balance sheet commitments and off-balance sheet guarantees
37Geographical breakdown of the outstanding loan portfolio (2)
(181bn EUR*) of KBC Bank Consolidated
Asia
North America
Rest
Other CEE
Other W-Eur 1.6%
0.2%
8.9% 1.4%
Bulgaria 1.2%
Hungary 2.1%
3.3%
Slovakia 5.7%
53.2%
Ireland 5.8%
Belgium
16.6%
Czech Rep.
* It includes all payment credit, guarantee credit (except for confirmations of letters of credit and similar export/import related commercial credit), standby credit and credit
derivatives, granted by KBC to private persons, companies, governments and banks. Bonds held in the investment portfolio are included if they are corporate or bank issued,
hence government bonds and trading book exposure are not included
* Outstanding amount includes all on-balance sheet commitments and off-balance sheet guarantees
38Government bond portfolio – Notional value
Notional investment of 51.4bn EUR in government bonds (excl. trading book) at end of FY20, primarily as a
result of a significant excess liquidity position and the reinvestment of insurance reserves in fixed-income
instruments
Notional value of GIIPS exposure amounted to 5.8bn EUR at the end of FY20
END OF FY19 END OF FY20
(Notional value of 46.1bn EUR) (Notional value of 51.4bn EUR)
Netherlands * Ireland Netherlands *
Ireland
Austria * Portugal * Austria *
Portugal *
Germany ** Germany **
Spain Spain
5% 5%
Other 27%
Other 29% 9%
10%
Belgium
Belgium
France 12%
13%
France
3%
4% 14% 19%
Italy 3%
Italy 3% 6% Czech Rep.
Bulgaria** 7% Czech Rep.
Bulgaria** 6% 3% 6% 3%
Poland Slovakia
Slovakia Poland
Hungary Hungary
(*) 1%, (**) 2% (*) 1%, (**) 2%
39Contents
1. Strategy and business profile
2. Financial performance
3. Solvency, liquidity and funding
4. Covid-19
5. Covered bond programme
6. Green bond framework
7. Looking forward
Appendices
40Strong capital position (1)
Fully loaded Basel 3 CET1 ratio at KBC Group (Danish Compromise)
The fully loaded common equity ratio
increased 1.0% q-o-q to 17.6% at the end of
17.1%
**
* * 17.6% FY20 based on the Danish Compromise
* 16.3% * 16.6% 16.6%
15.7% * 15.6% 15.4%* KBC’s CET1 ratio of 17.6% at the end of FY20
represents a solid capital buffer:
• 9.6% capital buffer compared with the current
theoretical minimum capital requirement of
10.45% OCR 7.95% (as a result of the announced ECB and
10.35% MDA
National Bank measures which provided
significant temporary relief on the minimum
7.95% theoretical regulatory minimum capital requirements)
• 7.2% capital buffer compared with the
Maximum Distributable Amount (MDA) of
10.35% (given small shortfall in AT1 bucket)
• 7.1% capital buffer compared with the Overall
Capital Requirement (OCR) of 10.45% (which still
includes the 2.50% capital conservation buffer on
top of the 7.95%)
1Q19 1H19 9M19 FY19 1Q20 1H20 9M20 FY20
At year-end 2020, the impact of the
* No IFRS interim profit recognition given the more stringent ECB approach
** Taking into account the withdrawal of the final gross dividend over 2019 profit of 2.5 EUR per share application of the transitional measures
resulted in a positive impact on CET1 ratio of
53 bps compared to fully loaded (transitional
CET1 ratio amounted to 18.1% at the end of
Total distributable items (under Belgian GAAP) KBC Group 10.6bn EUR at FY 2020,
2020)
of which:
• available reserves: 949m
• accumulated profits: 8 192m
41Strong capital position (2)
Fully loaded Basel 3 total capital ratio (Danish Compromise)
21.2%
20.6%** * * *
19.3%
* * 19.7% 19.8% 19.8%
19.2% 18.9%* 1.9% T2
2.1% T2
1.9% T2 1.8% T2 1.8% T2
2.1% T2 2.1% T2 2.0% T2 1.5% AT1 1.5% AT1
1.5% AT1 1.5% AT1 1.5% AT1
1.6% AT1 1.6% AT1 1.5% AT1
The fully loaded total capital ratio rose
from 19.8% at the end of 9M20 to 21.2%
17.1% CET1 16.6% CET1 16.6% CET1
17.6% CET1 at the end of FY20
15.7% CET1 15.6% CET1 15.4% CET 1 16.3% CET1
1Q19 1H19 9M19 FY19 1Q20 1H20 9M20 FY20
* No IFRS interim profit recognition given more stringent ECB approach
** Taking into account the withdrawal of the final gross dividend over 2019 profit of 2.5 EUR per share
42Fully loaded Basel 3 leverage ratio and Solvency II ratio
Fully loaded Basel 3 leverage ratio at KBC Group Fully loaded Basel 3 leverage ratio at KBC Bank
6.8%** 6.5% * 6.4%
6.0%* 6.1%* 6.0%* 6.0%* 5.9%* **
5.2%* 5.1%* 5.0%* 5.5% 5.2%* 5.2%
4.8%* 4.8%*
1Q19 1H19 9M19 FY19 1Q20 1H20 9M20 FY20 1Q19 1H19 9M19 FY19 1Q20 1H20 9M20 FY20
* No IFRS interim profit recognition given more stringent ECB approach * No IFRS interim profit recognition given more stringent ECB approach
** Taking into account the withdrawal of the final gross dividend over ** Taking into account the adjustment of the final dividend over 2019
2019 profit of 2.5 EUR per share
Solvency II ratio
9M20 FY20 The q-o-q delta in the Solvency II ratio was mainly
driven by the decision to retain the 2020 profit in line
Solvency II ratio 196% 222% with the NBB/EIOPA recommendation
43Strong customer funding base with liquidity ratios
remaining very strong
KBC Bank continues to have a strong retail/mid-cap deposit base in its core markets – resulting in a stable funding mix with a significant portion of the funding
attracted from core customer segments and markets
KBC Bank participated to the TLTRO III transaction for an amount of 19.5bn EUR in June (bringing the total TLTRO exposure to 21.9bn EUR), which significantly
increased its funding mix proportion and is reflected in the ‘Interbank Funding’ item below
9% 9% 10% 11% 10% 8% Funding from customers (m EUR) of KBC Banking Group
1% 13%
1% 1%
8% 8% 4% 2% 6% 7%
6% 6% 1%
8% 8% 192.970
9% 8% 8% 176.045
8% 8% 8% 133.766 139.560 143.690 155.774 163.824
3% 3% 7% 4%
7% 9% 2%
FY14 FY15 FY16 FY17 FY18 FY19 FY20
5%
71% 71% 69% 72% 70%
63% 63%
12%
70% Retail and SME
customer Mid-cap
driven Government and PSE
83%
FY14 FY15 FY16 FY17 FY18 FY19 FY20
Interbank Funding Total Equity
Secured Funding Certificates of deposit
Debt issues placed at institutional relations Funding from Customers
Ratios FY19 FY20 Regulatory requirement
NSFR is at 146% and LCR is at 147% by the end of FY20
• Both ratios were well above the regulatory requirement of 100% due
NSFR* 136% 146% ≥100%
to a strong growth in customer funding and the participation to
LCR** 138% 147% ≥100% TLTRO III
* Net Stable Funding Ratio (NSFR) is based on KBC Bank’s interpretation of the proposal of CRR amendment.
** Liquidity Coverage ratio (LCR) is based on the Delegated Act requirements. From EOY2017 onwards, KBC
Bank discloses 12 months average LCR in accordance to EBA guidelines on LCR disclosure. 44Upcoming mid-term funding maturities
Breakdown Funding Maturity Buckets at end 2020 In December 2019, KBC Bank NV decided to early repay the remaining part
(Including % of KBC Group’s balance sheet) of the TLTRO II (i.e. 2.545bn EUR) and entered into the TLTRO III for 2.5bn
EUR
7000
In May 2020, KBC Bank issued a covered bond for an amount of 1bn EUR
6000 with a 5.5-year maturity
1.6%
5000
In June 2020, KBC Group issued its second Green senior benchmark for an
amount of 500m EUR with a 7-year maturity with call date after 6 years
m EUR
4000 In June 2020, KBC Bank participated in TLTRO III for an amount of 19.5bn
0.9% EUR, which brings the total TLTRO exposure to 21.9bn EUR maturing in 2023
3000 0.8%
0.6 % 0.6% In September 2020, KBC Group issued a senior benchmark for an amount of
2000 0.5%
750m EUR with a 6-year maturity with call date after 5 years
0.3% 0.3%
In January 2021, KBC Group issued a senior benchmark for an amount of
1000
750m EUR with an 8-year maturity with call date after 7 years (not yet
0
included in the graphs)
2021 2022 2023 2024 2025 2026 2027 >= 2028
Senior Unsecured - Holdco Senior Unsecured - Opco Subordinated T1 Subordinated T2 Covered Bond
KBC Bank has 6 solid sources of long-term funding:
• Retail term deposits
• Retail EMTN
• Public benchmark transactions
37%
Total 40%
outstanding
• Covered bonds
= 18.2bn EUR • Structured notes and covered bonds using the private placement format
• Senior unsecured, T1 and T2 capital instruments issued at KBC Group
level and down-streamed to KBC Bank
13% 2%
8%
45KBC has strong buffers cushioning Sr. debt at all levels (FY 2020)
KBC Group
Senior
6 519
Tier 2
2 180
KBC Bank Additional Tier 1 KBC Insurance
1 500
Subordinated on loan by KBC Group Tier 2
6 519 CET1 (transitional) 500
18 441
Tier 2 Parent shareholders equity
122 1 681 Buffer for Sr. level 22.1 bn EUR 3 815
Additional Tier 1
1 500
CET1 (transitional)
14 578
Buffer for Sr. level 24.3bn EUR
Legacy T2 issued by KBC Bank will disappear over time
46
nominal amounts in million EURKBC complies with resolution requirements
MREL target applicable as from 31-12-2021
The resolution plan for KBC is based on a Single Point of Entry (SPE) approach at KBC Group level, with bail-in as the preferred resolution tool
SRB’s currently applicable approach to MREL is defined in the ‘2018 SRB Policy for the 2nd wave of resolution plans’ published on 16 January 2019,
which is based on the current legal framework (BRRD 1)
The actual binding target is 9.67% as % of TLOF as from 31-12-2021
SRB will communicate new targets (expected in April 2021), expressed as a percentage of Risk Weighted Assets (RWA) and Leverage Ratio Exposure
Amount (LRE), replacing the above-mentioned targets. The new targets need to be achieved by 1 January 2024; a binding interim target as from 1
January 2022 will be defined as well
MREL target = 9.67% as % of TLOF Actual in % of TLOF
MCC 3.1% (CBR – 1.25%)
10.1%
1.75% P2R
2.3% HoldCo senior
RCA @ 95% RWA
8% P1 = 26.3% 0.7% T2 part of own funds
as % of RWA 0.5% AT1
4.35% CBR
x RWA/TLOF
balance
LAA 1.75% P2R
31/12/2017 6.6% CET1
@ 100% RWA
=
9.67% as %
8% P1
of TLOF
TLOF Total Liabilities and Own Funds
LAA Loss Absorbing Amount FY20
RCA ReCapitalisation Amount
MCC Market Confidence Charge 47
CBR Combined Buffer Requirement = Conservation Buffer (2.5%) + O-SII buffer (1.5%) + countercyclical buffer (0.15% in previous target; 0.35% in revised target)Available MREL as a % of TLOF
Available MREL (*) as a % of TLOF
10.4% 10.0% ** 10.1%
9.6% 9.8% 9.4%
9.3% 9.3% The decrease of MREL as a % of TLOF as
of 1H20 can be fully explained by the
participation in TLTRO III for an amount
of 19.5bn EUR in June 2020. Excluding
this, MREL would have amounted to
10.8% at the end of FY20
1Q19 1H19 9M19 FY19 1Q20 1H20***9M20***FY20***
* Hybrid approach
** Taking into account the withdrawal of the final gross dividend over 2019 profit of 2.5 EUR per share
*** As of 1H20, MREL ratio includes the impact of IFRS9 transitional measures
48Latest credit ratings
Moody’s S&P Fitch
Senior Unsecured Baa1 A- A
Tier II - BBB BBB+
Group
Additional Tier I Ba1 BB+ BBB-
Short-term P-2 A-2 F1
Outlook Stable Negative Negative
Covered Bonds Aaa - AAA
Senior Unsecured A1 A+ A+
- BBB -
Bank
Tier II
Short-term P-1 A-1 F1
Outlook Stable Stable Negative
-
Insurance
Financial Strength Rating - A
Issuer Credit Rating - A -
Outlook - Negative -
Latest updates triggered by the COVID-19 pandemic:
• 23 Apr 2020: S&P revised KBC Group and KBC Insurance outlook to negative. The outlook for KBC Bank remains Stable because of the
substantial buffers of already existing bail-in-able debt.
• 30 Mar 2020: Fitch revised KBC Group and KBC Bank outlook to negative. Next to that, driven by methodology changes, Fitch
downgraded Tier 2 debt by one notch to ‘BBB+ and upgraded AT1 debt by one notch to ‘BBB-’.
49Contents
1. Strategy and business profile
2. Financial performance
3. Solvency, liquidity and funding
4. Covid-19
5. Covered bond programme
6. Green bond framework
7. Looking forward
Appendices
50COVID-19 (1/9)
Latest status of government & sector measures in each of our core countries
Belgium Czech Republic Hungary
Opt-in: 3 months for consumer finance , 6-9 Opt-in: 3 or 6 months Opt-out: a blanket moratorium originally until 31
months for mortgages and non-retail loans, Application period finished on 30 Sep 2020, however end of Dec 2020
Deferral of payments
originally until 31 Oct 2020 Oct 2020 all deferrals expired Extension of the deferral period until 30 Jun 2021
Application period extended for a second time (to • Applicable for retail and non-retail clients • Applicable for retail and non-retail clients
31 Mar 2021). All deferrals to expire at the end of • For private persons and entrepreneurs: deferral of • Extension conditions are the same as the
June (max. total deferral period of 9 months) principal and interest payments, while only original moratorium
• For private persons: deferral of principal deferral of principal payments for non-retail clients • Deferral of principal and interest payments
and interest payments, while only deferral • Interest is accrued over the deferral period, but • Interest is accrued over the deferral period, but
of principal payments for non-retail clients must be paid in the final instalment, resulting in a unpaid interest cannot be capitalised and must
• Interest is accrued over the deferral modification loss for the bank (-5m EUR, booked in be collected on a linear basis during the
period, apart from families with net 2Q) remaining (extended) lifetime. This resulted in
income of less than 1,700 EUR. For the • For consumer loans, the interest during the a modification loss for the bank (-18m EUR
latter group, this results in a modification deferral period may not exceed the 2-week repo booked in 1Q; revised to -11m EUR in 2Q and
loss for the bank (-11m EUR booked in 2Q) rate + 8% increased to -12m EUR in Q4 due to the extension)
• A state guarantee scheme of up to 40bn EUR • The Czech-Moravian Guarantee and Development • A guarantee scheme is provided by
to cover losses incurred on future non-retail Bank (CZMRB) launched several guarantee Garantiqa and the Hungarian Development
loans granted before 31 Dec 2020 to viable programs (COVID II, COVID II Praha, COVID III) for Bank. These state guarantees can cover up
Guarantee Scheme &
liquidity assistance
companies, with a tenor of max. 12 months working capital loans provided by commercial banks to 90% of the loans with a maximum term of
and a maximum interest rate of 1.25%. to non-retail clients. The loan amount is 6 years
Guarantee covers 50% of losses above 3% of guaranteed up to 80% or 90% of the loan amount. • Funding for growth scheme (launched by
total credit losses and 80% above 5% of losses Interest on these loans is subsidised up to 25% MNB): a framework amount of 4.2bn EUR
• As of 3Q, a revised state guarantee scheme of (COVID II). COVID III extended until Jun 2021 for SMEs that can receive loans with a 20-
up to 10bn EUR has been in place to cover • The Export Guarantee and Insurance Corporation year tenor and at a maximum interest rate
losses on future SME loans granted before 31 (EGAP) under its COVID Plus program offers of 2.5%
guarantees on loans provided by commercial banks. • Annual interest rate on personal loans
Dec 2020 (extended until Jun 2021), with a
EGAP guarantees up to 90% of the loan amount, granted by commercial banks may not
tenor between 1 and 3 years (extended to 5
depending on the rating of the debtor. The program exceed the central bank base rate by more
years) and with a maximum interest rate of 2% than 5pp (until 31 Dec 2020)
(or 2.5% if tenor > 3 years). Guarantee covers is aimed at companies in which exports accounted
for more than 20% of turnover in 2019
80% of all losses 51COVID-19 (2/9)
Latest status of government & sector measures in each of our core countries
Slovakia Bulgaria Ireland
Opt-in: 9 months or 6 months (for leases) Opt-in: 9 months (deferral until 31 Dec 2021 at Opt-in: 3 to 6 months
Deferral of payments
Application period is still running (but most the latest) Application period expired on 30 Sep 2020
payment holidays will end in 1Q 2021) Application period expires on 31 Mar 2021 • Applicable for mortgage loans, consumer
• Applicable for retail customers, SMEs and • Applicable for retail and non-retail customers finance loans and business banking loans
entrepreneurs • Deferral of principal with or without deferral with a repayment schedule
• Deferral of principal and interest payments of interest payments • Deferral of principal and interest payments
• Interest is accrued over the deferral period, but • For both, full and partial deferrals, the tenor is for up to 6 months (with review after 3
the customer has the option of paying all extended by 9 months (or 6+3) months) for mortgages & consumer finance
interest at once after the moratorium or paying • Interest is accrued over the deferral period and 3 months for business banking loans
it on a linear basis. The latter option would and repaid in 12 months for consumers; in 18 • Option for customers to extend their loan
result in an immaterial modification loss for the months (or 12+6) for non-retail or 60 months term by up to 6 months to match the
bank for mortgages in equal instalments payment holiday
• Interest is accrued over the deferral period
• Anti-Corona Guarantee program offered by the • 0.4bn EUR of state guarantees provided • The Irish authorities put substantial relief
Slovak Investment Holding (SIH) and aimed at by the Bulgarian Development Bank to measures in place, amongst other
Guarantee Scheme &
liquidity assistance
SMEs, consists of two components: (i) an 80% commercial banks. Of this amount, measures, via the SBCI. KBC Bank Ireland is
state guarantee with a 50% portfolio cap and (ii) 0.1bn EUR is used to guarantee 100% of mainly focused on individual customers,
an interest rate subsidy of up to 4% p.a. consumer loans, while 0.3bn EUR is therefore the relief programs for business
• In addition, financial aid in the form of state planned to be used to guarantee 80% of customers are less relevant
guarantee schemes, with guaranteed fee subsidy non-retail loans
can be provided by (i) the Export-Import Bank of
Slovakia (guarantee of up to 80% for loans < 2m
EUR) and the (ii) the Slovak Investment Holding
(guarantee of up to 90% for loans of 2-20m EUR).
No portfolio cap
52COVID-19 (3/9)
Overview of EBA compliant payment holidays and public Covid-19 guarantee schemes
Payment holidays – by country : Payment holidays – by segment :
Status: 31 Dec 2020 Loan deferrals Status: 31 Dec 2020 Loan deferrals Expired
granted granted loan deferrals
Expired Eur bn
% of total loan % of total
Total loan deferrals Total loan portfolio
Total
portfolio
Eur bn KBC Group 13,4 8% 8,7
KBC Group 13.4 8% 8.7 of which:
of which: Mortgages 4,7 7% 3,8
Belgium 7.4 7% 4.9 SME 4,0 12% 2,1
Czech Republic 2.2 7% 2.2 Corporate 3,9 9% 2,5
Hungary (opt-out) 1.6 32% 0.0
Slovakia 0.8 9% 0.3
Bulgaria 0.2 7% 0.2
Ireland 1.2 12% 1.1
Loans and advances under public Covid-19 By the end of December 2020:
guarantee schemes : • The volume of granted loans with payment holidays, according to the EBA
Status: 31 Dec 2020 Loans granted # obligors definitions, amounted to 13.4bn EUR or 8% of total loan book*
EUR m k • Approx. 9bn EUR of moratoria already expired, of which 96% have resumed
KBC Group 814 10 payments
of which: • Government guaranteed loans granted (under Covid-19 scheme) for 814m EUR
SME 411
Corporate 389
• Loans to customers, excluding reverse repos (and bonds)
53You can also read